
Business continuity
This article outlines how you can minimize the operational impact of your applications on the Kubernetes cluster if CAST AI can't provide services.
Risks
Kubernetes cluster is not cost-optimized
If Cast AI becomes unavailable during scale-down or quiet periods, it poses minimal to no risk to workload availability. It can only impact its cost efficiency.
Application pods can't start due to insufficient capacity
Workload Pods are pending, typically due to an increase in the number of Pod Replicas via the HPA or KEDA. Cast AI is expected to add new Kubernetes Nodes within 60-120 seconds, allowing the Kubernetes Scheduler to schedule all Pending Pods.
Detection
Pending Pod age
You can use your metrics from the Kubernetes API to determine the age of the pending pods.
It is recommended that alerts be set if the pending period is 15 minutes or more. However, such notifications can add to alert noise, as misconfiguration of the workload manifest will leave the Pod indefinitely in the Pending phase.
kube_pod_status_phase{phase="Pending"}
Action: This alert should trigger further investigation, as it does not tell whether it's an application misconfiguration or another issue.
Kubernetes Cluster is not communicating with Cast AI
Cast AI's operations rely on the platform's components running in the subject Kubernetes cluster and network communication with the Cast AI API.
castai_autoscaler_agent_snapshots_received_total metric indicates that the Cast AI agent can deliver Kubernetes API changes ("snapshots") to Cast AI SaaS and get a delivery confirmation. If this metric drops to 0, the Cast AI agent is not running, or something else prevents the snapshot delivery.
Action: Check if the Cast AI agent runs in the castai-agent namespace. If it's not, describe the pod and check its logs. It can be due to a network/firewall issue or another reason why Cast AI is unreachable over the internet.
Cast AI receives data from the agent, but it doesn't process the snapshot
If castai_autoscaler_agent_snapshots_received_total is not 0, but castai_autoscaler_agent_snapshots_processed_total is 0, it's 100% Cast AI issue.
The Cast AI team should know this, but you can raise an incident within the Cast AI console or report it on Slack.
Fallback scaling
Manual
AKS
In AKS, the cluster autoscaler is integrated into a node pool group.
Adding the necessary capacity to the Kubernetes cluster to make sure all critical applications are running (not pending) is a top priority. This emergency capacity can be added manually or triggered automatically on a time delay.
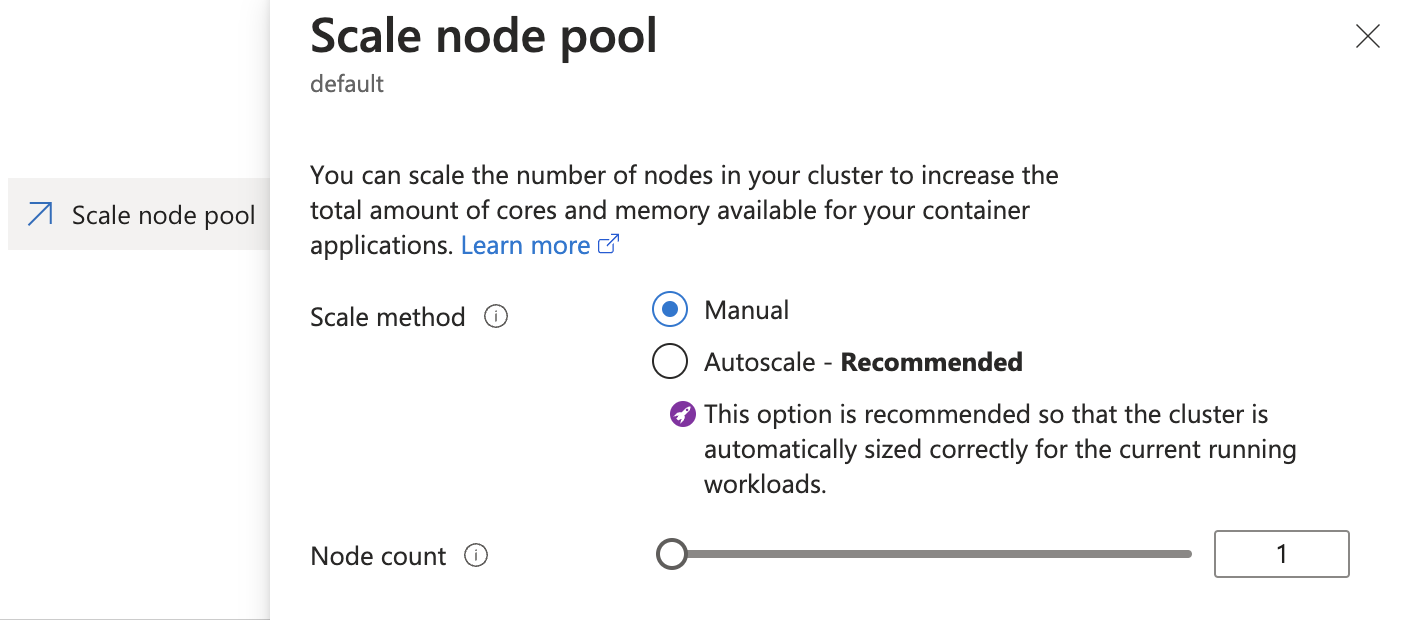
During the Cast AI onboarding, the user usually disables the cluster autoscaler in the native node pool. In an emergency, you can manually enable it again in the Azure portal in a web browser
AKS node pool "Scale" configuration to "Autoscale".
To enable the cluster autoscaler on the default node pool using the az CLI, use the following command:
az aks nodepool update --enable-cluster-autoscaler -g MyResourceGroup -n default --cluster-name MyClusterGKE
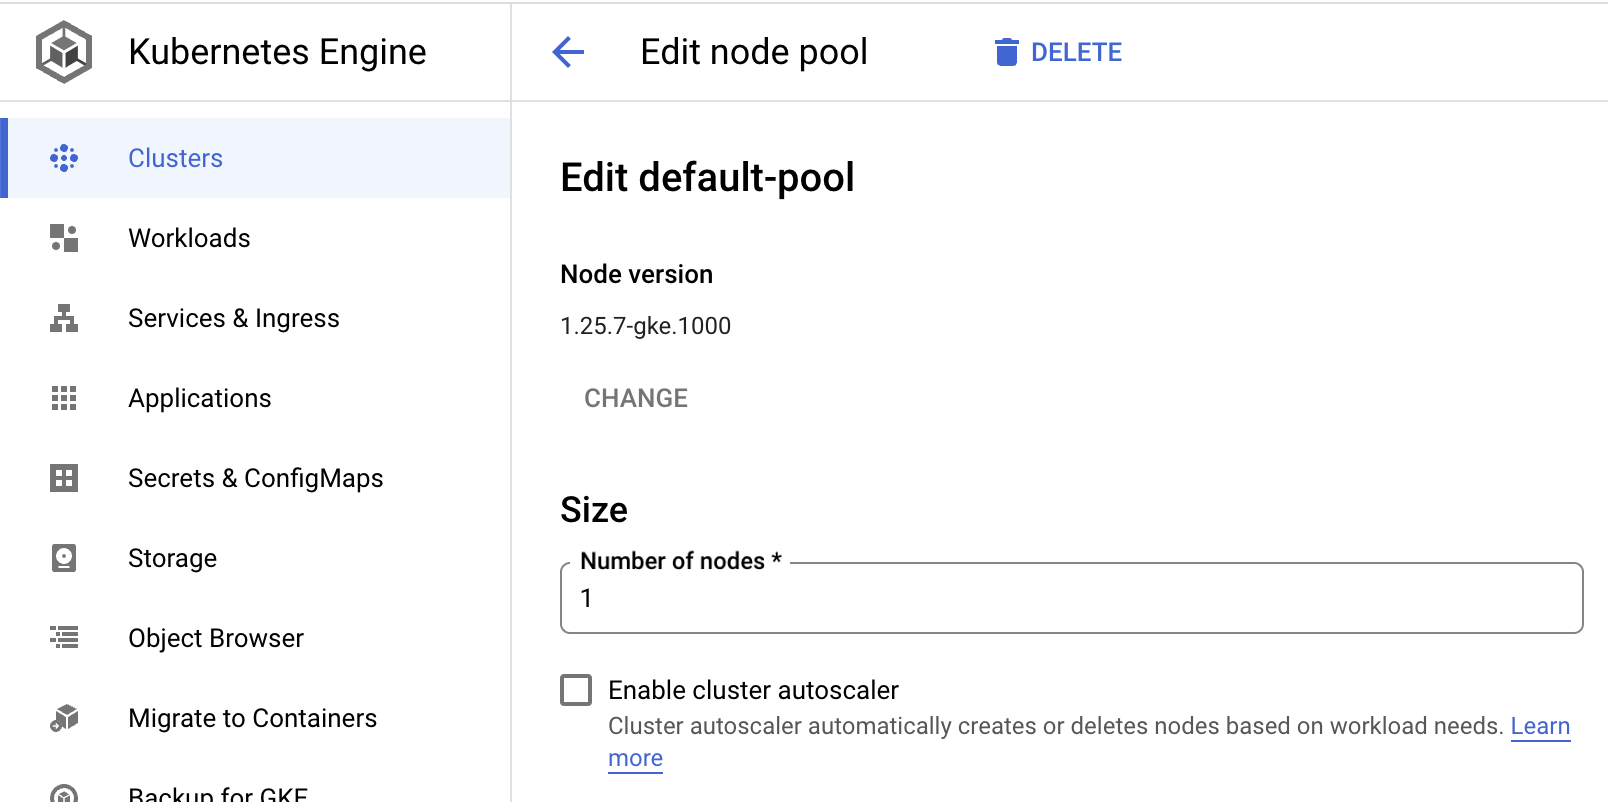
Adding the necessary capacity to the Kubernetes cluster to make sure all critical applications are running (not pending) is a top priority. This emergency capacity can be added manually or triggered automatically on a time delay.
During the Cast AI onboarding, the user usually disables the cluster autoscaler in the native node pool. In an emergency, you can manually enable it again in the GCP portals in a web browser.
GKE default node pool configuration "Enable cluster autoscaler".
EKS
In EKS, the autoscaler usually runs inside the cluster, and with Cast AI, it is scaled to 0 replicas. Scale the cluster autoscaler replica to 1 to manually fall back on autoscaling.
Enabling the cluster autoscaler again will reinflate the autoscaling Group/node pool based on pending pods.
Fallback when Node Templates are in use
Some workloads will have placement logic that uses NodeAffinity or NodeSelector to require nodes with specific labels, such as "mycompany=spark-app" or "pool=gpu."
To satisfy these placement requirements, users set up Node Templates. However, if you need to fall back to node pools or autoscaling groups, configure labels similar to those used on the Node Templates. As in the above scenario, the cluster autoscaler should be enabled for these node pools or ASGs.
Automatic
Automatic fallback logic assumes that the cluster autoscaler is always on, but it works with a delay. This setting prioritizes the Nodes Cast AI creates, but if the platform cannot add capacity, the cluster autoscaler resumes its Node creation abilities.
Each Node Template would have a matching fallback ASG created to align with corresponding Node Template selectors as described in the "Fallback when Node Templates are in use" section above.
Use cluster-autoscaler as a fallback autoscaler
Add extra flags to the container command section:
--new-pod-scale-up-delay=600s – to configure a global delay.
If setting up a secondary cluster autoscaler:
--leader-elect-resource-name=cluster-autoscaler-fallback – lease name to avoid duplicating the legacy autoscaler.
Make sure the cluster role used by cluster-autoscaler's RBAC permissions allows the creation of a new lease:
- apiGroups:
  - coordination.k8s.io
  resourceNames:
  - cluster-autoscaler
  - cluster-autoscaler-fallback
  resources:
  - leases
  verbs:
  - get
  - update
Example of a fallback autoscaler configuration:
 spec:
      containers:
      - command:
        - ./cluster-autoscaler
        - --v=4
        - --leader-elect-resource-name=cluster-autoscaler-fallback
        - --new-pod-scale-up-delay=600s
        - --stderrthreshold=info
        - --cloud-provider=aws
        - --skip-nodes-with-local-storage=false
        - --expander=least-waste
        - --node-group-auto-discovery=asg:tag=k8s.io/cluster-autoscaler/enabled,k8s.io/cluster-autoscaler/v1
        image: registry.k8s.io/autoscaling/cluster-autoscaler:v1.22.2
Use Karpenter as a fallback autoscaler
If Karpenter is already configured for the Kubernetes cluster, you can use Karpenter as the fallback autoscaler instead of cluster-autoscaler.
Edit the Karpenter deployment and change the environment variables BATCH_MAX_DURATION and BATCH_IDLE_DURATION to 600s:
`  spec:
     containers:
     - env:
        - name: BATCH_MAX_DURATION
          value: 600s
        - name: BATCH_IDLE_DURATION
          value: 600s
        ...
Spot Drought Testing
You can use our spot drought tool and runbook to understand how your workloads will behave during a mass spot interrupt event or how the autoscaler will respond to a lack of spot inventory.
Spot Drought Tool
The spot drought tool required to run this test is available on our GitHub at the following link:
Spot Drought Runbook
Objective:
To assess the performance of applications on a test cluster during a simulated drought of Spot Instances.
Prerequisites
Test Cluster: A cluster with a significant scale and real workloads running on Spot Instances. This will be used for the simulation.
Python Environment: Ensure you have Python installed along with the requests library.
API Key: Prepare a full-access Cast AI API key, which can be created in the Cast AI console.
Organization ID: Your Cast AI Organization ID.
Cluster ID: The cluster ID for the target cluster.
Script: The Cast AI Spot Drought Tool provided above.
Steps
Preparing for the Simulation:
- Backup: Ensure you have made the necessary backups of your cluster configurations and any critical data. This is crucial if you need to roll back to a previous state.
- Set Up the Script:
- Open the provided Python script in your terminal or preferred IDE.
- Create a CASTAI_API_KEY environment variable in your terminal, or update the castai_api_key variable with your Cast AI API key.
- Update the organization_id variable with your Cast AI organization ID.
- Update the cluster_id variable with the ID of the target cluster.
Minimize Spot Instances Availability:
- Run the Python script in interactive mode:
python castai_spot_drought.py
- You should see a list of options to choose from.
- Choose 1: Add to blacklist to restrict the Spot Instances available to your test cluster
- Choose 2: Get blacklist to retrieve the blacklist and confirm that all instance families were added to the blacklist
Run the Interrupt Simulation:
- Using the Node List in the Cast AI console, identify a set of spot nodes (25% or more of the nodes in the cluster) and simulate an interruption using the three-dot menu on each node’s row.
- Ensure that the interruption occurs and monitor the immediate effects on the cluster.
- The response from the Cast AI autoscaler will depend on what policies are enabled and what features are selected in your node templates.
- We recommend performing this test with the Spot Fallback feature enabled in your node templates.
- Measure and Test Outcomes:
- Service Downtime: Monitor the services running on your cluster. Check if any service goes down or becomes unresponsive during the simulation.
- Error Responses: Track error rates and types. Note any spikes in errors or new types of errors that appear during the simulation.
- Latency: Measure your applications' response time. Compare the latency during the simulation with the usual latency figures to see if there are any significant differences.
- Other Metrics: Based on your application and infrastructure, you might want to monitor other metrics like CPU usage, memory usage, network bandwidth, etc.
Rollback:
Once you have captured all the necessary data and metrics:
- Return to your terminal, or rerun the script in interactive mode:
python castai_spot_drought.py
- Choose 3: Remove from blacklist to lift the restrictions and bring the cluster back to its normal state.
- Monitor the cluster to ensure it's back to regular operation and all the Spot Instances are available again.
Conclusion
After you've completed the simulation, review the captured data and metrics. This will give you insights into how your applications and infrastructure behave under Spot Instance drought conditions. Use this information to make any necessary adjustments to your setup for better fault-tolerance and performance.