Integrating Prometheus Metrics with New Relic
Integrating Cast AI metrics with New Relic
This guide explains how to integrate Cast AI metrics with New Relic using Prometheus, allowing you to visualize and analyze your cluster metrics alongside other observability data.
Prerequisites
Before starting the integration, ensure you have:
- Access to your Kubernetes cluster with sufficient permissions
- Helm CLI installed
kubectlCLI installed- A New Relic account and license key
- Basic familiarity with Prometheus and Kubernetes concepts
Step 1: Install Prometheus
If you don't already have Prometheus installed in your cluster, follow these steps:
- Add the Prometheus Helm repository:
helm repo add prometheus-community https://prometheus-community.github.io/helm-charts
helm repo update- Install Prometheus using Helm:
helm install prometheus prometheus-community/prometheus \
  --namespace monitoring \
  --create-namespace
Step 2: Install New Relic integration
-
Install the New Relic CLI following the instructions at New Relic CLI documentation
-
Add the New Relic Helm repository:
helm repo add newrelic https://helm-charts.newrelic.com
helm repo update- Install the New Relic Kubernetes integration:
helm install newrelic newrelic/nri-bundle \
  --set global.licenseKey=<YOUR_LICENSE_KEY> \
  --namespace newrelic \
  --create-namespace
--set global.cluster=<cluster_name>- Verify the installation and check if New Relic pods are running after this.
kubectl get pods -n newrelicStep 3: Configure Prometheus to scrape Cast AI metrics
Modify your Prometheus configuration to collect Cast AI metrics by editing the Prometheus ConfigMap. Add the following scrape configuration:
scrape_configs:
 - job_name: 'castai_cluster_metrics'
   scrape_interval: 15s
   scheme: https
   static_configs:
     - targets: ['api.cast.ai']
   metrics_path: '/v1/metrics/prom'
   authorization:
     type: 'Token'
     credentials: '{apiKey}'
Replace {apiKey} with your Cast AI API token. You can add multiple jobs to this section; please refer to Cast AI Metrics.
After updating the configuration, restart the Prometheus server pod:
kubectl delete pod -l app=prometheus-server -n monitoring
NoteIf you encounter YAML formatting errors when updating the ConfigMap, ensure proper indentation in your configuration. Common errors include incorrect spacing or missing keys. Refer to Kubernetes documentation.
Step 4: Verify metric collection
- Port forward the Prometheus server to verify metric collection:
kubectl port-forward svc/prometheus-server 9090:80 -n monitoring-
Open
http://localhost:9090/targetsin your browser, verify that the Cast AI jobs are listed and showing theUPstatus.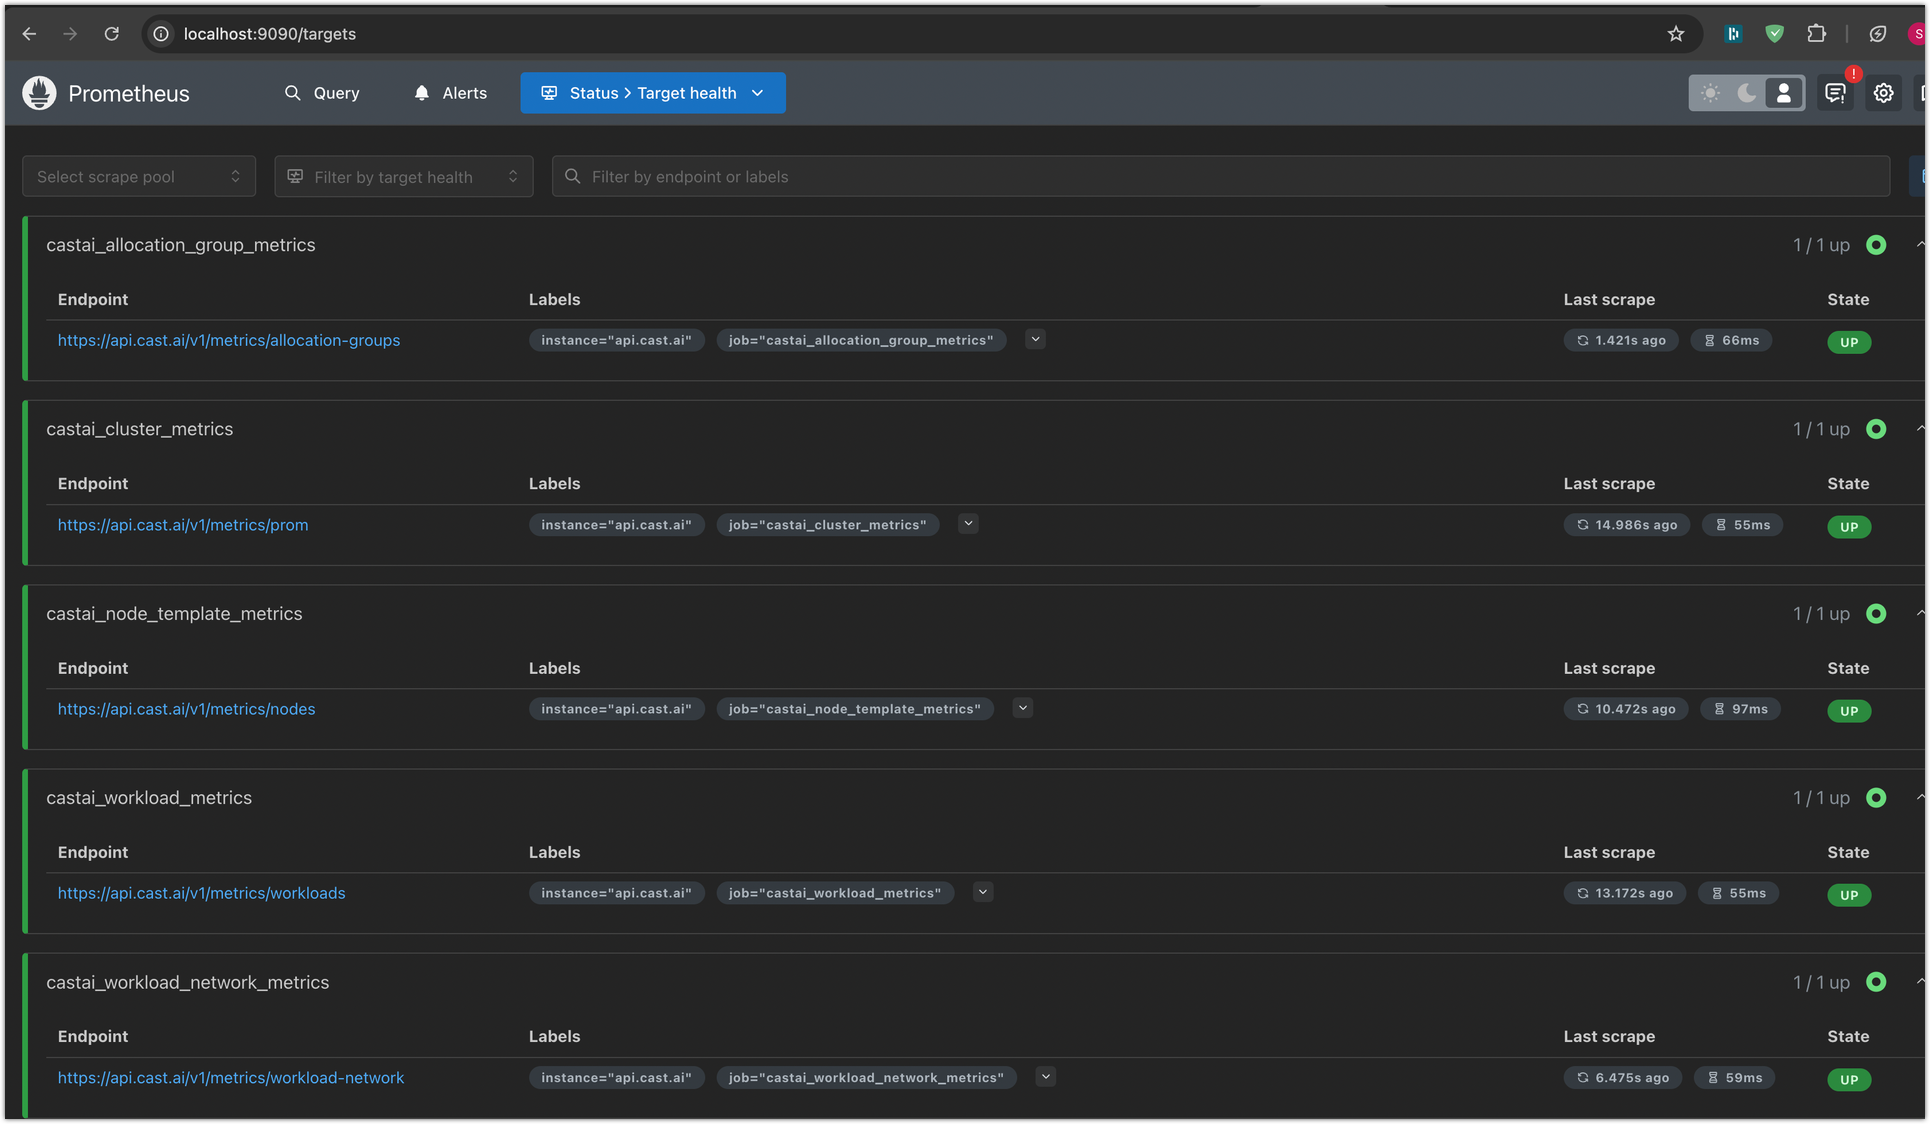
Step 5: Configure New Relic remote write integration
To send metrics from Prometheus to New Relic:
-
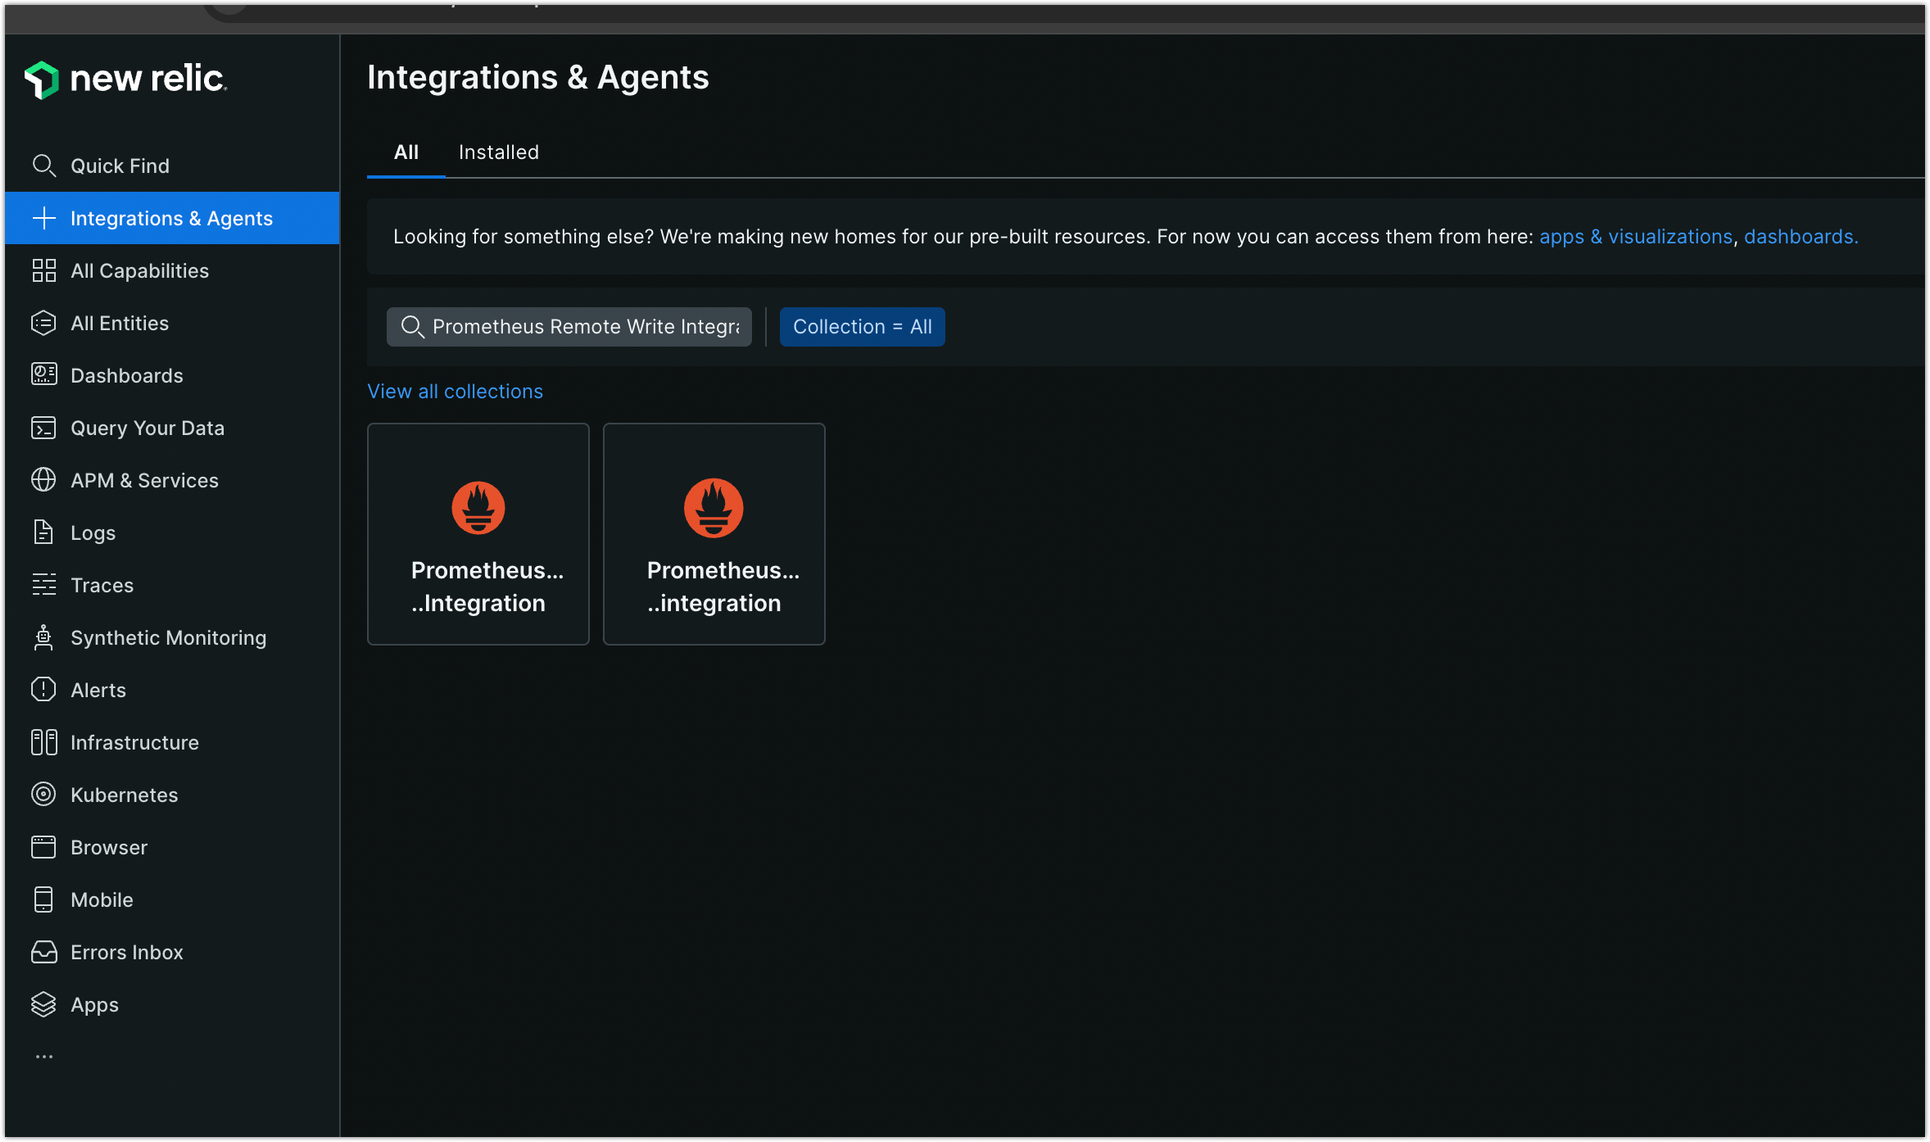
Navigate to the Integrations & Agents section in your New Relic dashboard
-
Select Prometheus Remote Write Integration and click Begin Installation
-
Configure the remote write integration:
a. Enter a name for your data source
b. Generate or select an existing API key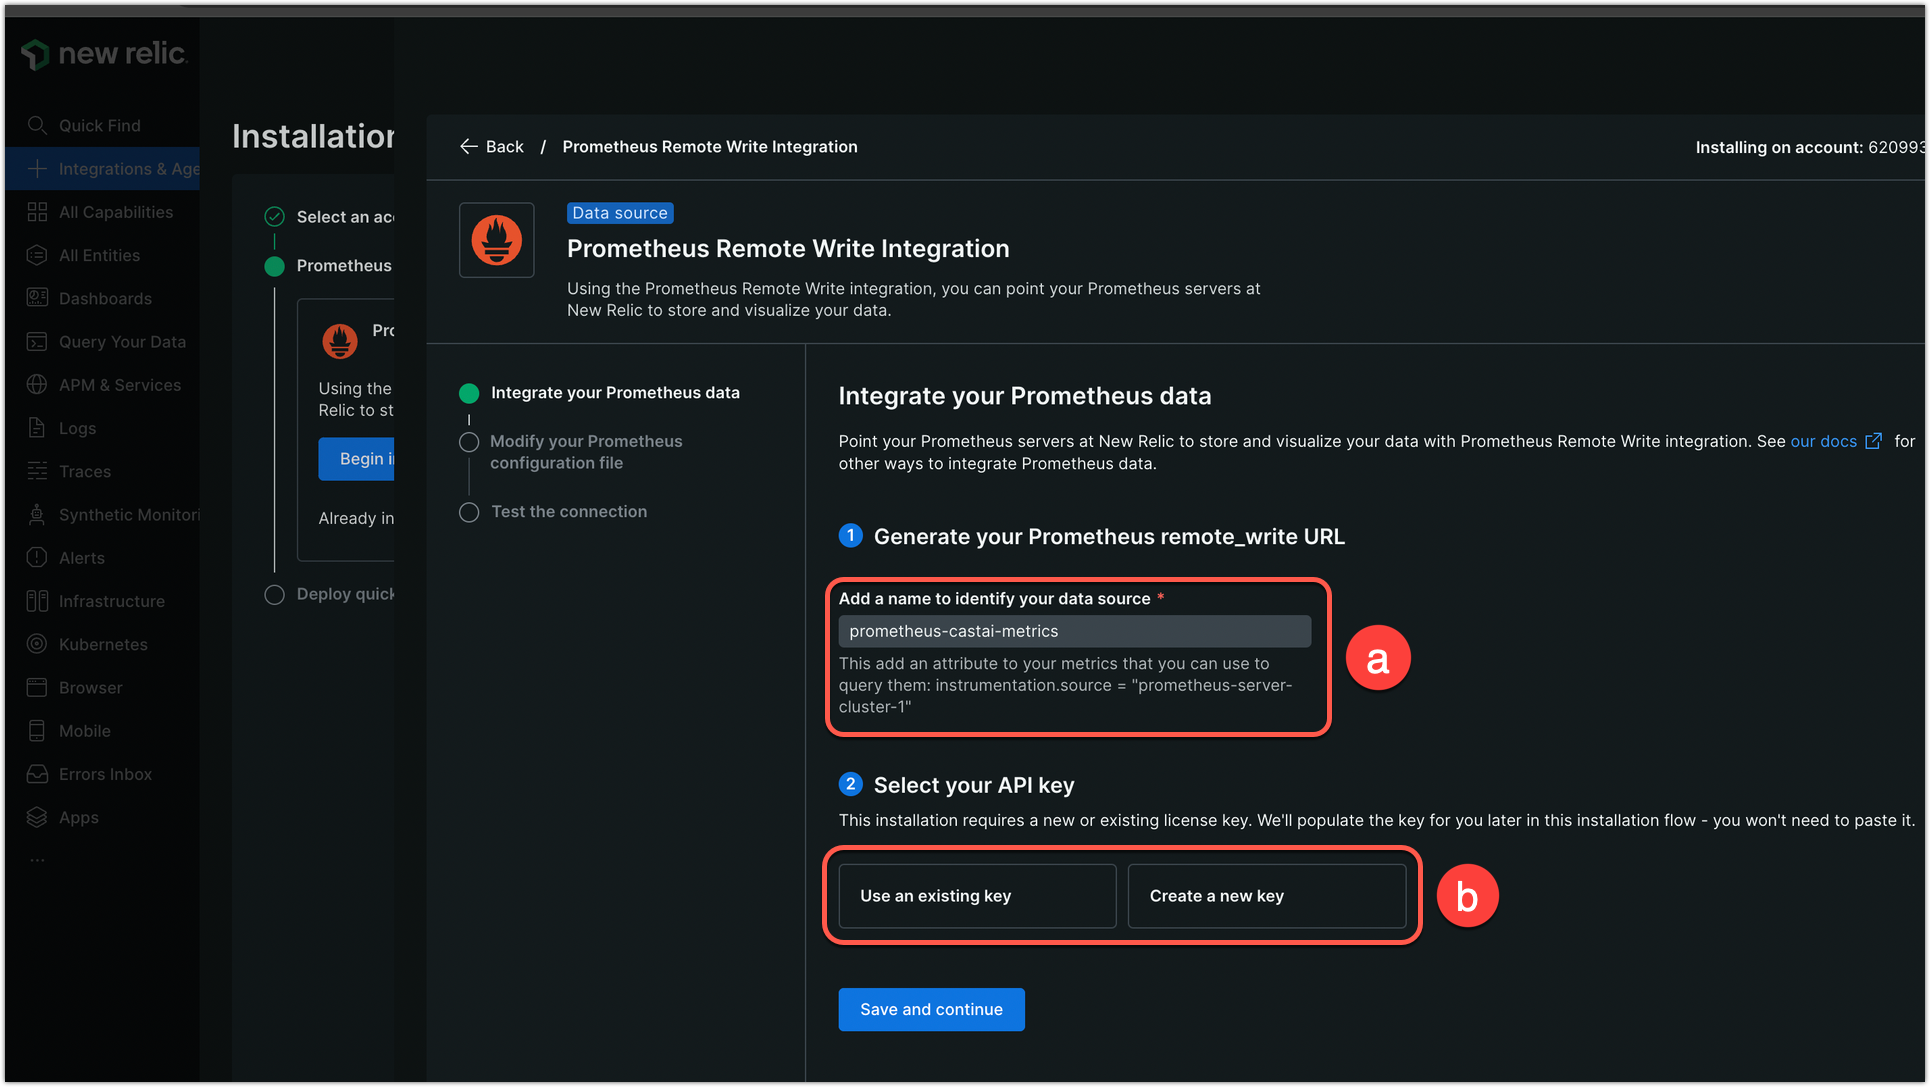
-
Copy the provided
remote_writeURL and add the remote write configuration to your Prometheus ConfigMap: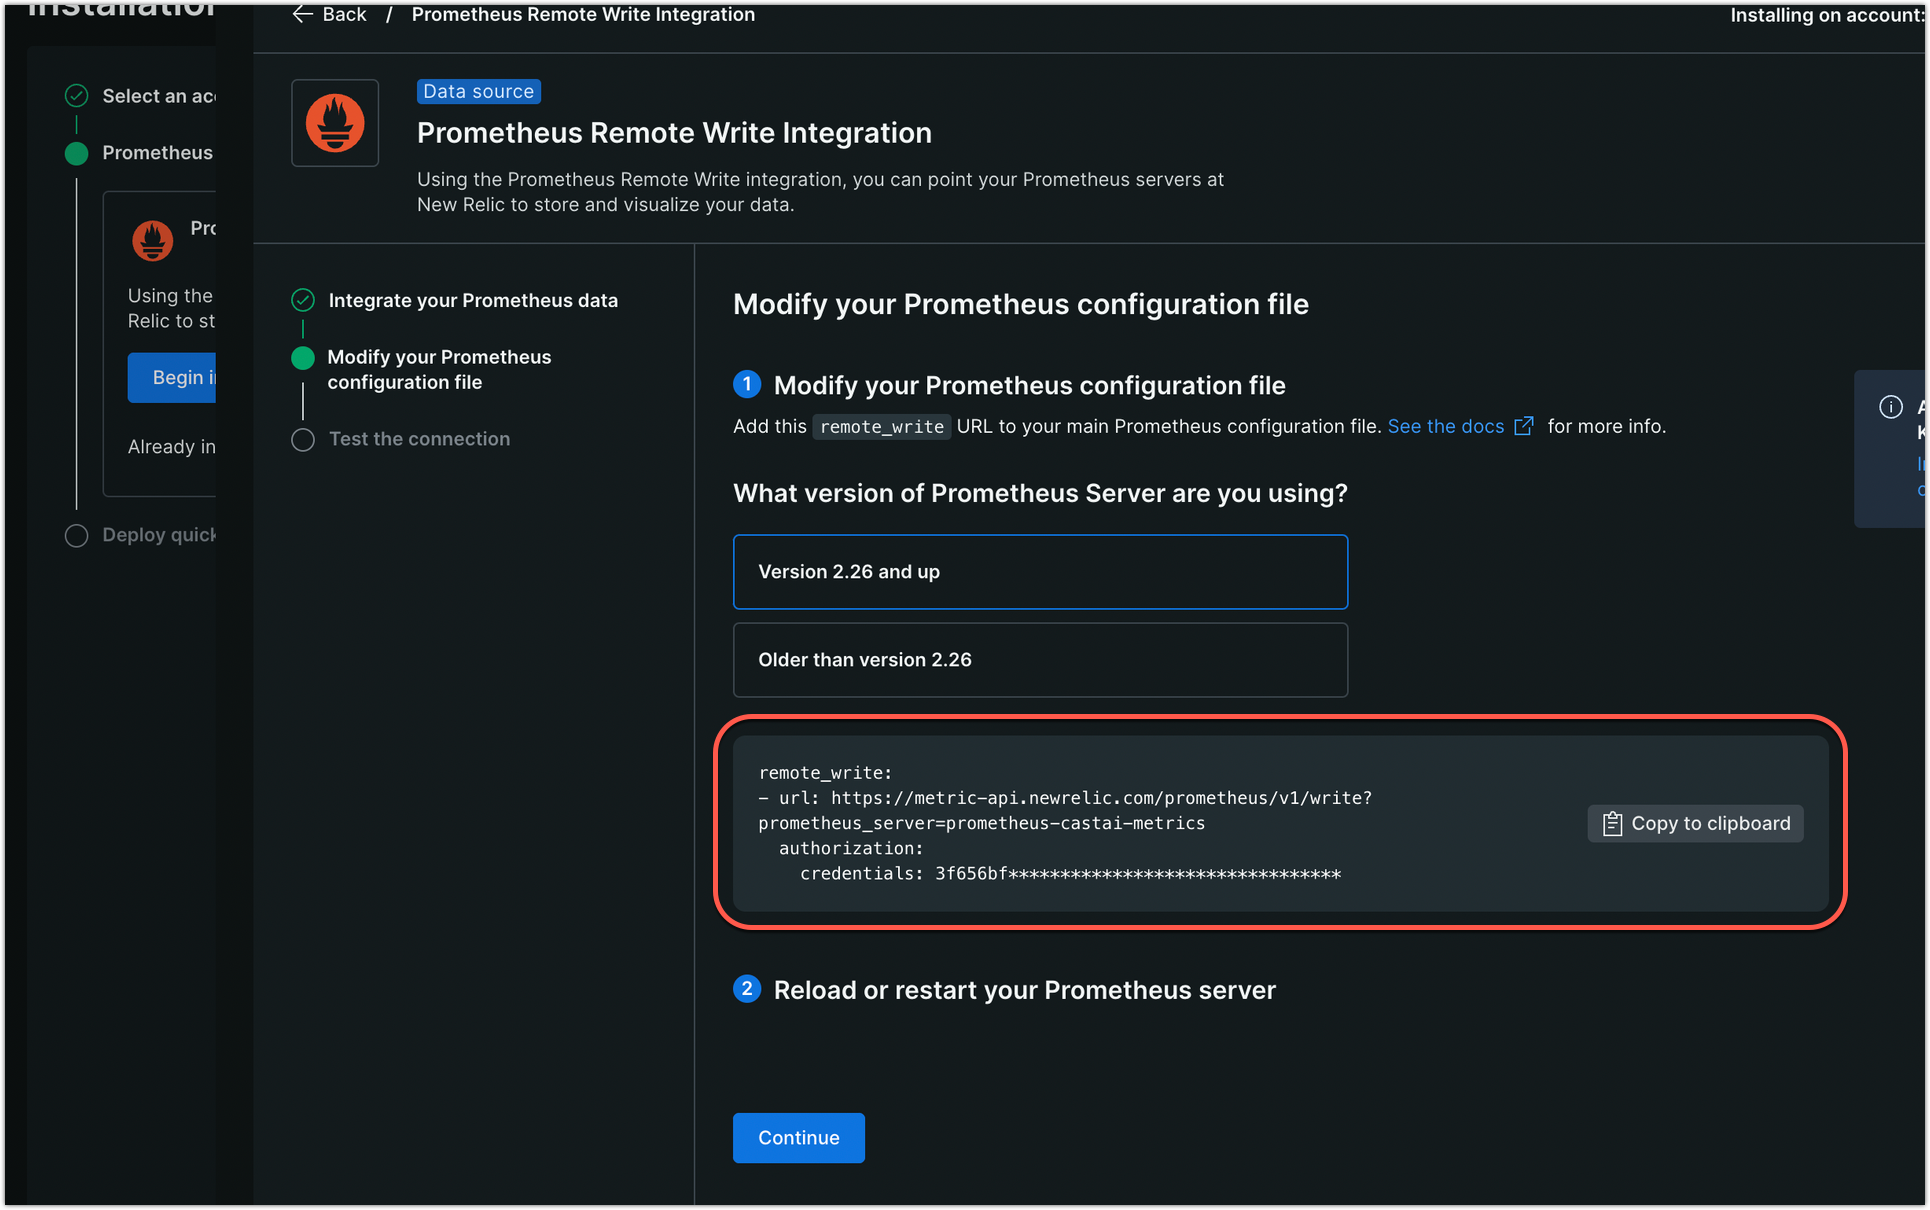
The format is as follows, as shown in the above screenshot:
remote_write:
  - url: https://metric-api.newrelic.com/prometheus/v1/write?prometheus_server=YOUR_DATA_SOURCE_NAME
    authorization:
credentials: YOUR_LICENSE_KEY- Restart the Prometheus server pod to apply the changes:
kubectl delete pod -l app=prometheus-server -n monitoringStep 6: Verify data in New Relic
-
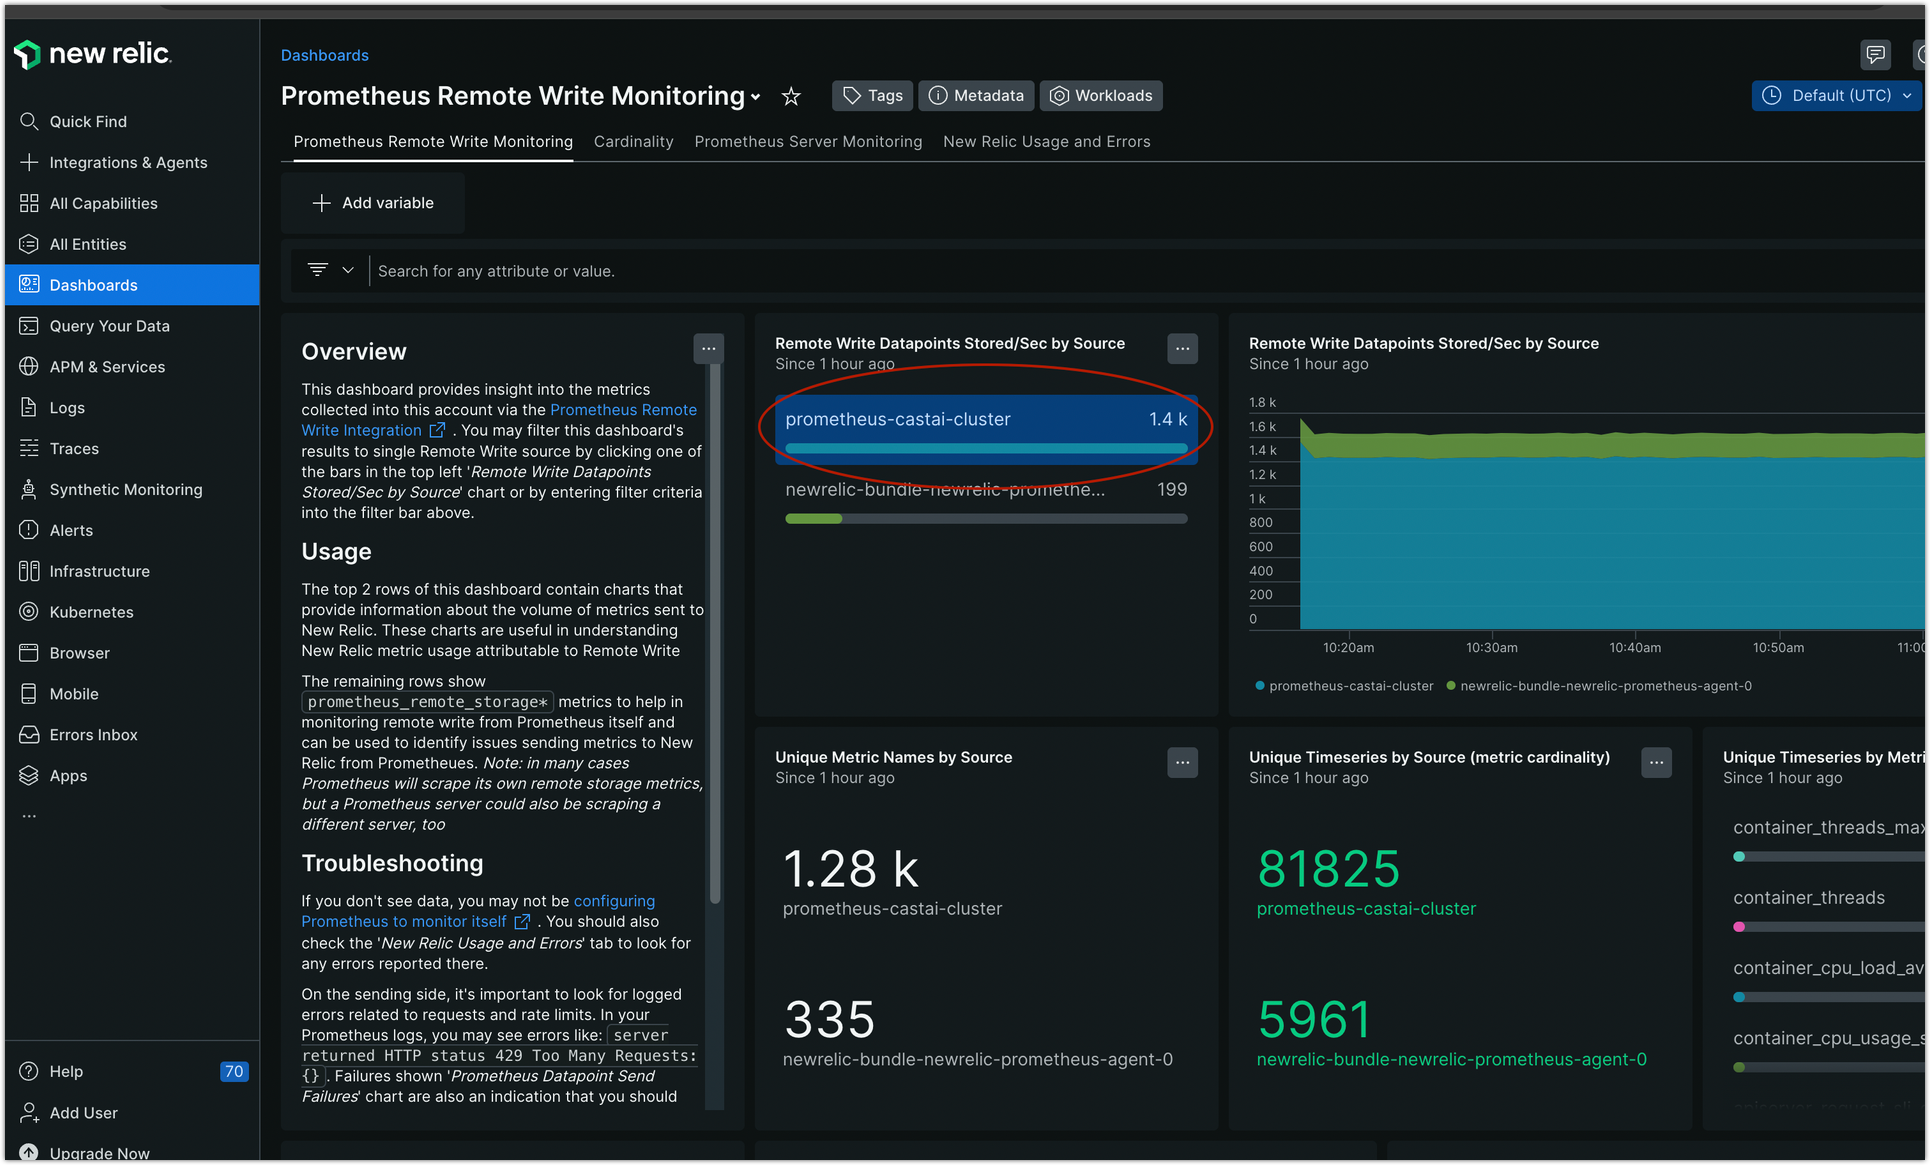
Navigate to the Dashboards section in New Relic
-
Confirm that your Prometheus data source is visible and metrics are streaming
-
You can now create custom dashboards and alerts using Cast AI metrics in New Relic
Available metrics
For a complete list of available metrics and their descriptions, refer to our metrics documentation.
Troubleshooting
If you encounter issues:
- Verify Prometheus scrape targets are working:
kubectl port-forward svc/prometheus-server 9090:80 -n monitoringThen check http://localhost:9090/targets
- Check Prometheus server logs:
kubectl logs -l app=prometheus-server -n monitoring- Verify New Relic integration pods are running:
kubectl get pods -n newrelic- For configuration errors, ensure proper YAML formatting and indentation in your Prometheus ConfigMap
For additional support, contact Cast AI support or refer to New Relic's Prometheus documentation.
Updated 7 days ago