
Cluster-level reports
Cluster cost report provides detailed data on your total compute spend costs for a given cluster. You can use it to analyze current expenses, get forecasts, and see exact daily costs per resource type. The report also lets you switch to a cumulative cost view.
| IMPORTANT! |
|---|
| The cluster report presents data calculations based on public cloud inventory data. Therefore, it doesn't reflect your custom pricing models. |
What you can find in the cluster report
You can browse the report using different pre-set time ranges:
- This month
- Last month
- Last 7, 14, and 30 days.
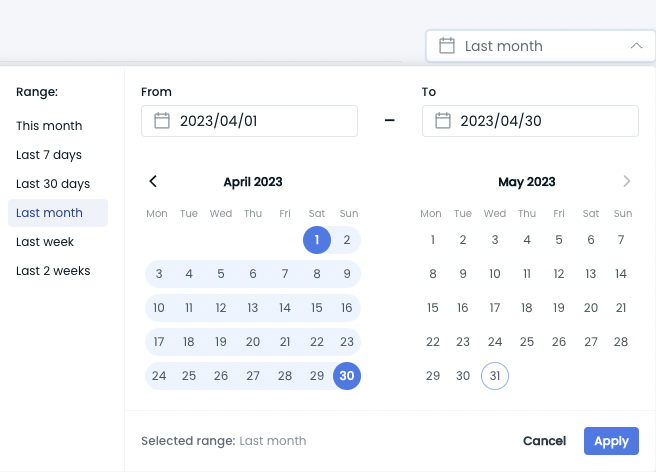
The report will yield different results depending on the selected time range, and some metrics may change accordingly.
The cluster report consists of three main parts:
- Cluster cost overview.
- Compute spend.
- Daily compute spend.
What’s inside each report section:
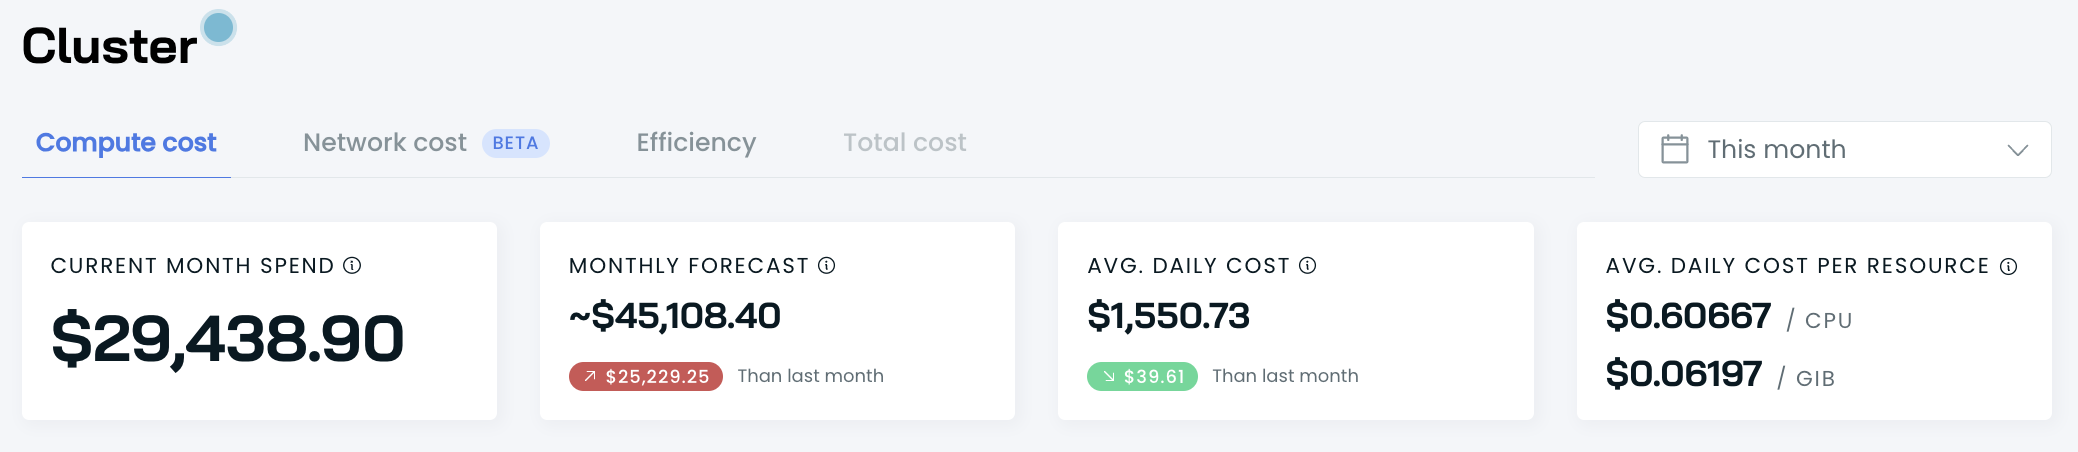
1. Cluster cost overview
The top report section summarizes your cluster expenses for the selected period. It includes a monthly forecast, average daily cost, and avg. daily cost per resource type (CPU and MEM).
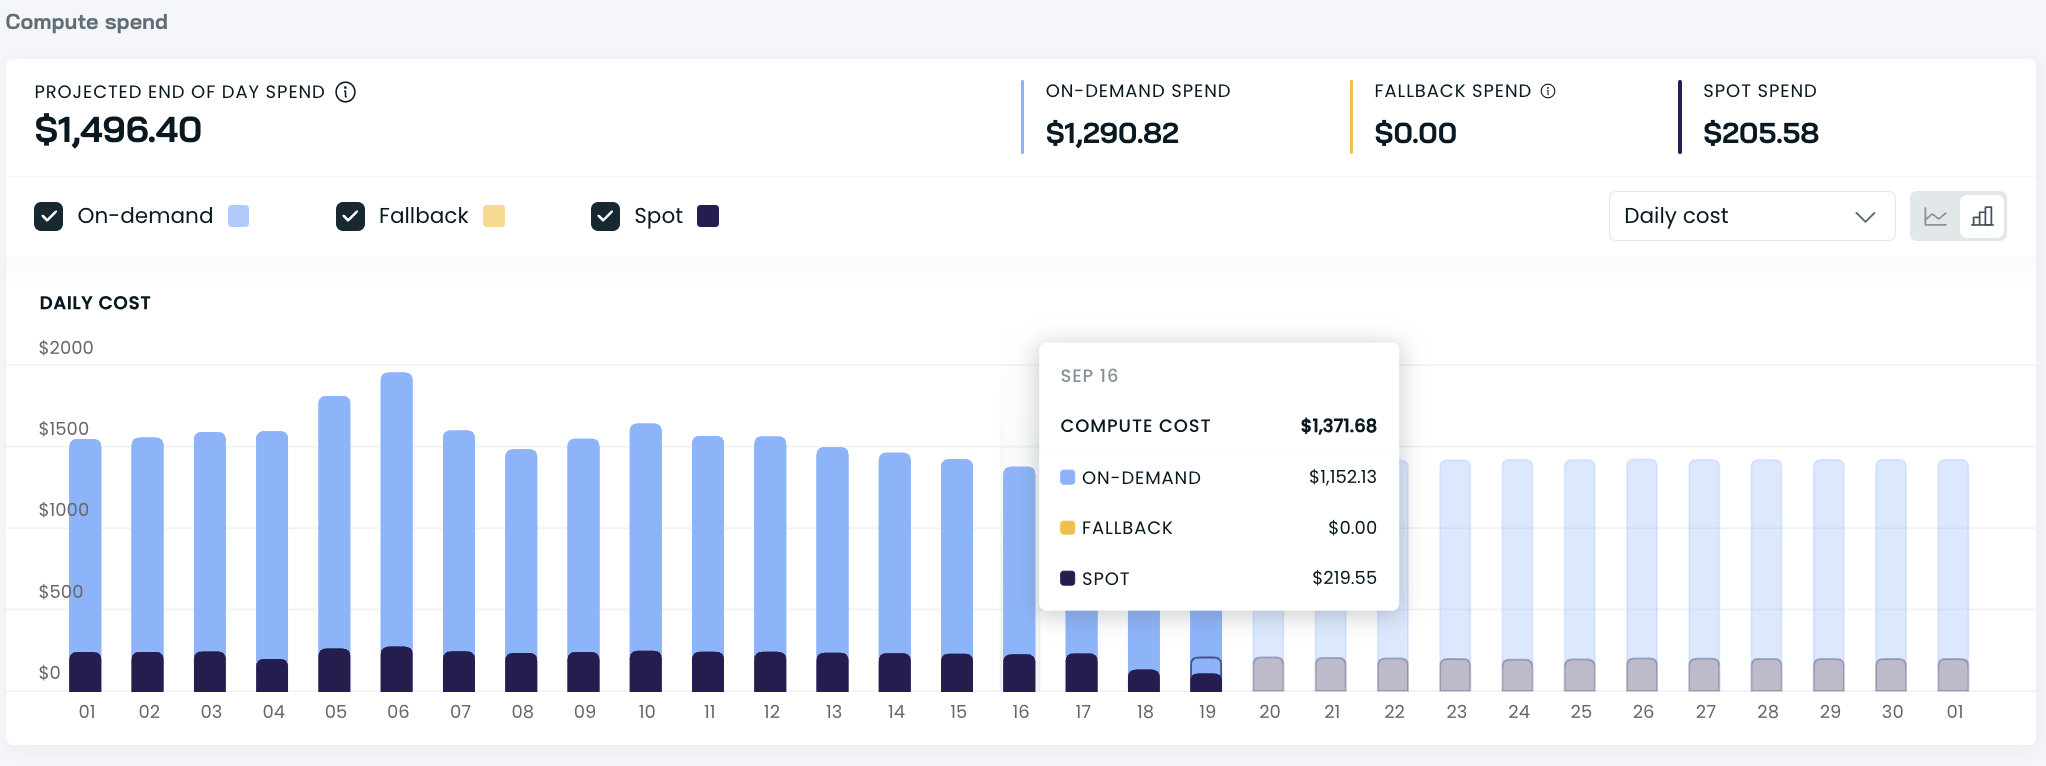
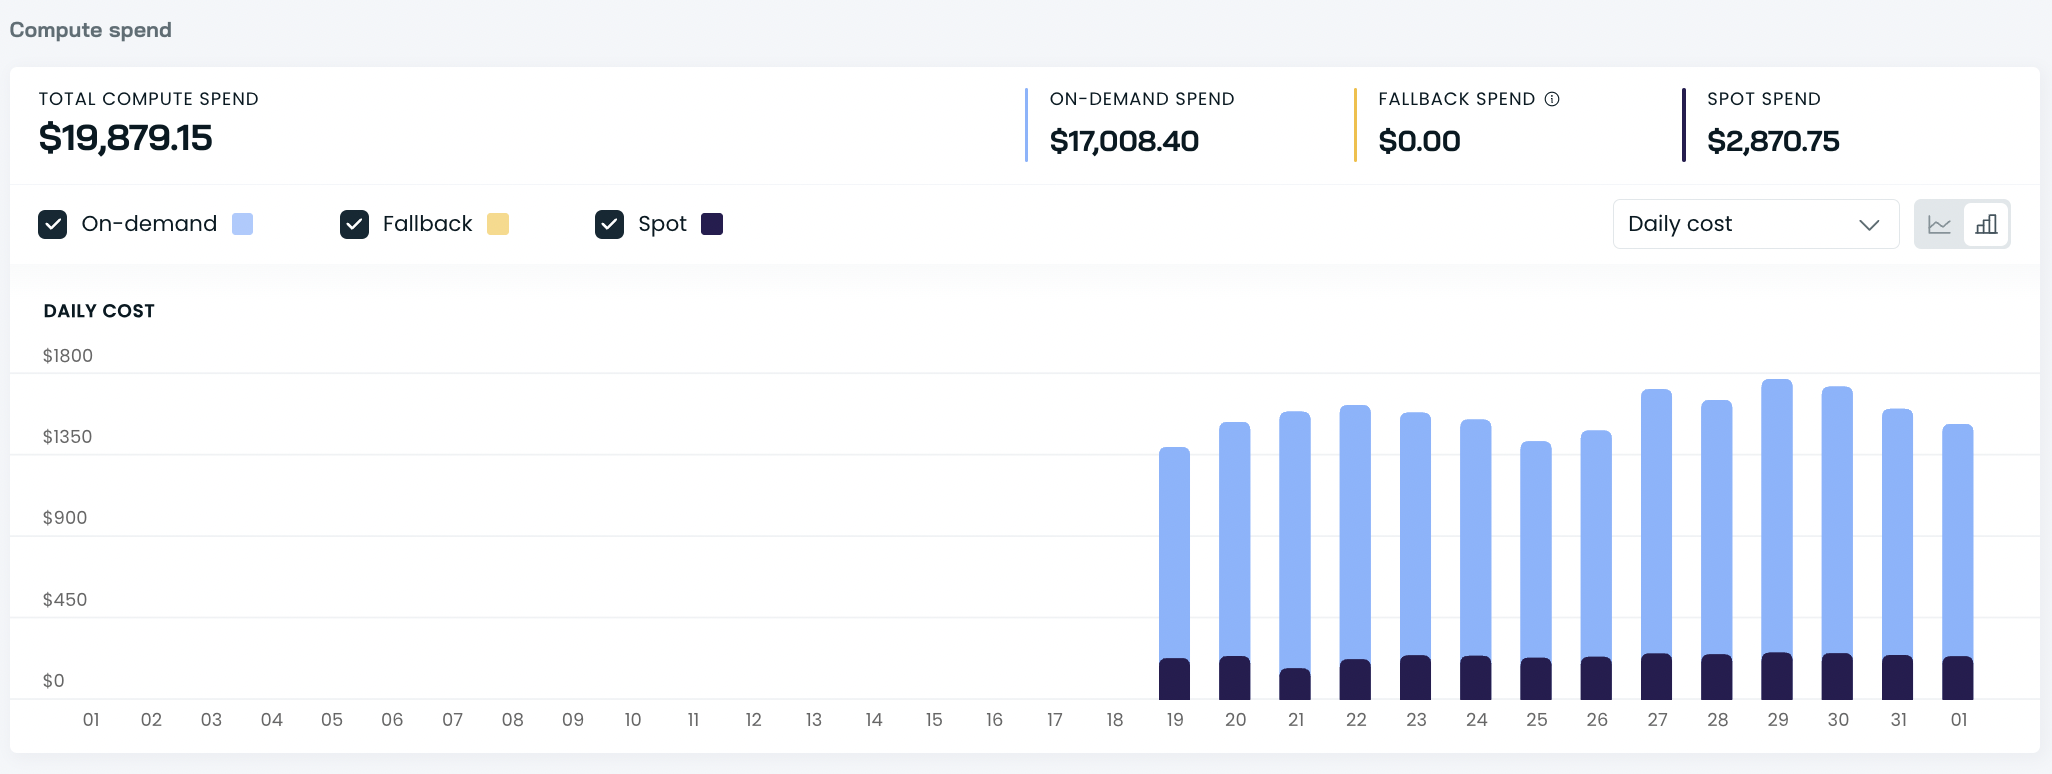
2. Compute spend
This section presents your total compute costs. You can further break down expenses by on-demand, fallback, and spot instances. You can switch between a daily and cumulative view.
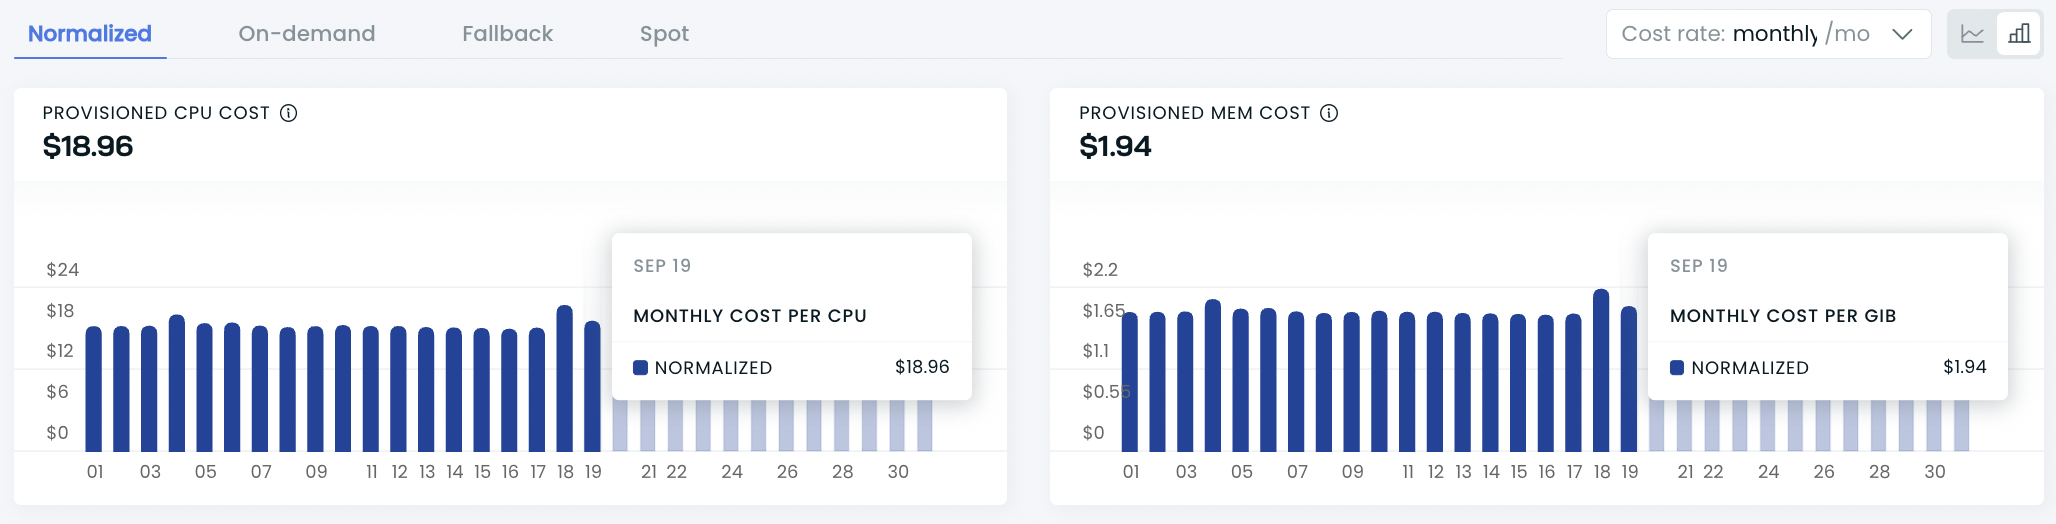
This part of the report also presents the cost of provisioned CPU and MEM, which you can further analyze by normalized, on-demand, fallback, and spot instances. You can switch between hourly, daily, and monthly cost rates.
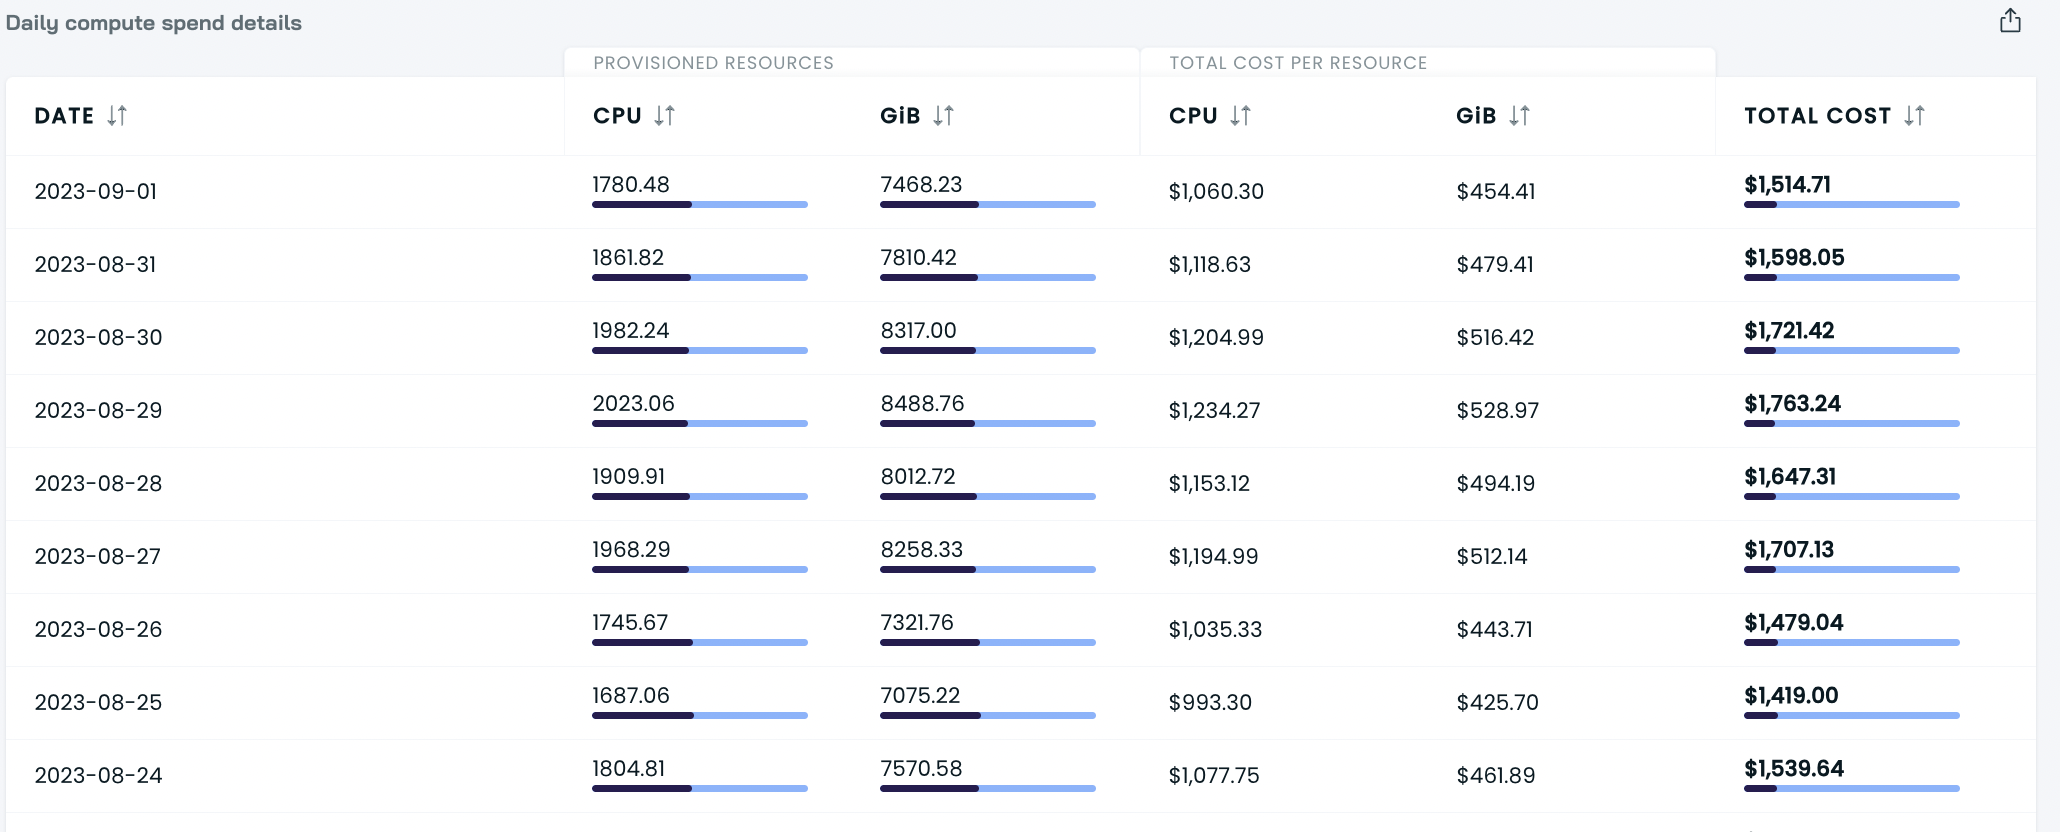
3. Daily compute spend details
In this part, you can find the daily costs of provisioned resources broken down by CPU and MEM and the total daily cost per resource.
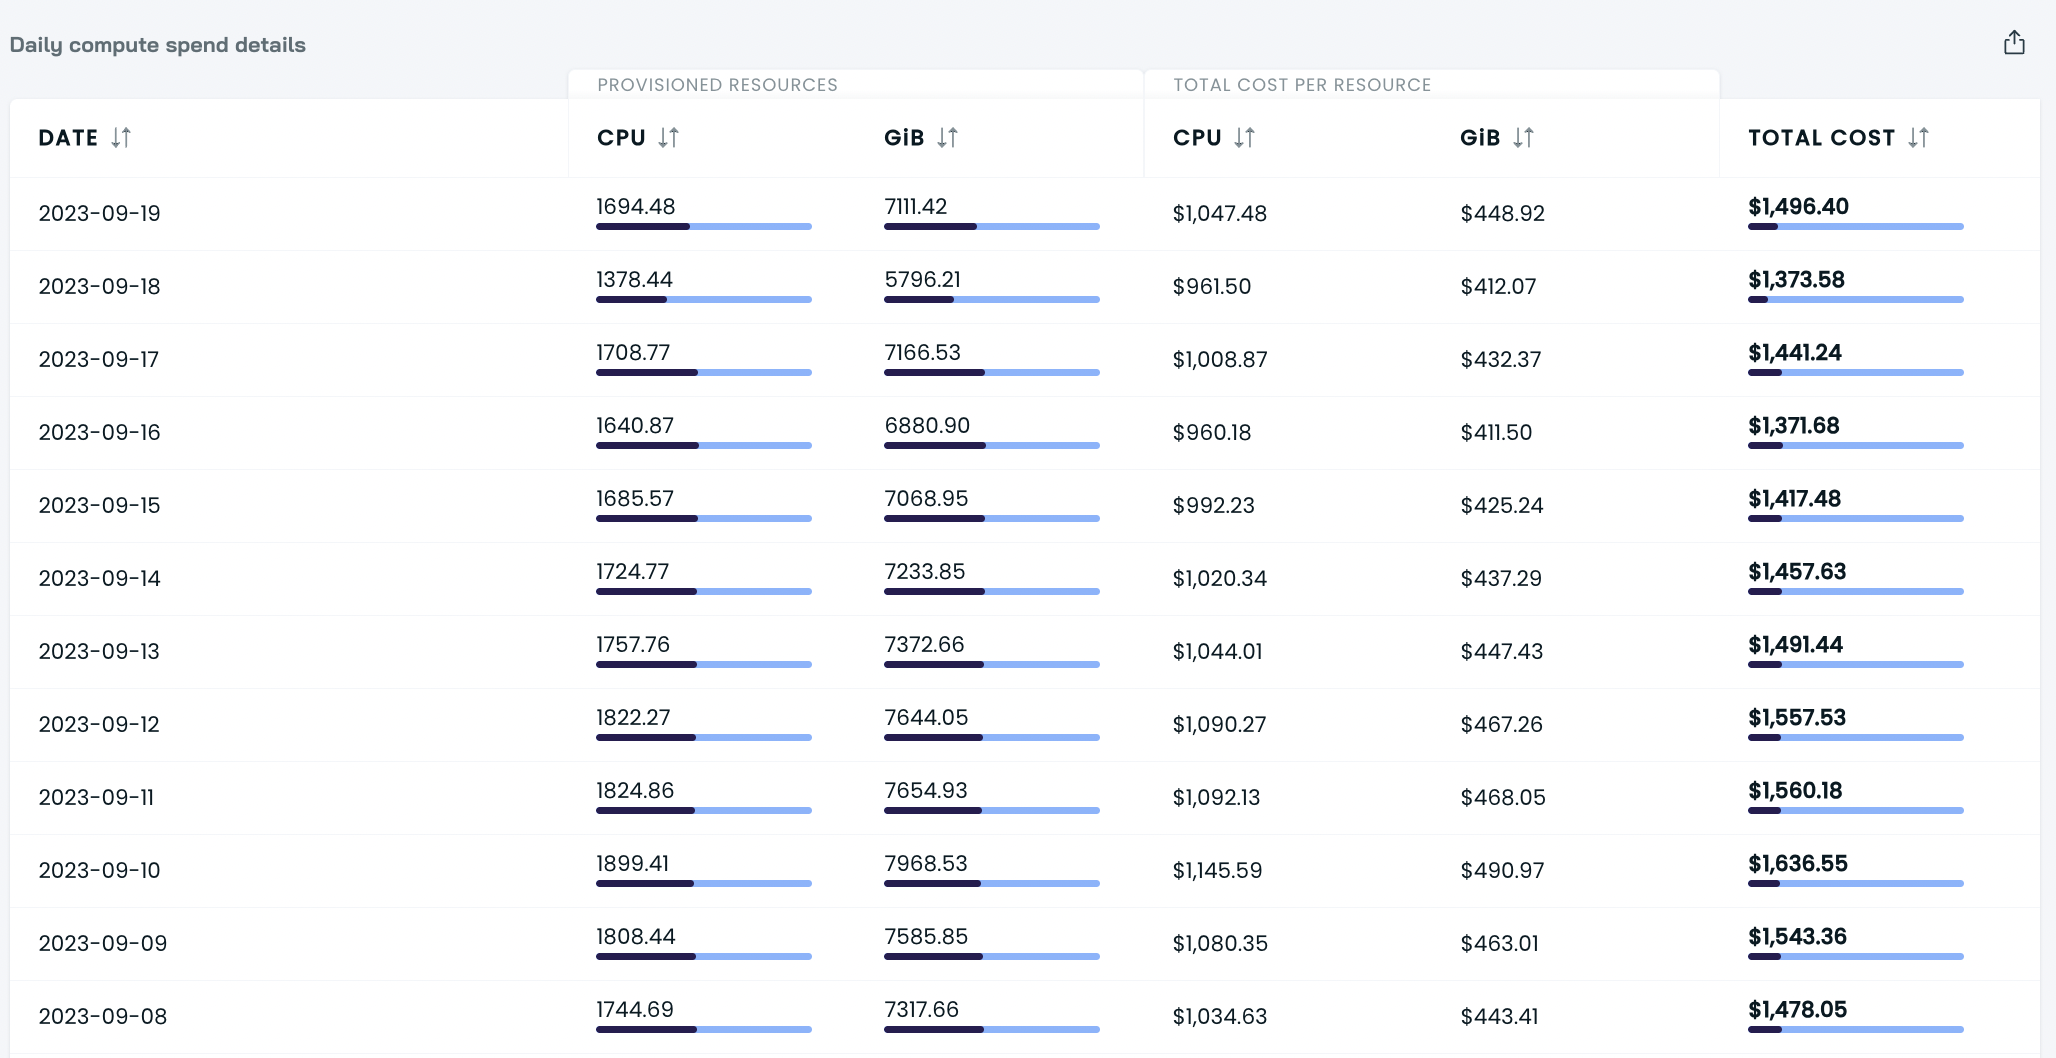
By pressing the arrows next to the CPU and GiB, you can identify the day with the highest/lowest cost per resource or provisioned resource in this cluster. The arrows by the total cost column let you sort days by your cluster cost: from the lowest to the highest or the other way round.
How to understand metrics in the cluster report
Some of the metrics you see differ depending on whether you select the current or past period. Here's how to understand what you see in your report.
The current period:
- Current month spend is the sum of costs generated on all previous days and the sum of projected today's spend.
- Monthly forecast considers all complete days and forecasts of spending until the end of the month using a 7-day moving average. That means that tomorrow's average spend stems from dividing the spend of today and the previous six days by 7. The day after tomorrow is calculated similarly, including tomorrow's projection.
- Avg. daily cost is the total cluster compute cost in the selected period divided by the number of days.
The past period:
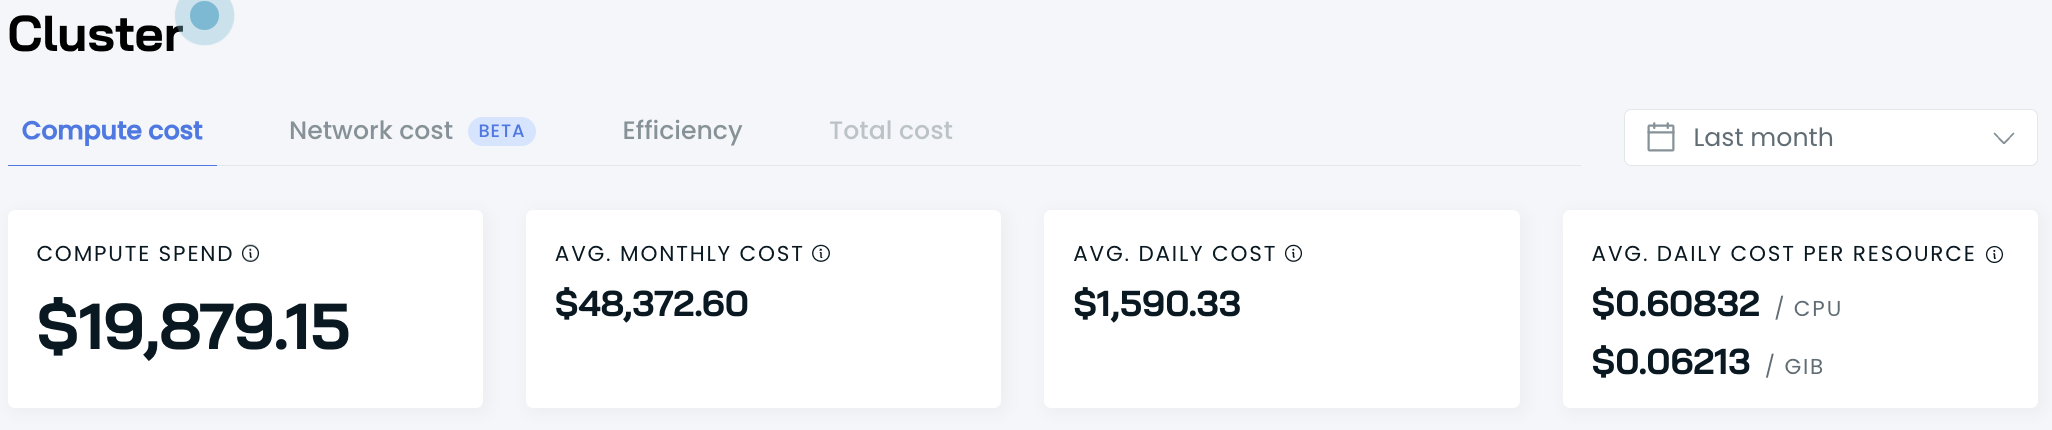
- Compute spend is the actual cluster compute spend in the selected period.
- Avg. monthly cost is calculated as the daily average multiplied by 30 days.
- Total compute spend is the cluster cost in the selected period broken down by on-demand, fallback, and spot.
Other metrics
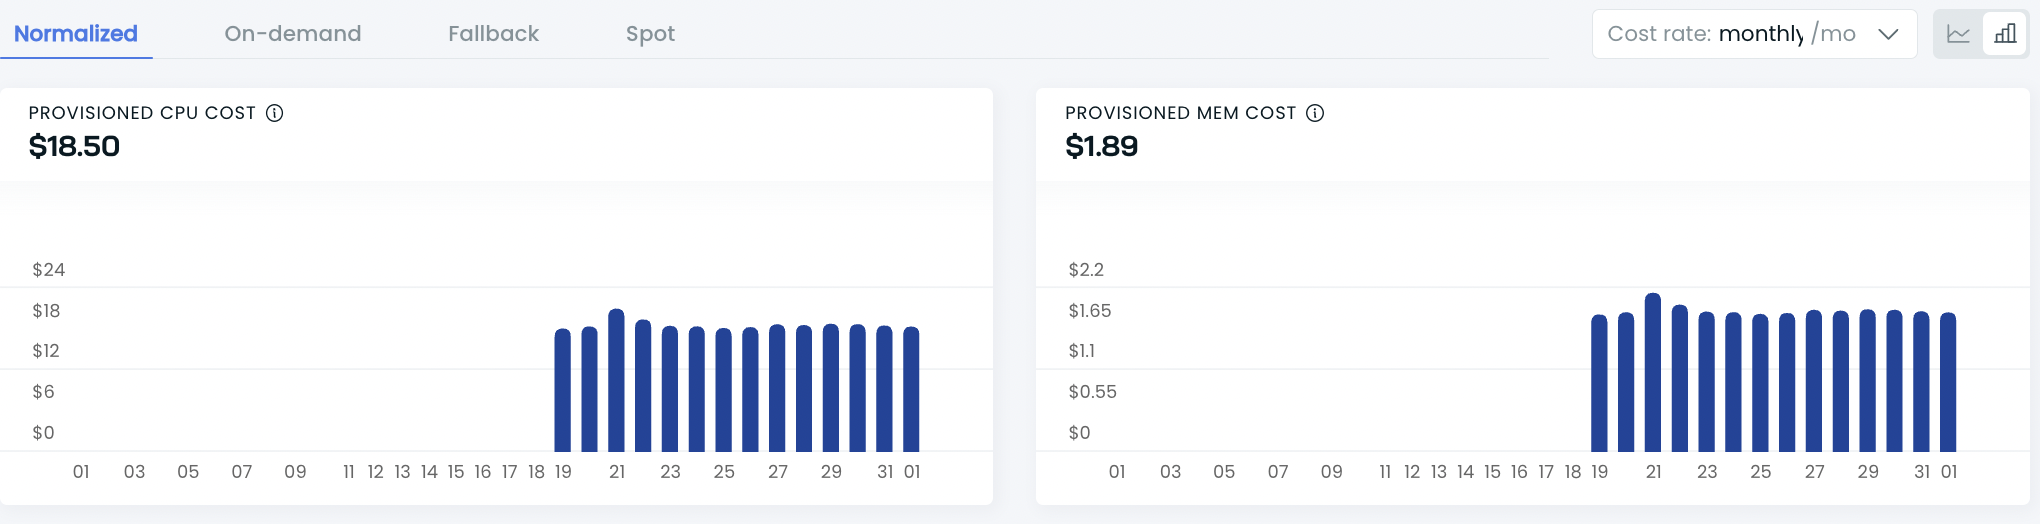
- Provisioned CPU cost is the total compute spend divided by the average number of provisioned CPUs in the selected period.
- Normalized cost per CPU is calculated in the following way:
- Hourly is the average hourly CPU cost divided by the average hourly provisioned CPUs.
- Daily is the average hourly CPU cost divided by the average hourly provisioned CPUs and multiplied by 24.
- Monthly is the average hourly CPU cost divided by the average hourly provisioned CPUs and multiplied by 730.
- Daily compute spend details are calculated similarly:
- On-demand is the total day's on-demand CPU cost divided by the day's provisioned on-demand CPUs.
- Spot is the total day's spot CPU cost divided by that day's provisioned spot CPUs.
- Fallback is the total day's fallback CPU cost divided by that day's provisioned fallback CPUs.
Updated 2 months ago
What’s Next
Explore other reports to get even deeper and more granular insights.