
Reports and UI/UX
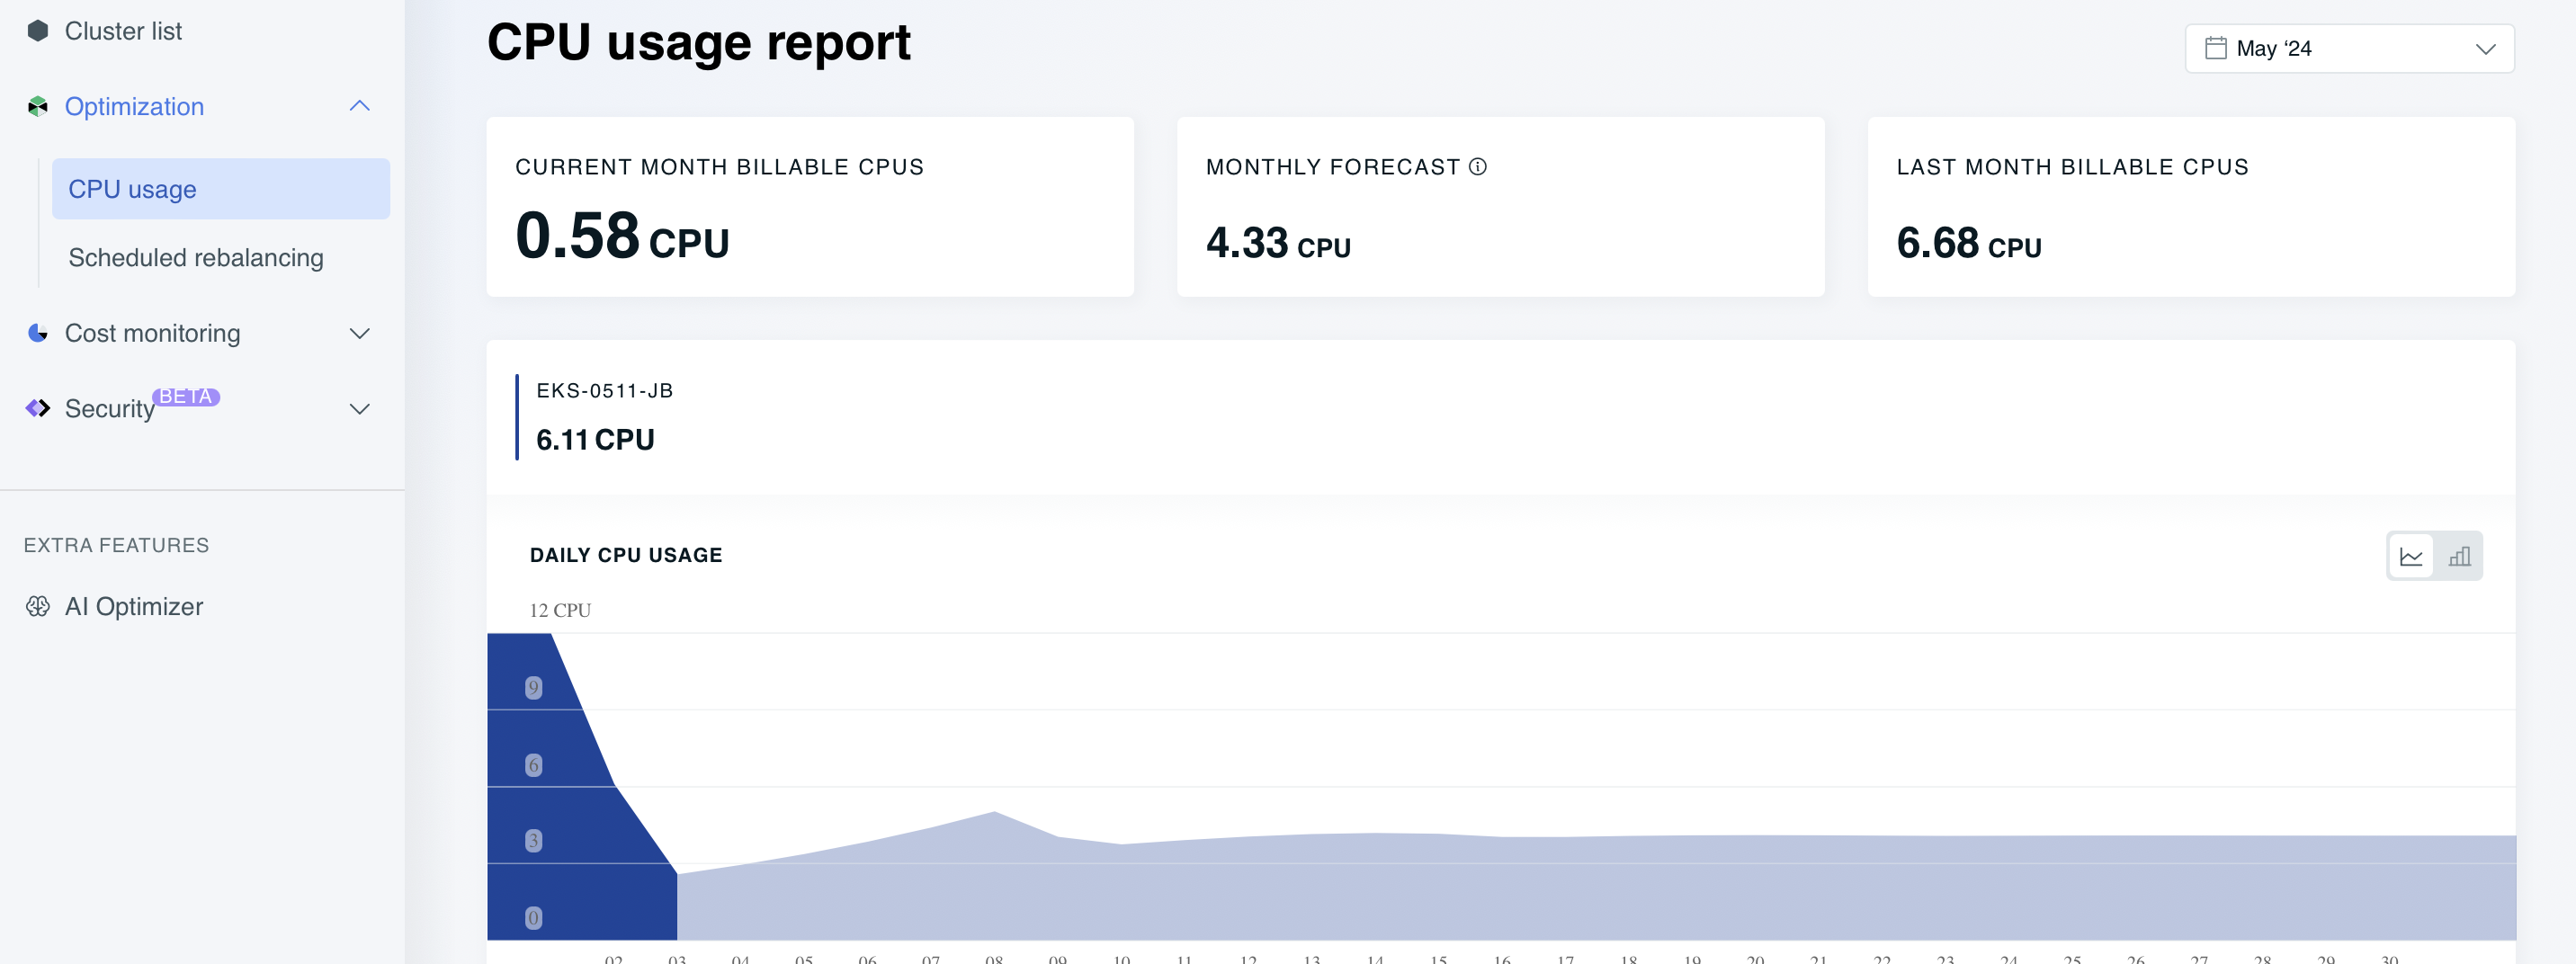
Where can I check the CPU usage report in the new console for a client per month?
Click on the optimization tab at the organization level in the upper left corner. You'll find it under the CPU usage:
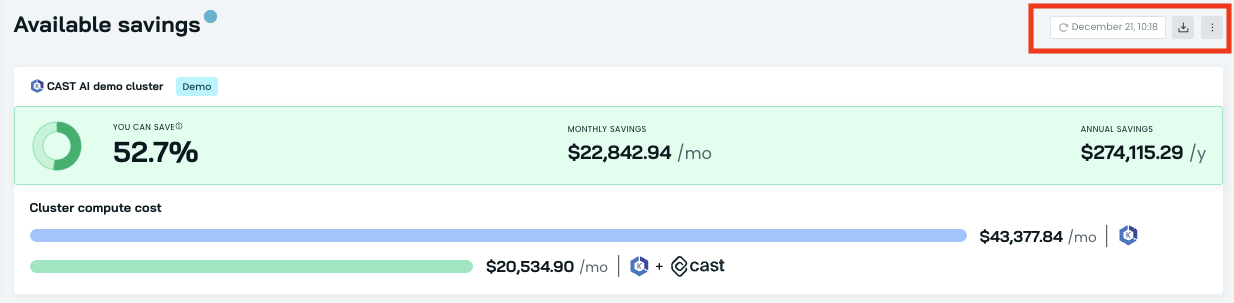
How can I download the Available Savings report?
You need to enable automated management of your cluster by CAST AI and be an Owner to perform such an action.
How does CAST AI calculate the current costs per workload?
Costs per workload are calculated using the cost of the node each workload is running on then looking at the percentage of CPU and Memory being consumed by that workload on that node.
Example: Workload 1 has 3 pods, requests of 1 CPU and 1 GB of memory, and is running on 3 different nodes due to an anti-affinity rule:
- Node 1: $.038/CPU/hr and $.0038/GB/hr
- Node2: $.054/CPU/hr and $.005/GB/hr
- Node3: $.048/CPU/hr and $.0038/GB/hr
The workload cost would be $.1526/hr. The total cumulative workload costs won't add up to the entire cluster cost because we don't attribute empty space to a workload; we attribute unused space to lost efficiency.
Can I drain the node using the CAST AI console UI?
Yes. Head over to the node list and click Delete node located on the right side. This will trigger the standard cordon/drain process and the deletion of the node once it's empty.
Can I download the security report?
Yes, you can download the security best practice report as a CSV file.
To download the report:
- Navigate to Security and choose Best practice.
- Click the download button above the report table to the right.
- The report will be downloaded to your local machine as a CSV file.
Can you share your data subprocessor list and security certifications?
Yes, you can find this information at the Trust Center.
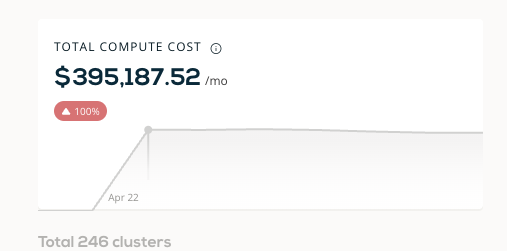
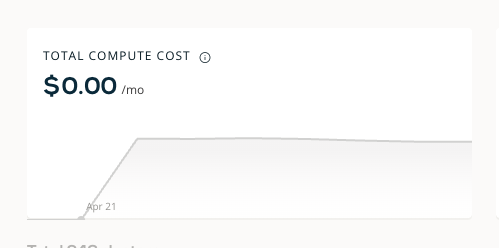
What is happening in below screenshots for the Total Compute Cost?
This is happening due to time zone roll-off: the new day isn't showing but the old day is rolled off.
When we add up all the workloads in the Workloads page, the number doesn't match the monthly cluster cost. Why is that?
The delta is the waste in the cluster since not all resources in the cluster are allocated to a service.
How is the workload rightsizing recommendation calculated?
For rightsizing recommendations, the Cost monitoring module analyzes the resource use of a container during the last 5 days and calculates the percentile value (95th percentile for CPU and 99th percentile for RAM).
Any ideas on reducing costs for other GCP services?
CAST AI focuses on Kubernetes. In addition to cost savings, it identifies and shares recommendations for rightsizing application workloads, as well as security and compliance reporting.
How does CAST AI display node resource group and main resource group in the UI?
When the CAST AI agent is installed, it tries to retrieve the metadata endpoint on the scheduled node. It sends the obtained nodeResourceGroup from there.
In the read-only mode, CAST AI doesn't have access to the customer's cloud account, so we rely on the information provided by the agent, specifically the node metadata accessible to the agent. Consequently, it displays the node_Resource_Group. We improve this data in the automated management phase by updating it to a main ResourceGroup.
Read-only: It displays Node Resource Group:

Automated management: It displays the main resource group: