
Audit log
Check out this page to learn how Cast AI's Audit log tracks and displays detailed records of all operations, policy actions, and changes made in your cluster.
The Audit log provides a detailed view of all actions and events that occur within your clusters managed by Cast AI. This feature helps you track changes, troubleshoot issues, and maintain security compliance by recording both user-initiated actions and automated policy-driven changes.
Audit logs are available at two scopes:
- Cluster audit log: records actions and events for a single cluster across domains such as the Node Autoscaler and Workload Autoscaler, for example nodes being added or removed, autoscaler policy actions, workload optimization recommendation changes, and hibernation events.
- Organization audit log (early access): a timeline of events across your whole organization, covering clusters, nodes, commitments, and configuration changes.
This page covers both.
Accessing the cluster audit log
To view the audit log for a specific cluster:
- In the Cast AI console, open Automation
- Select your cluster
- In the left menu under Cluster, select Logs
Accessing the organization's Activity log
Early Access featureThe organization Activity log is in early access. It may undergo changes based on user feedback and continued development. We welcome your feedback to help us improve.
To view events across all clusters in your organization:
- Open the product menu at the top left of the Cast AI console
- Select Activity log
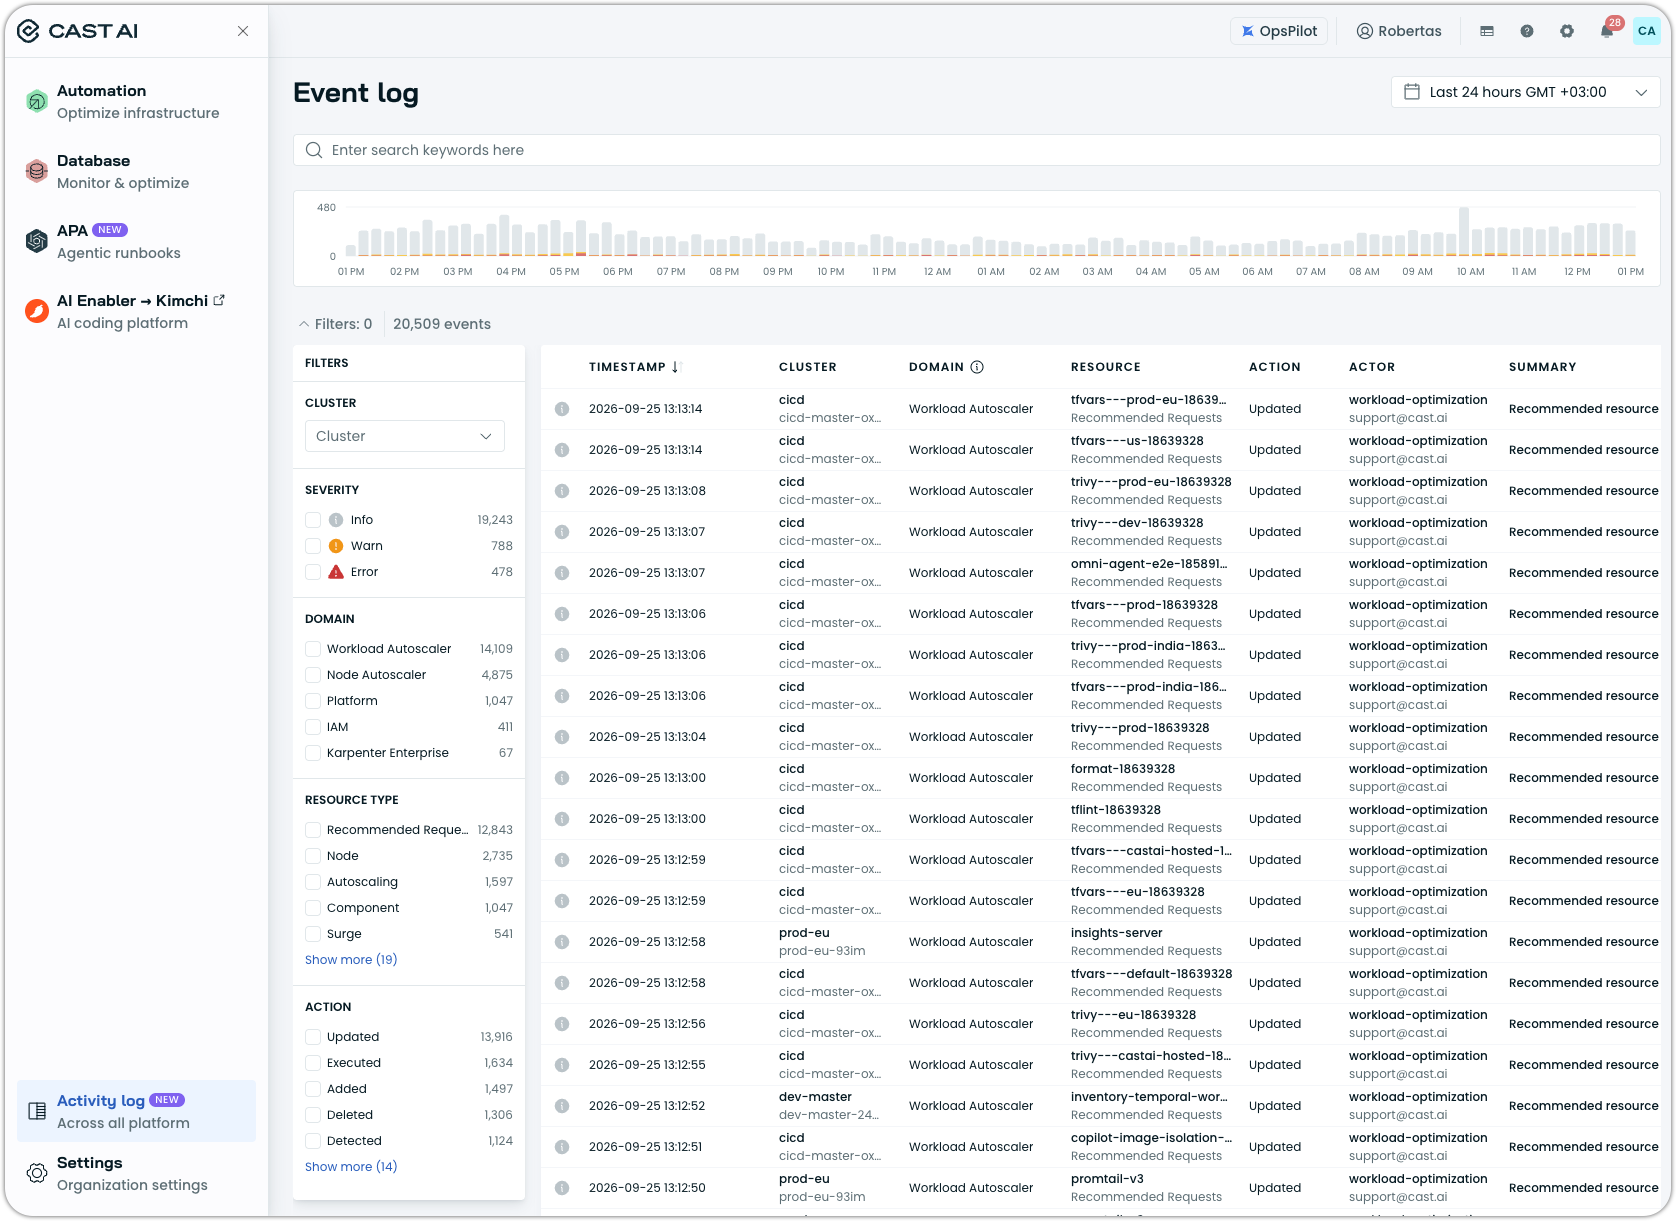
While in early access, the page itself is labeled Event log. The Activity log lists events from every cluster and product area in a single timeline. You can filter it by domain (for example, Autoscaler), resource type, action, and severity, which makes it the right place to answer organization-level questions, such as when a cluster was connected or when automation was enabled.
The same 90-day retention policy applies to both cluster and organization audit logs.
Don't see the Activity log?The Activity log entry appears only for users whose role includes permission to view the organization activity log. If you can't see it, ask your organization administrator to check your role under Settings > Role-based access control (see Role-based access control).
Also note that the organization Activity log is different from the workload-level event log under Workload autoscaler > Event log, which tracks workload autoscaling recommendations for a single cluster.
Understanding the cluster audit log interface
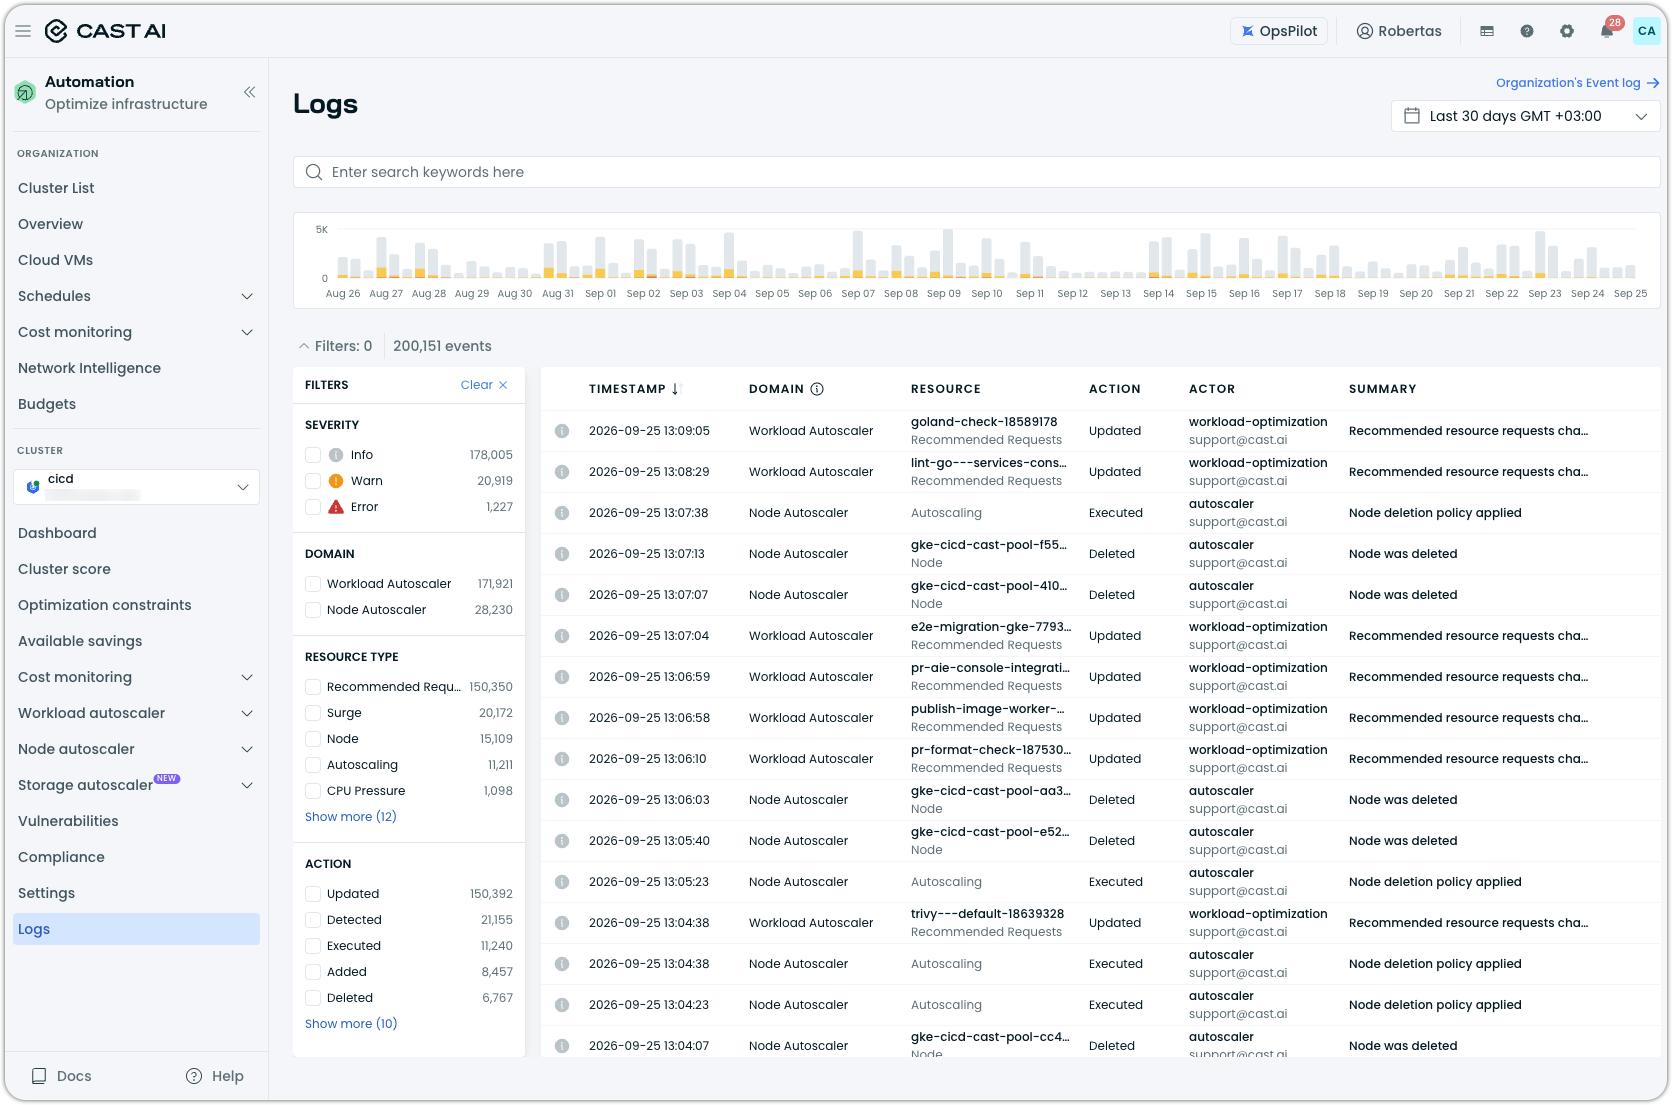
The cluster audit log displays information in a table format with the following columns:
- Timestamp: When the action occurred
- Domain: The product area the event belongs to (for example, Workload Autoscaler or Node Autoscaler)
- Resource: The resource the event relates to and its type (for example, a workload under Recommended Requests, or a node)
- Action: What happened to the resource (for example, Updated, Executed, or Deleted)
- Actor: The user, service account, or policy that triggered the action
- Summary: A short description of the change
Each log entry can be expanded to view additional details about the event in a dedicated drawer:
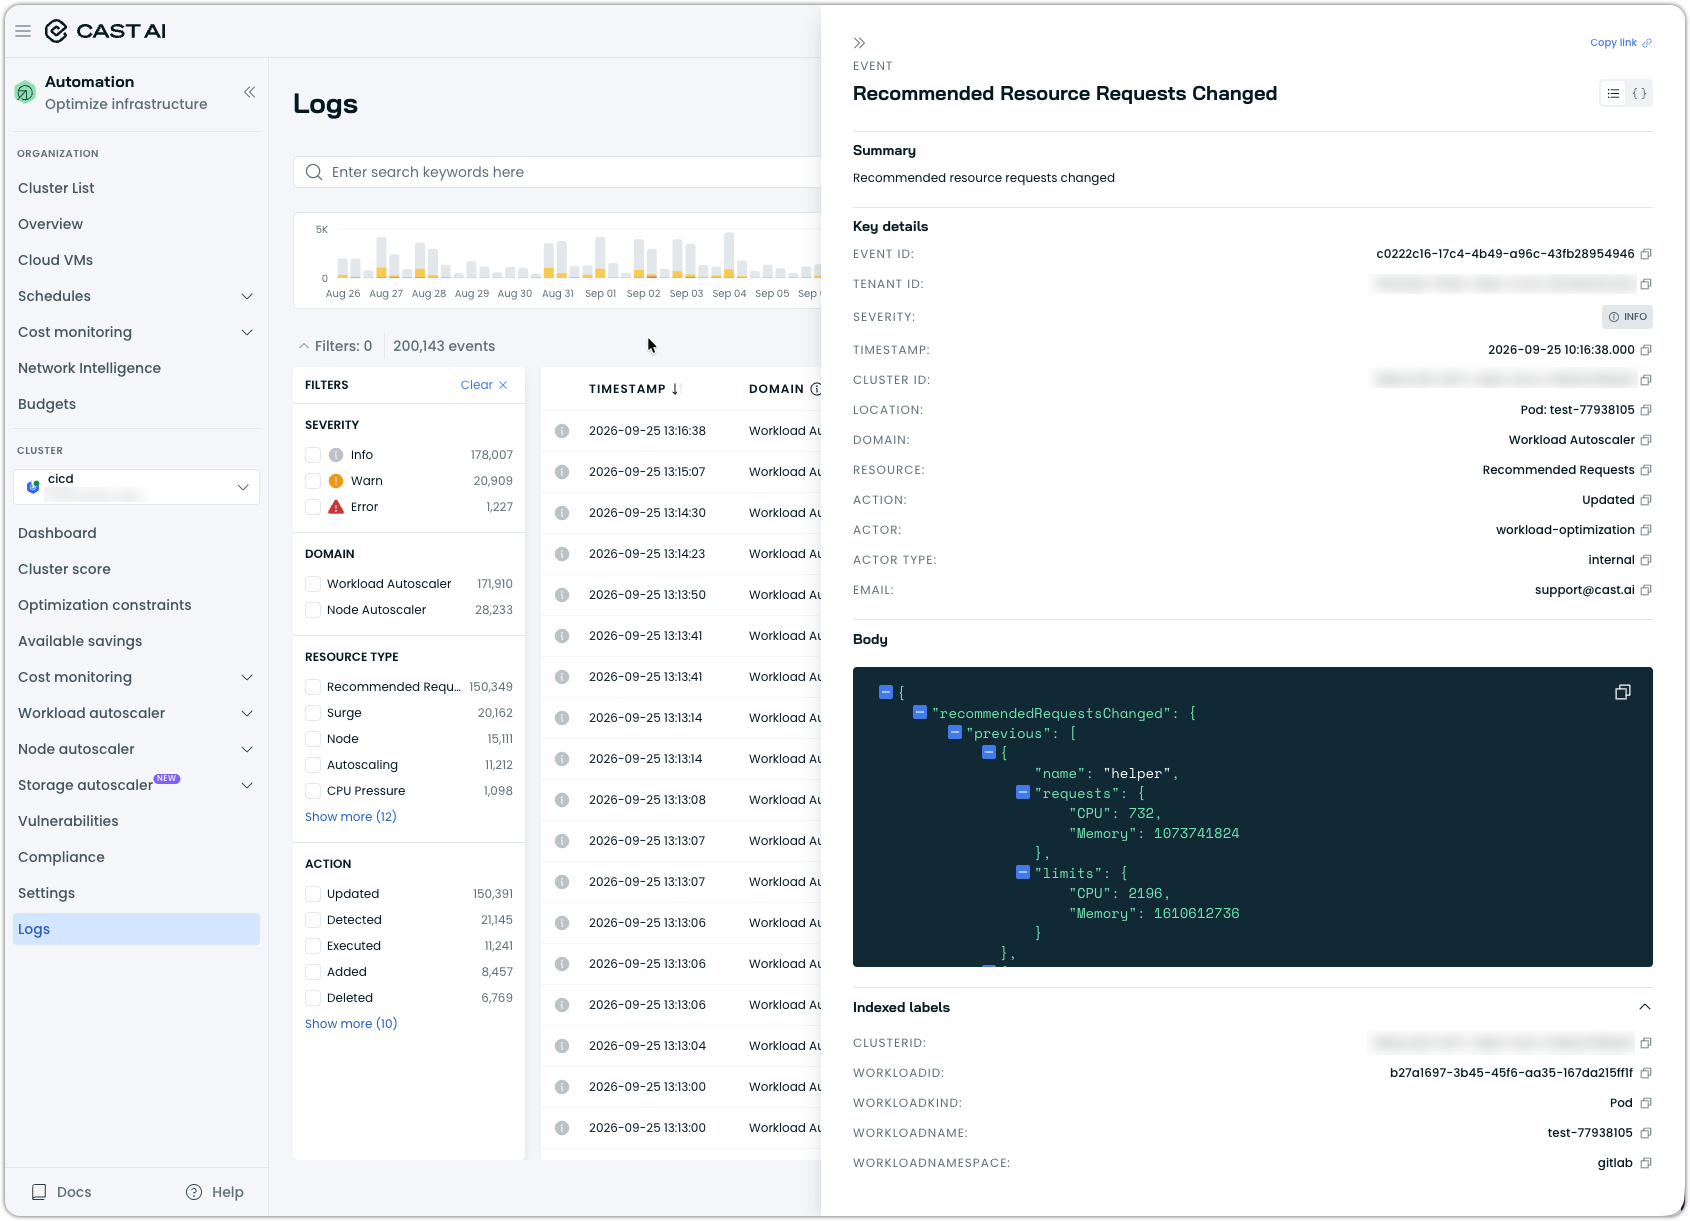
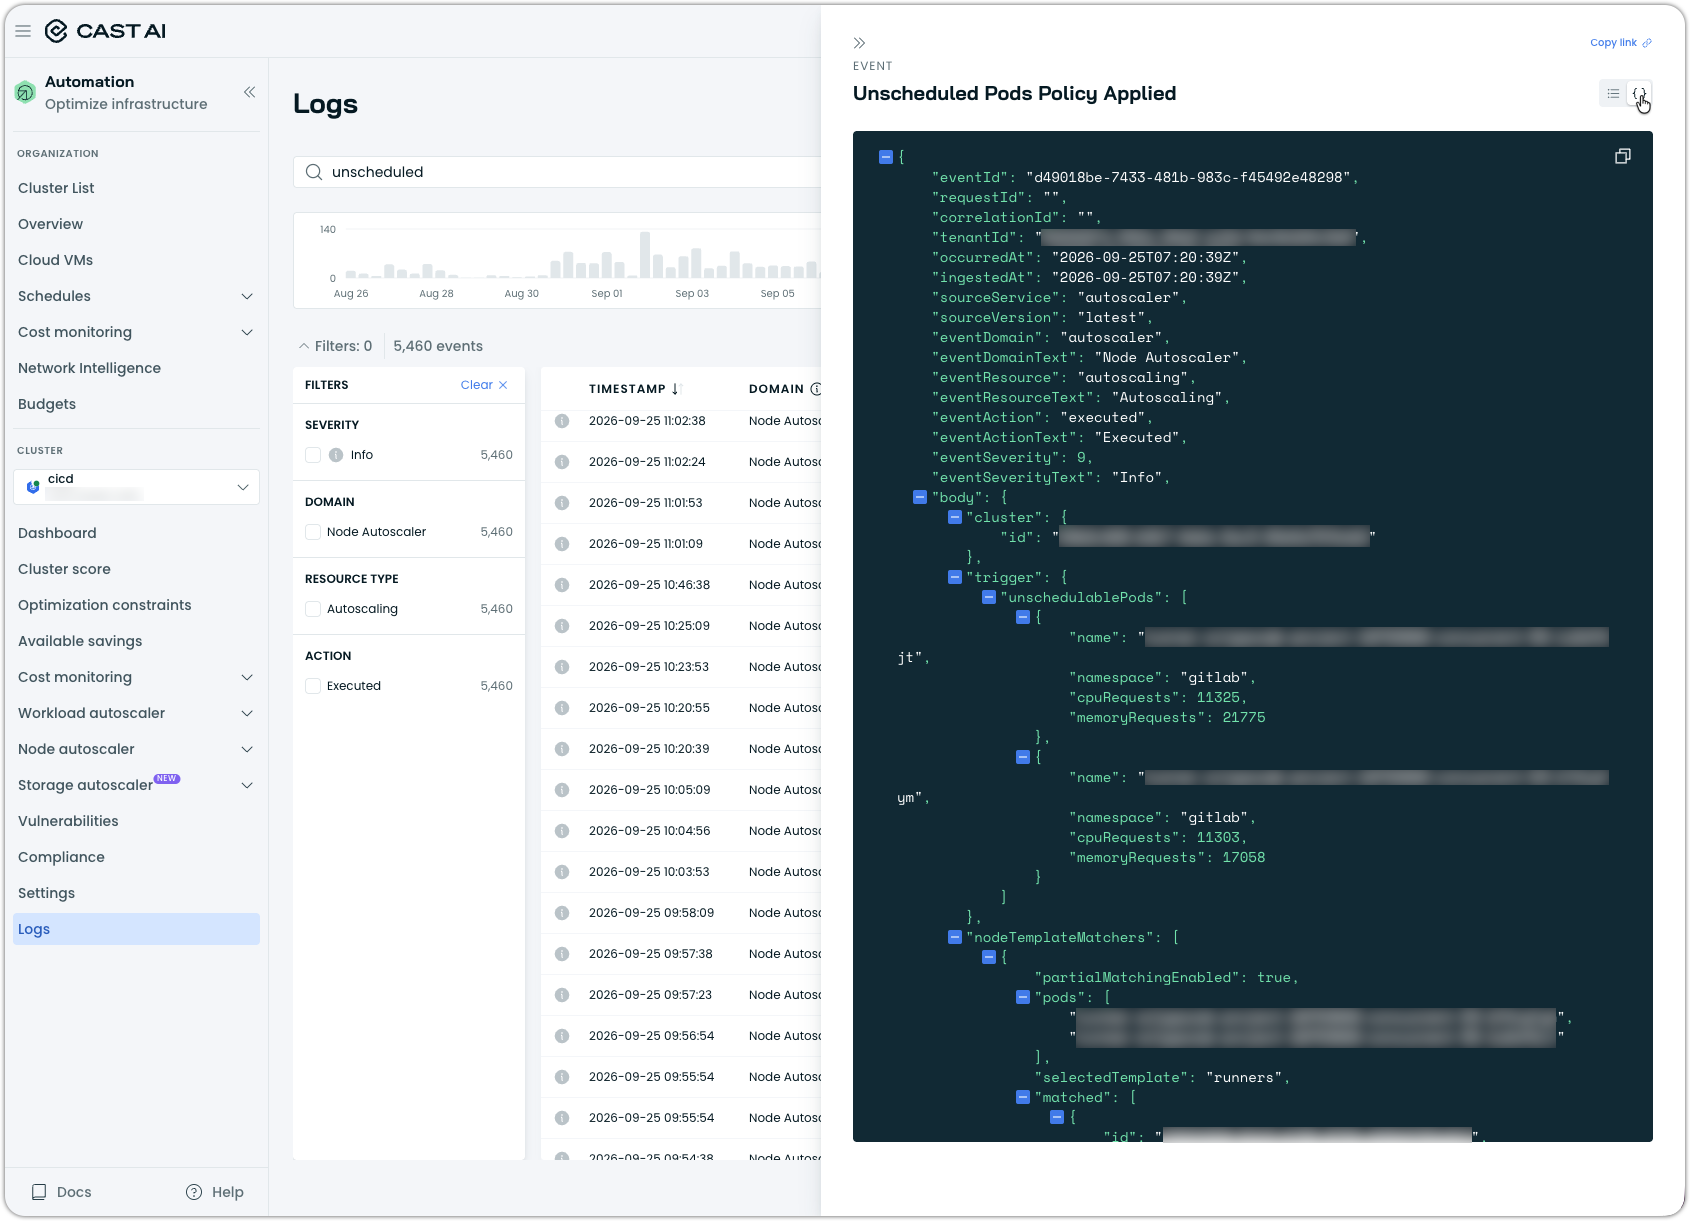
The entry summary can then be viewed as is in this table format, or you can switch to the YAML/JSON view by clicking the {} icon in the top right of the opened drawer:
Filtering capabilities
The cluster audit log provides filtering options to help you find specific events. You can combine a keyword search and a time range with the filter groups in the left panel, and select several values across groups to narrow down results.
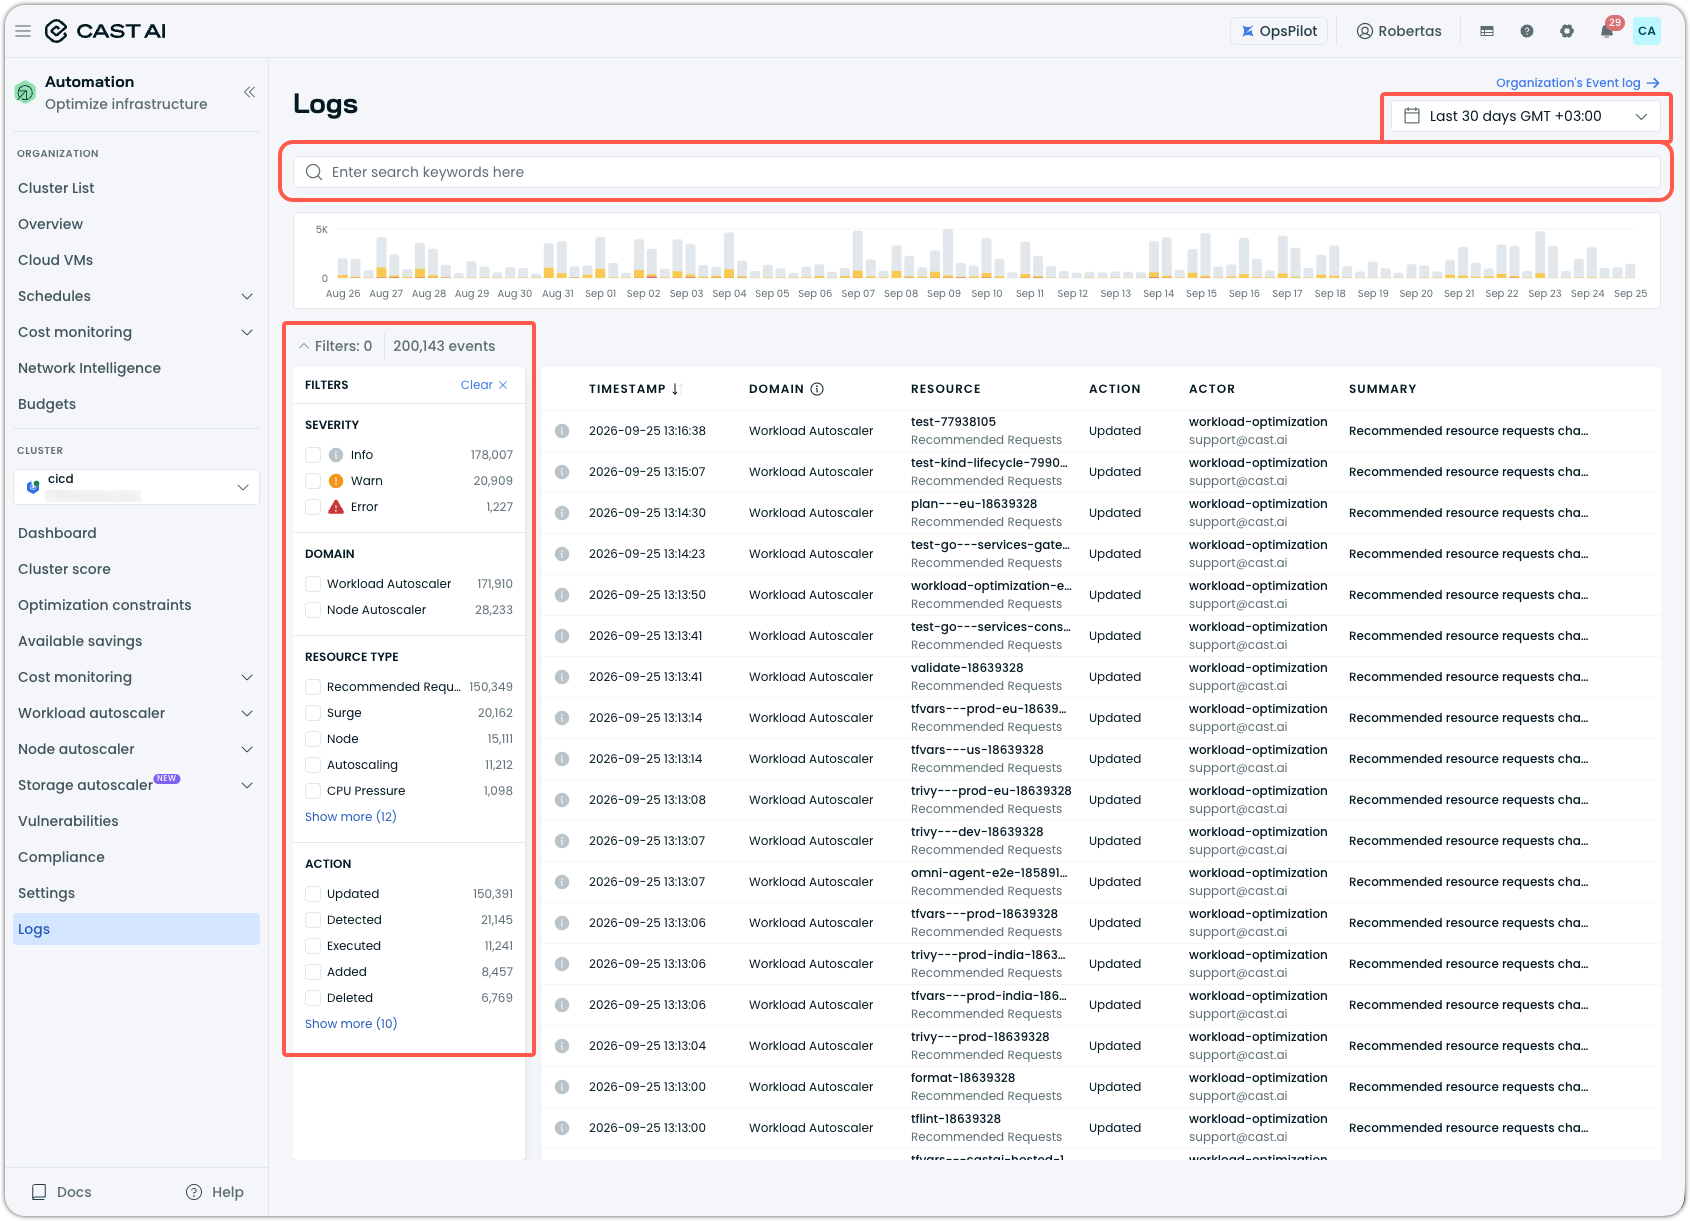
Search and time range
- Text search: Enter keywords in the search bar above the log entries to search event text
- Time range: Use the time-range selector in the top right to choose a preset (for example, Last 30 days) or specify a custom period
Filter groups
The filters panel on the left groups available filters, each showing how many matching events a value has:
- Severity: Filter by event severity, such as Info, Warn, or Error
- Domain: Filter by the product area the event belongs to, such as Workload Autoscaler or Node Autoscaler
- Resource type: Filter by the kind of resource involved, such as Recommended Requests, Surge, Node, Autoscaling, or CPU Pressure. Select Show more to see the full list.
- Action: Filter by what happened to the resource, such as Updated, Detected, Executed, Added, or Deleted
Select Show less to collapse an expanded group, or Clear at the top of the filters panel to reset all selected filters.
Types of tracked events
The cluster audit log tracks various events related to cluster operations, node management, and policy changes. Here's a complete list of events tracked by the system:
| Event Category | Event Type | Description |
|---|---|---|
| Policy Management | Policy enabled | A policy has been activated in the cluster |
| Policy configuration | Changes made to policy settings or parameters | |
| Unschedulable pods policy | Events related to handling pending pods that need scheduling. Click the instance type in the event row to view detailed information about the unscheduled pods that triggered the event. | |
| Node Operations | Node added | A new node has been added to the cluster |
| Node removed | A node has been removed from the cluster | |
| Node deletion requested | A request has been made to delete a node | |
| Add node failed | An attempt to add a node to the cluster has failed | |
| Adding node failed | An alternative event name for failed node addition attempts | |
| Nodes interrupted | Nodes have been interrupted (typically for Spot Instances) | |
| Dead node deleted | Actions taken on nodes determined to be non-responsive | |
| Cluster Management | Cluster created | A new cluster has been initialized |
| Cluster paused | Cluster operations have been temporarily suspended | |
| Cluster deleted | A cluster has been permanently removed | |
| Cluster hibernated | The cluster has been hibernated to reduce costs during inactive periods | |
| Cluster hibernation triggered | A hibernation process has been initiated for the cluster | |
| Cluster hibernation schedule failed | A scheduled hibernation operation has failed to execute | |
| Cluster hibernation job finished | The hibernation process has completed successfully | |
| Cluster hibernation job pending | A hibernation job has been queued and is waiting to be processed | |
| Cluster hibernation job failed | A hibernation job has encountered an error and failed to complete (when expanded, shows the specific operation like "Resumption") | |
| Critical components validated | On hibernation, validate that the known critical components required for the resume node to join the cluster tolerate the CriticalAddonsOnly taint.The validation results are recorded in the audit log; components missing the toleration are flagged. | |
| Cluster reconcile triggered | The cluster reconciliation process has been initiated | |
| Autoscaler executed | The cluster autoscaling mechanism has performed an action, the details of which are provided in the log | |
| Rebalance plan change | Modifications to the cluster's rebalancing strategy | |
| Instance Management | Addblacklist executed | Instance types have been added to the blacklist |
| Spot Instance Events | Spot fallback enabled | Spot Instance fallback mechanism has been activated |
| Spot fallback disabled | Spot Instance fallback mechanism has been deactivated | |
| Spot fallback updated | Updates made to spot fallback settings | |
| Spot node found | A suitable Spot Instance has been located | |
| Failed to add nodes | Unable to add Spot Instances | |
| Failed to drain nodes | Unable to safely remove workloads from spot nodes | |
| Pod Management | Unscheduled pods policy | Events related to handling pending pods that need scheduling |
These events provide a comprehensive audit trail of all significant actions and changes within your cluster, enabling effective monitoring and troubleshooting of your Kubernetes environment.
Audit log retention and exporting
Audit logs are retained and accessible in the console for 90 days, after which they are archived (see Audit Log Retention Policy for details). However, if you need to analyze your audit logs externally or maintain them indefinitely, you can use our open-source Audit log exporter. This tool allows you to:
- Export audit logs to your preferred storage solution
- Perform custom analysis of historical data
- Maintain audit logs beyond the retention period
- Integrate audit data with your existing monitoring tools
To learn more about exporting your audit logs, visit our Audit log exporter documentation.
Updated 23 hours ago