
Performance estimation & cost savings
Quickly estimate cost savings and performance benefits.
As part of the DB Optimizer offering, the Cast AI platform can estimate infrastructure cost reductions and performance gains without installing the cache components. This is done by analyzing current database workloads and instance metrics. This estimation phase can be set up in a few minutes and is fully automated.
How it works
The (optional) estimation phase involves connecting Cast AI's control plane to a database infrastructure provider with read-only permissions to access database metrics.
Read more about security and access permissions here.
Once connected, the Cast AI control plane will periodically read usage metrics from the database infrastructure provider. These metrics are used in conjunction with a machine learning-based model to estimate cost savings and performance gains.
The estimation service is available for the database infrastructure providers below.
AWS RDS
Estimation reports can be generated automatically for customers using Amazon's RDS service with Performance Insights.
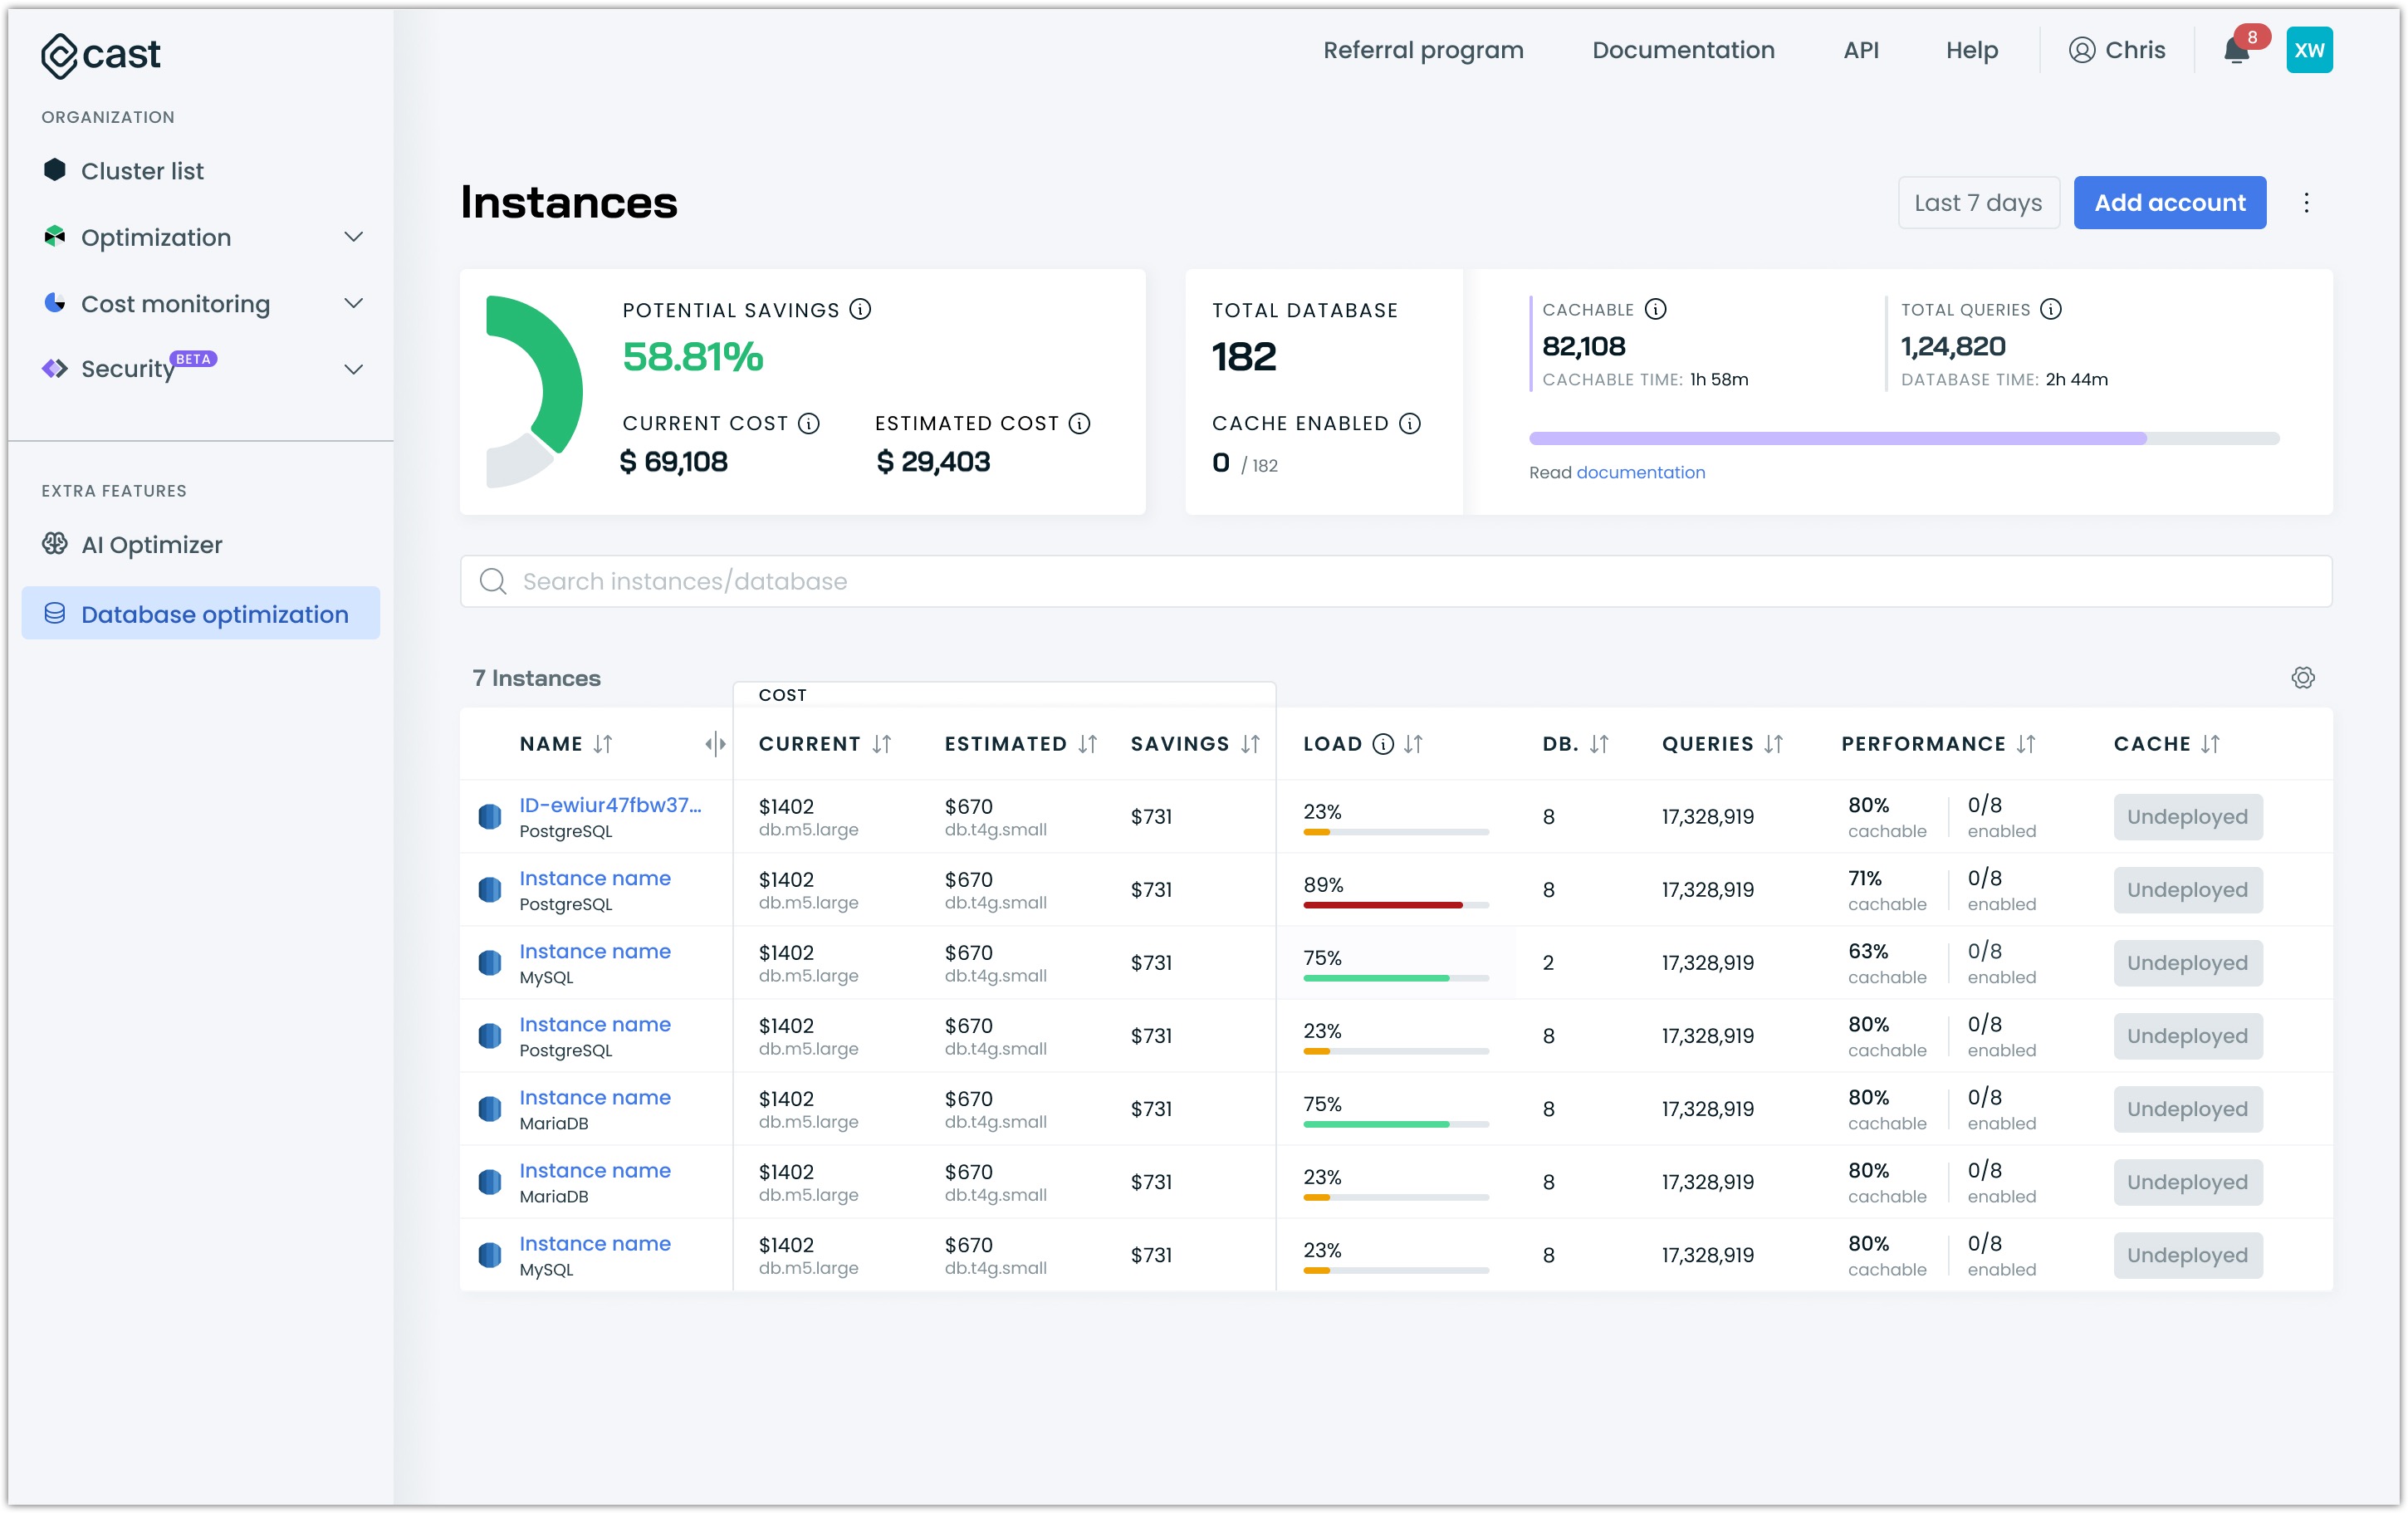
Database optimization dashboard
The Database optimization dashboard provides a comprehensive view of your database instances and their optimization potential. Let's break down the key components.
Key components
Potential savings
At the top left of the dashboard, you'll see a large circular graph displaying the overall potential savings percentage. This example shows 58.81% potential savings across all your database instances, giving you an immediate sense of the optimization opportunities available.
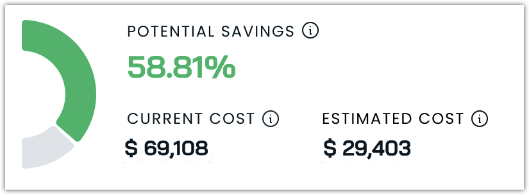
Summary metrics
Adjacent to the savings graph, you'll find important summary statistics:
- Total databases: The total number of monitored database instances.
- Current cost: Your current monthly spend on these databases.
- Estimated cost: The projected cost after applying optimizations.
Cache performance
The top right section provides insights into your cache performance:
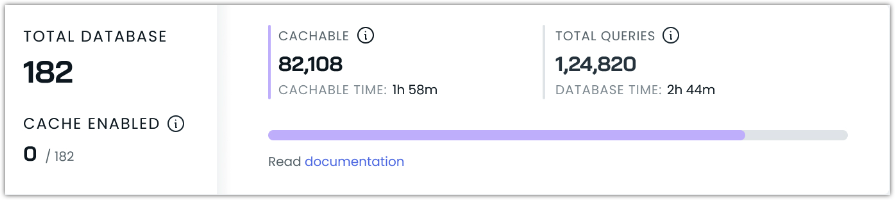
- Cache enabled: The number of databases with caching enabled out of the total.
- Cache hits: The number of successful cache retrievals.
- Cacheable: The number of queries that could potentially be cached.
- Total queries: The overall number of database queries.
Instance list
The main table in the dashboard lists all your database instances with detailed information:
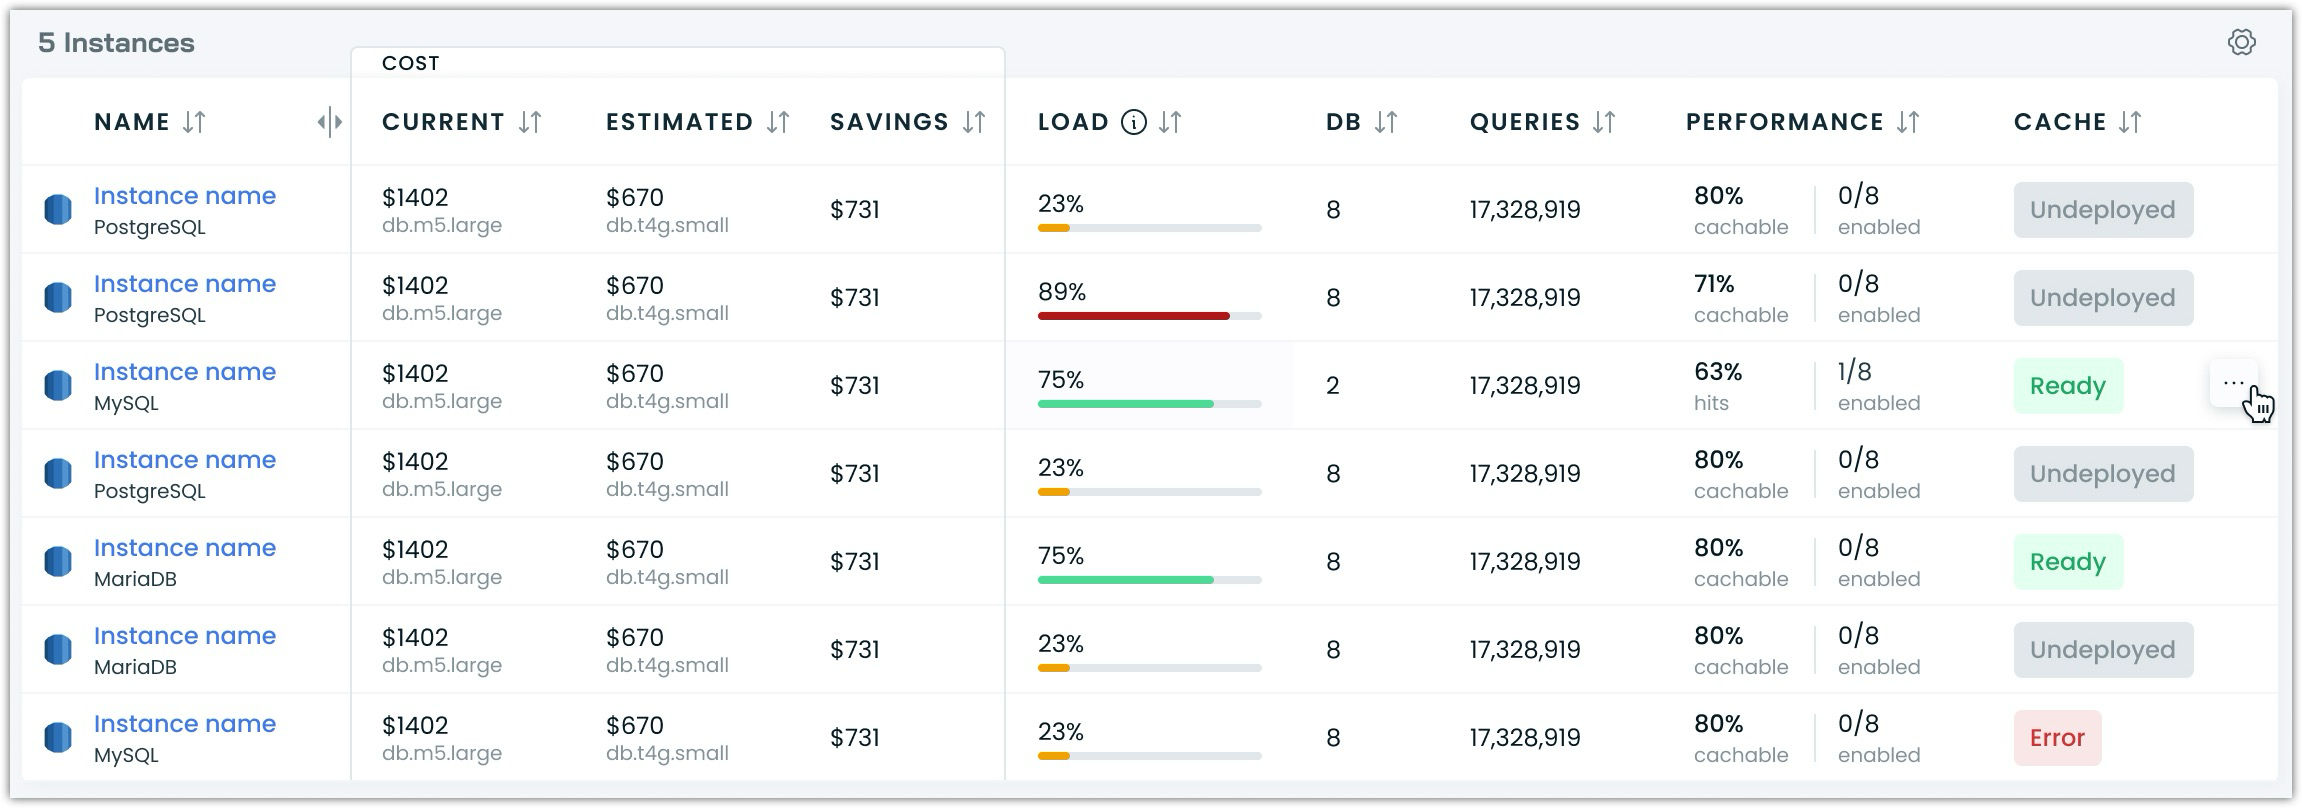
- Name: The instance name and associated account.
- Cost : Shows the current monthly cost and the projected cost after optimization. The difference represents potential savings.
- Load: An indicator of the database's resource utilization, helping identify over- or under-provisioned instances.
- DB: The number of logical databases hosted on this instance is useful for understanding resource allocation.
- Queries: Total query count, indicating the instance's activity level and potential for query optimization.
- Performance: Shows two metrics:
- Cacheable percentage: The percentage of queries that could potentially be cached (the types of queries that read data and do not modify it, like
SELECTstatements). - Enabled ratio: Shows how many logical databases have caching enabled out of the total logical databases on that instance.
- Cacheable percentage: The percentage of queries that could potentially be cached (the types of queries that read data and do not modify it, like
- Status: The current state of caching of the instance (e.g., Ready, Undeployed).
- Ready: The instance is ready to have caching enabled for its databases
- Undeployed: The cache components have not yet been deployed to that instance
Additional features
- Search bar: Easily filter and find specific instances or databases.
- Add account button: Quickly add new database accounts for optimization.
- Sorting: Sort the instance list by any column to focus on specific metrics.
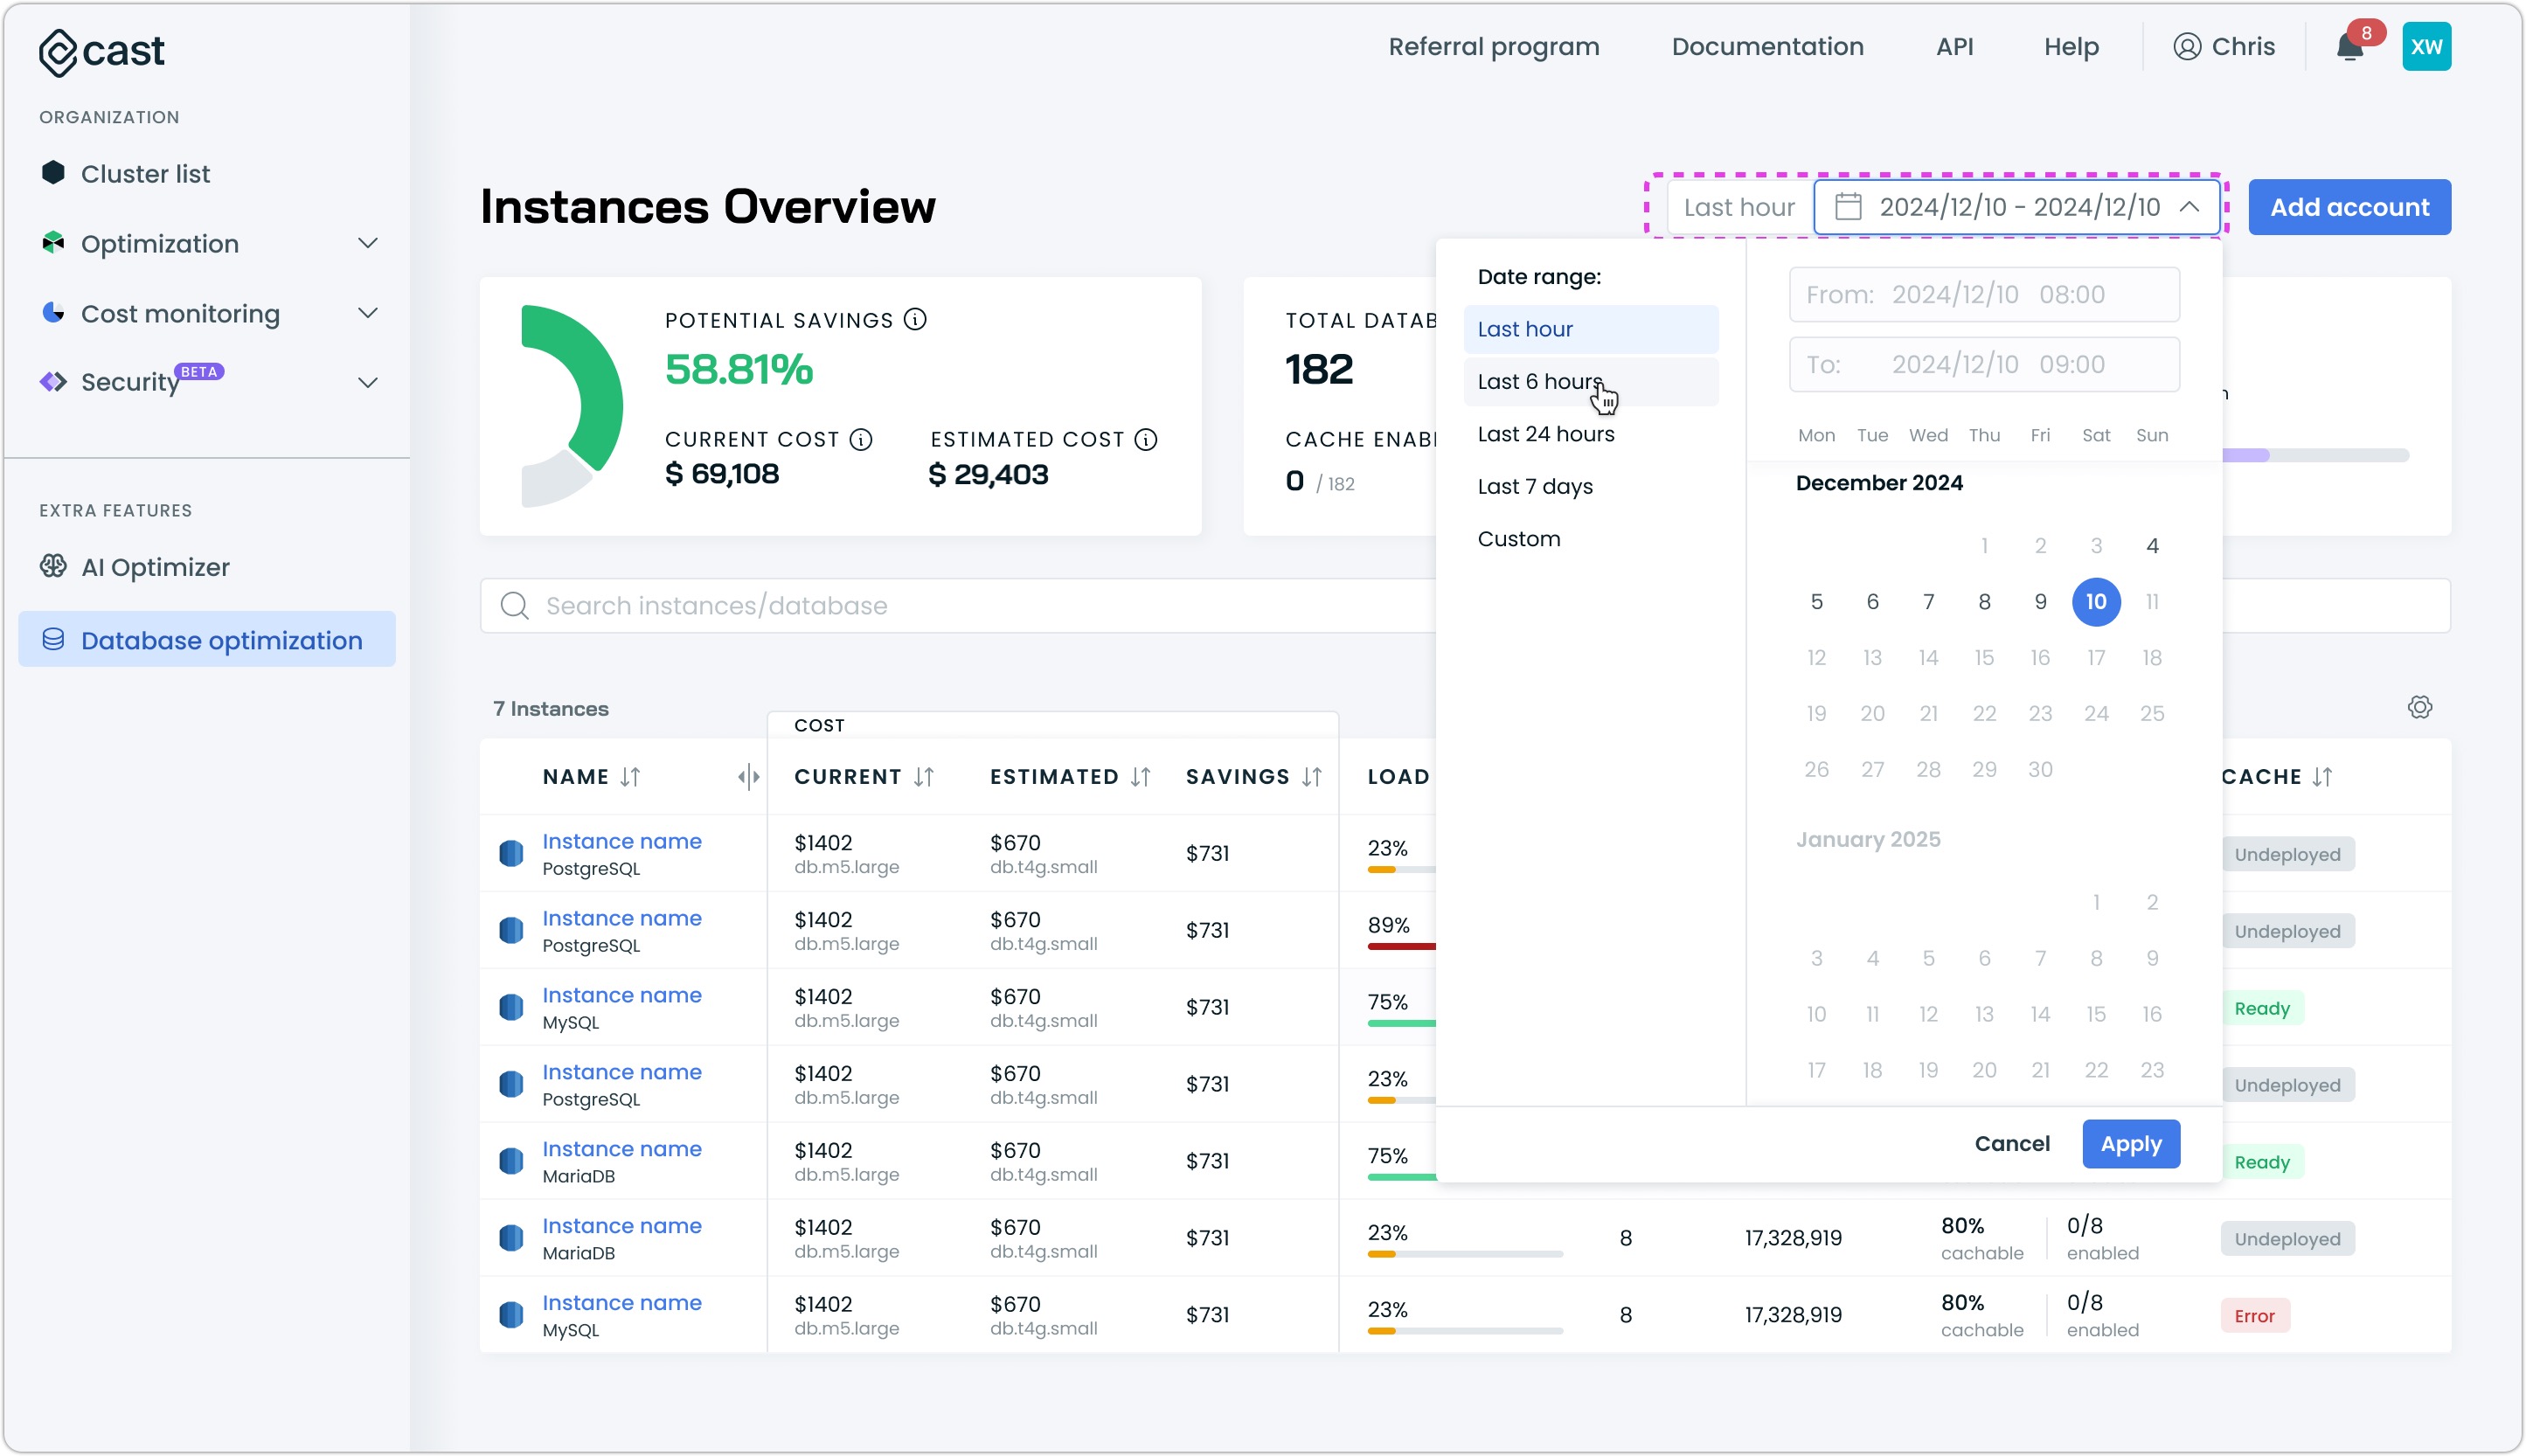
Using Granular Metrics for Cost Analysis
The time range selector allows you to analyze cost and performance metrics over different periods, revealing patterns that may influence your optimization decisions:
- Short-term analysis (1-6 hours): Identify immediate cost impact of specific workloads
- Daily analysis (24 hours): Spot daily patterns in resource usage and associated costs
- Weekly trends (7 days): Understand broader usage patterns to make strategic optimization decisions
When examining cost savings estimates, consider viewing the data across multiple time ranges to get a complete picture of how your database performs under various conditions.
Take action
To maximize the benefits of Cast AI's database optimization:
- Start with the dashboard's potential savings and summary metrics for a quick overview.
- Focus on instances showing high potential savings in the list.
By consistently leveraging these insights, you'll reduce costs and enhance your overall database performance and efficiency.