Namespaces
This report allows you to see your cluster costs broken down by namespaces. You can use this data to analyze compute expenses per namespace or a group of selected namespaces, identify inefficiencies, and discover potential savings opportunities.
At the moment, the Namespaces report provides one view:
- Daily namespace cost chart,
- List of namespaces with cost details per selected period.
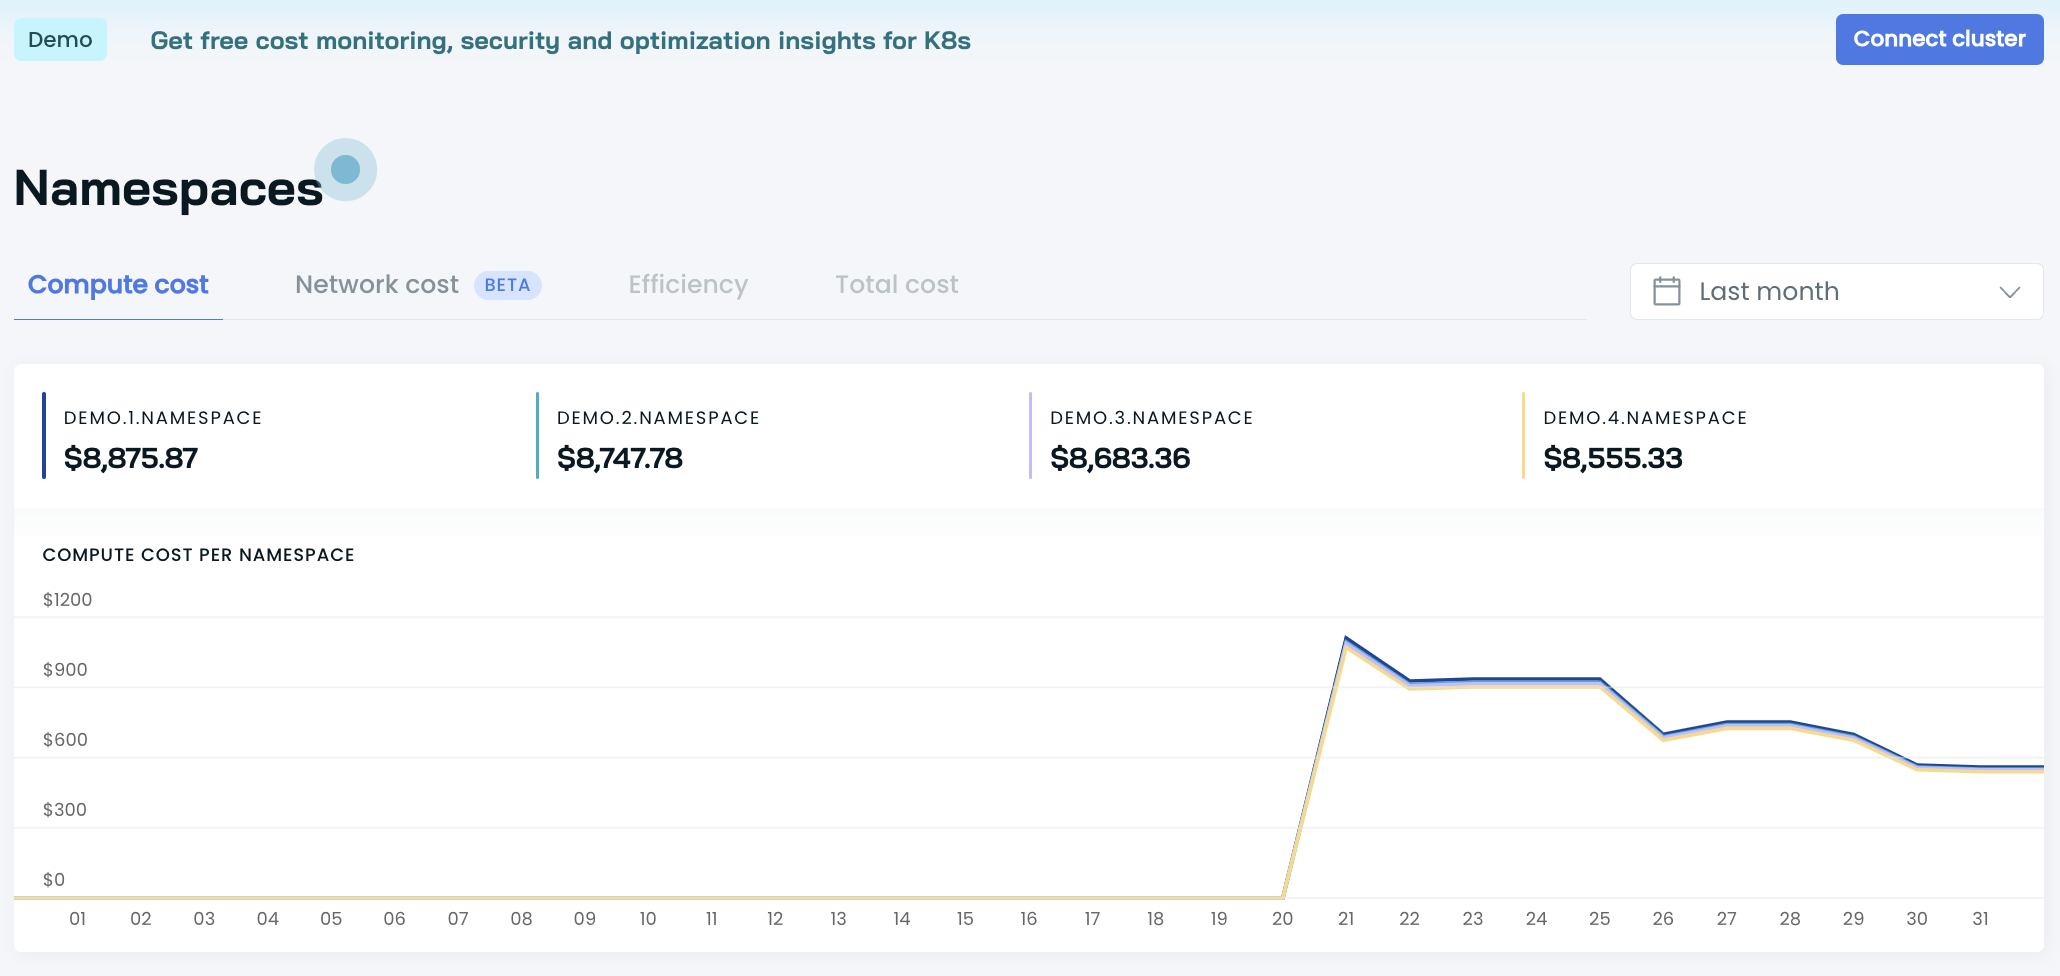
Daily namespace cost chart
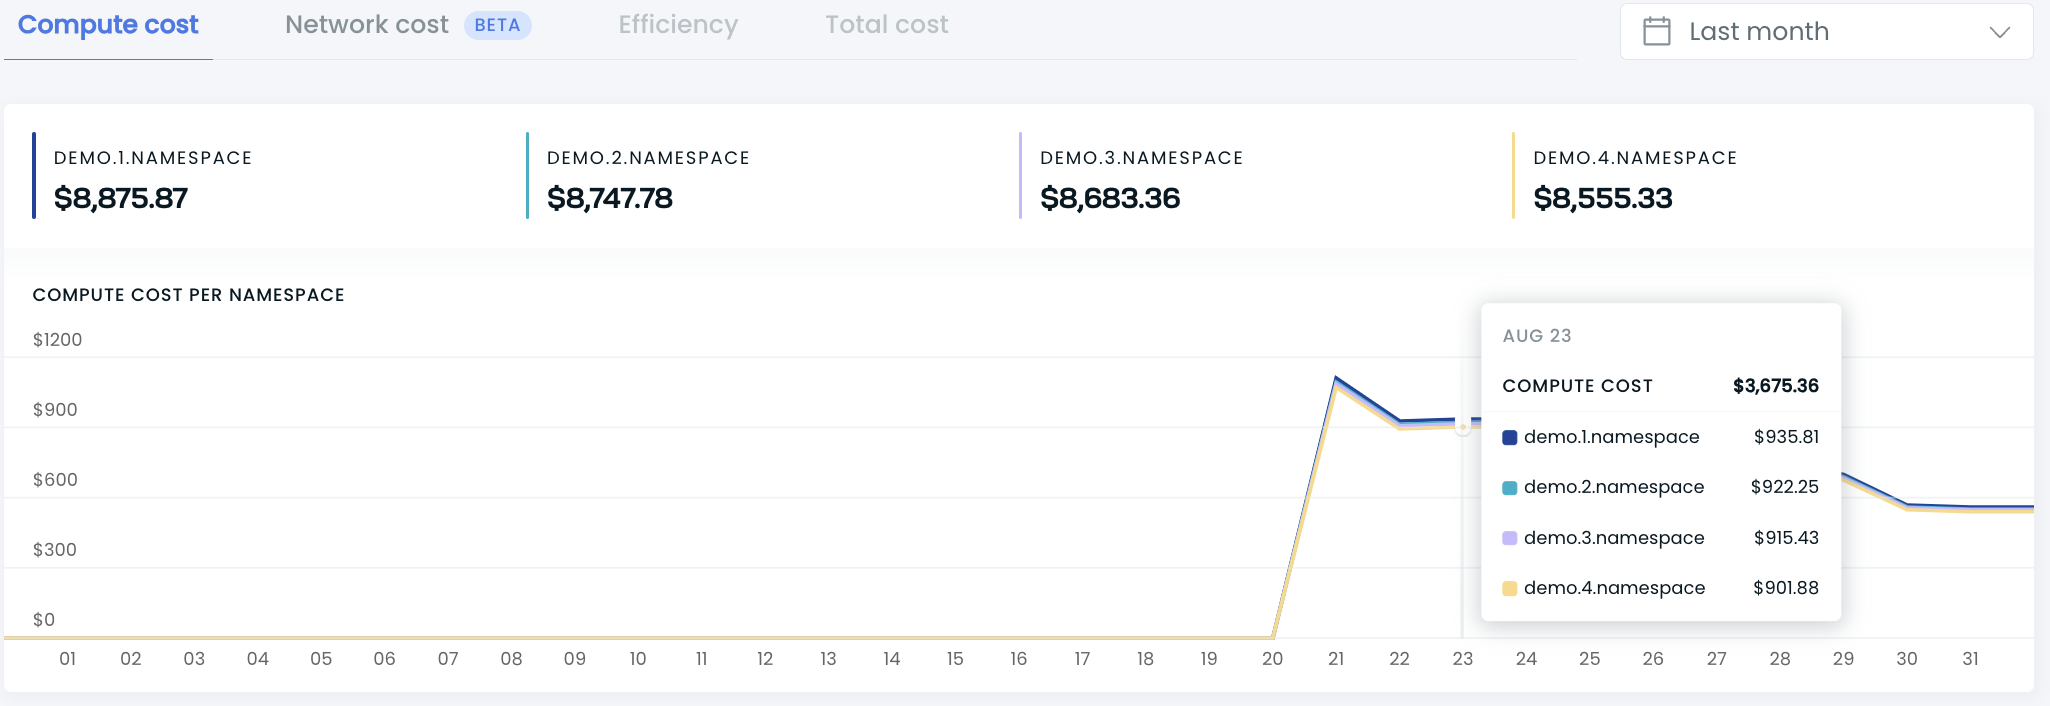
This view lets you see the top five namespaces and their daily costs in one place. You can check all the namespace cost details by hovering over a selected date.
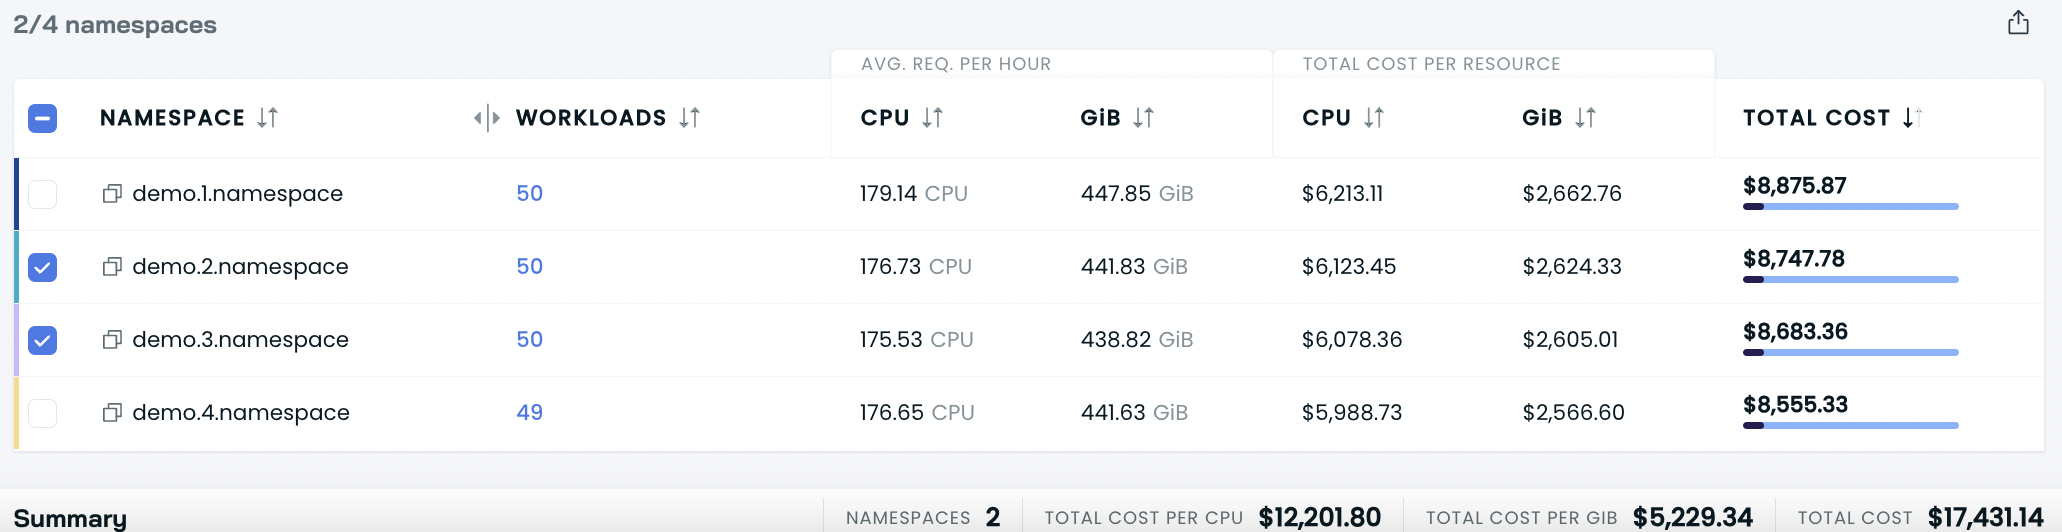
List of namespaces with cost details per selected period
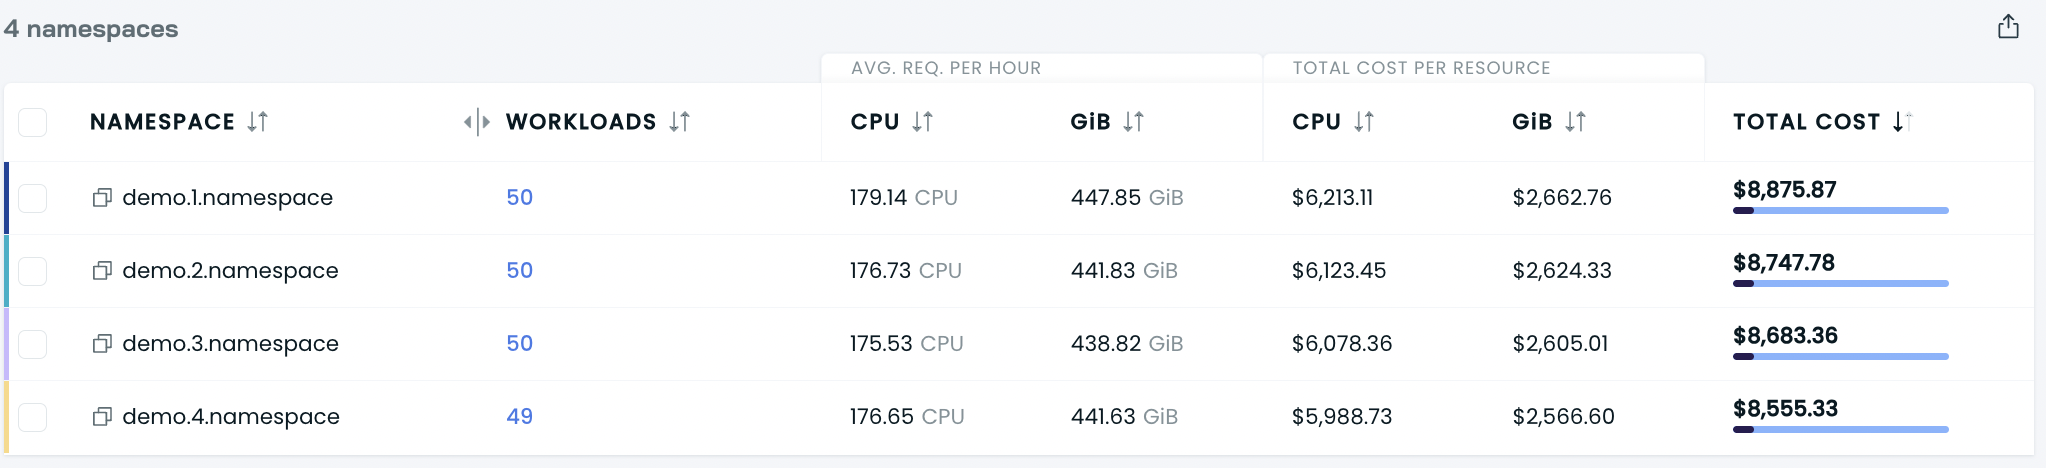
This view allows you to dive into the details of each namespace. For each of the listed namespaces, you can check:
- The number of workloads in the namespace,
- The average requested CPU and GiB per hour,
- Total cost per resource (CPU and GiB)
- The total cost of the namespace.
You can select namespaces by ticking the box on the left-hand side. If you do that, you will see a summary of the cost details at the bottom of the screen: