
Overview
Workload Autoscaler automatically scales your workload requests up or down to ensure optimal performance and cost-effectiveness.
Getting started
To start using workload optimization, you must install the Workload Autoscaler component and the custom resource definitions for the recommendation objects. You can do this by getting the install script from our API or using our console once you visit the workload optimization page.
NoteYour cluster must be running in automated optimization mode, as workload optimization relies on the cluster controller to create the recommendation objects in the cluster.
Supported Workload Types
The Cast AI Workload Autoscaler supports optimization for the following native Kubernetes workload types:
| Workload Type | Support Added In | VPA Modes | HPA Support |
|---|---|---|---|
| Deployment | Initial release | Immediate and Deferred | Supported |
| StatefulSet | v0.13.0 | Immediate and Deferred | Supported |
| DaemonSet | v0.5.0 | Deferred only | Not supported |
| Rollout* | v0.6.0 | Immediate and Deferred | Supported (v0.21.0+) |
| ReplicaSet | v0.32.0 | Immediate and Deferred | Not supported |
| CronJob | v0.44.3 | Immediate and Deferred | Not supported |
*For Rollouts, deferred mode is the default, but immediate mode can be enabled (v0.21.0+).
DaemonSet support
DaemonSet workloads are supported from workload-autoscaler v0.5.0.
For DaemonSets — and any workload whose footprint scales with the node it runs on — you can also size requests as a percentage of node-allocatable CPU and memory. See Node-aware DaemonSet sizing.
Agent Version Requirements
Different features require specific minimum versions of both the workload-autoscaler component and the Cast AI agent. The Workload Autoscaler requires a minimum Kubernetes version of 1.18.
High Availability Configuration
By default, since v0.30.0, the Cast AI Workload Autoscaler runs in a high-availability configuration with two replica pods and includes anti-affinity to ensure the replica pods run on different nodes.
Only one instance performs operations like recommendation generation at any time, while the second instance remains ready to take over if needed.
Cast AI workload-autoscaler requirements
workload-autoscaler requirements| Feature | Minimum Version |
|---|---|
| Deferred apply mode for recommendations | v0.5.0 |
| High-availability with multi-replica | v0.30.0 |
| Immediate apply mode for rollouts | v0.21.0 |
| Resource-specific optimization | v0.23.1 |
| Cast AI horizontal workload scaling (deprecated) | v0.9.1 |
| Custom workloads | v0.18.0 |
| Container grouping | v0.33.0 |
| Zero-downtime single-replica updates | v0.35.3 |
| Immediate apply mode for custom workloads | v0.41.2 |
| CronJob support | v0.44.3 |
| Kubernetes HPA (Horizontal Pod Autoscaling) | v0.44.4 |
| In-place pod resizing | v0.53.0 |
| Sidecar container optimization | v0.56.0 |
| 1-by-1 pod restart strategy | v0.57.0 |
| Whitelisting mode | v0.58.3 |
| Startup failure detection | v0.60.0 |
| Pod startup recommendations | v0.63.1 |
| ResourceQuota-aware scaling | v0.82.0 |
| Node-aware DaemonSet sizing | v0.105.0 |
| HPA target conversion | v1.0.11 |
Cast AI agent requirements
| Feature | Minimum Version |
|---|---|
| Kubernetes HPA (Horizontal Pod Autoscaling) | v0.60.0 |
| Argo Rollouts support | v0.62.2 |
The Cast AI agent is open source. To understand available features and improvements, you can view the complete changelog and release history in our GitHub repository.
Cast AI cluster-controller requirements
cluster-controller requirements| Feature | Minimum Version |
|---|---|
| Workload Autoscaler support | v0.54.0 |
Cast AI evictor requirements
evictor requirements| Feature | Minimum Version |
|---|---|
| Sidecar container optimization | helm chart 0.33.61 |
Check your current version
To check your current agent version:
kubectl describe pod castai-agent -n castai-agent | grep Image: | grep agent | head -n 1kubectl get pods -n castai-agent -l app.kubernetes.io/name=castai-agent -o jsonpath='{.items[0].spec.containers[?(@.name=="agent")].image}'To check your current workload-autoscaler version:
kubectl describe pod -n castai-agent -l app.kubernetes.io/name=castai-workload-autoscaler | grep Image:To check your current cluster-controller version:
kubectl describe pod -n castai-agent -l app.kubernetes.io/name=castai-cluster-controller | grep Image:Metrics collection and recommendation generation
Cast AI needs to process metrics to generate recommendations, so you must install a metrics-server. The Workload Autoscaler installation script installs it by default.
Workload Autoscaler continuously monitors workload metrics and compares them against current recommendations. When anomalous usage is detected (for example, metrics that are 50% higher than the recommended value), new recommendations are generated immediately without waiting for the regular cycle. Additionally, recommendations are regenerated every 30 minutes to handle gradual changes and ensure ongoing optimization.
LimitRange Compliance: When LimitRanges are present in a namespace, Workload Autoscaler automatically adjusts recommendations to comply with the defined constraints. Changes to LimitRanges trigger immediate recommendation updates to ensure workloads remain schedulable.
NoteAll generated recommendations will consider the current requests/limits and any applicable LimitRange constraints.
Applying recommendations automatically
Once the recommendation lands in the cluster, the Workload Autoscaler component is notified that a recommendation has been created or updated.
Next, Workload Autoscaler:
- Works as an admission webhook for pods - when pods are created matching the recommendation target, it modifies the pod to have its requests/limits set to what is defined in the recommendation
- Finds the controller and triggers an update to cause the pods controlled by the controller to be re-created (for example, for a deployment object, it adds an annotation to the pod template)
Workload Autoscaler currently supports deployments, statefulsets, and rollouts. By default, deployments are updated immediately, which may result in pod restarts.
For rollouts, you can choose between two modes:
- Deferred mode (default): Workload Autoscaler waits for pods to restart naturally before applying new recommendations
- Immediate mode (requires v0.21.0+): Similar to deployments, recommendations are applied right away, which may trigger pod restarts
How to enable Workload Autoscaler
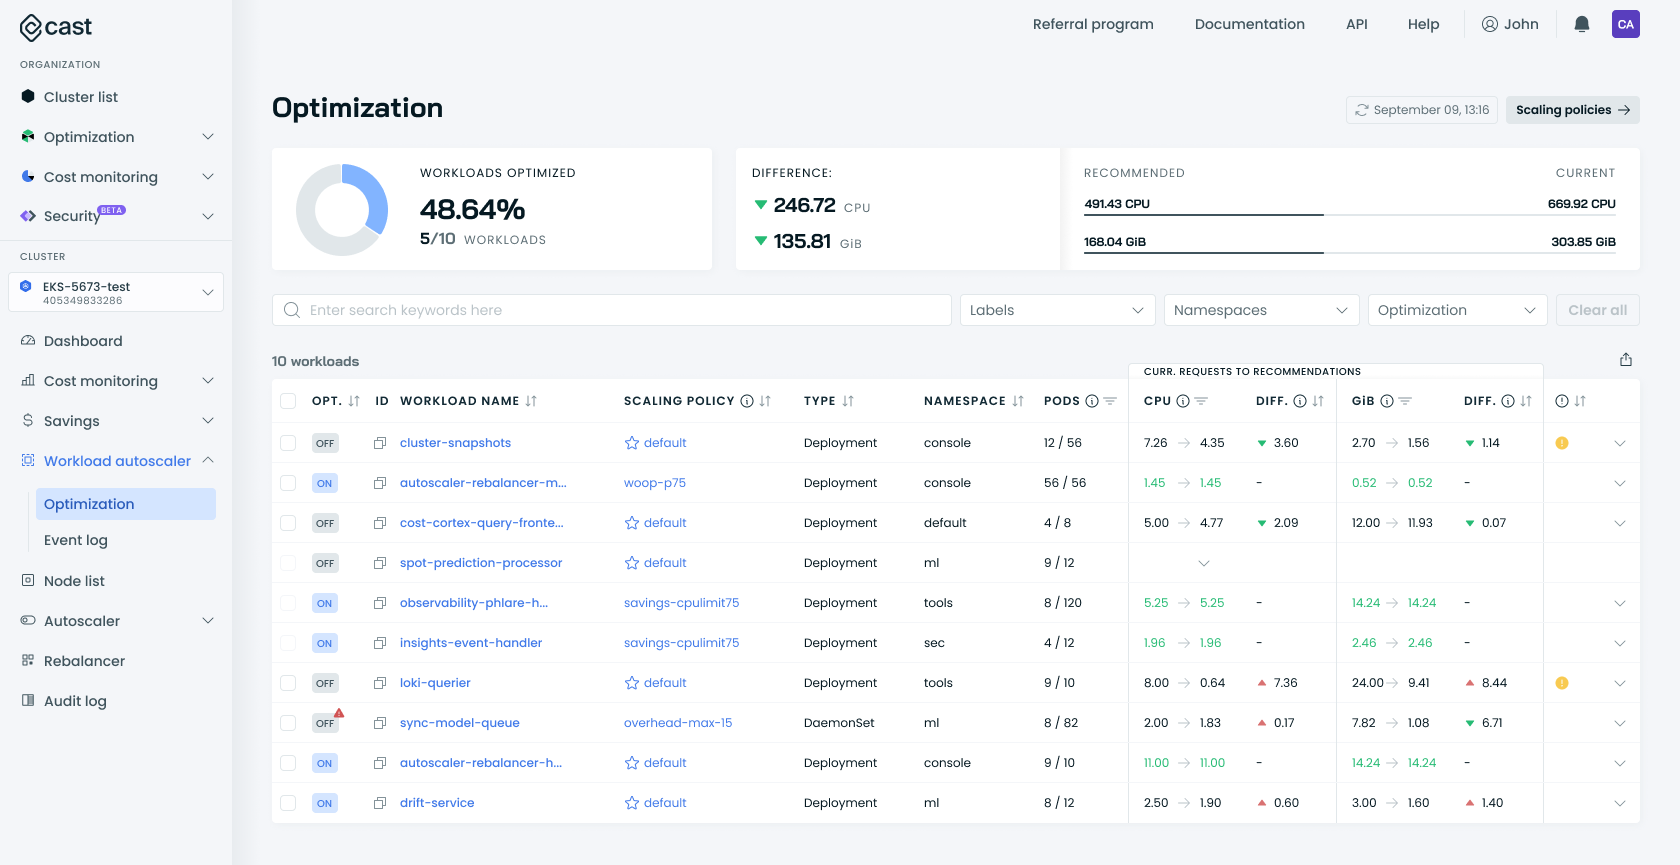
Scaling policies
Scaling policies allow you to manage all your workloads centrally, with the ability to apply the same settings to multiple workloads simultaneously. Moreover, you can create your custom policy with different settings and apply it to multiple workloads simultaneously.
When you start using our Workload Autoscaler component, all of your workloads will automatically have a default scaling policy applied to them at first, using our default settings. When a new workload appears in the cluster, it will automatically be assigned to the default policy.
If the default scaling policy is suitable for your workloads, you can enable scaling in two ways:
- Globally via the scaling policy by enabling Automatically optimize workloads – this will enable scaling only for the workloads we have enough data about. Workloads that aren’t ready will be checked later and enabled once the platform has enough data. When this setting is enabled on the default scaling policy, every new workload created in the cluster will be scaled automatically once the platform has enough data.
- Directly from the workload – once enabled, autoscaling will start immediately (depending on the autoscaler mode chosen at the policy level).
How to configure recommendations
You can configure recommendations via the API to add additional overhead for a particular resource or change the function used to select the baseline for the recommendation.
For example, you can configure the MAX function to be used for CPU and set the overhead to 20%. This means that the CPU recommendation would be the maximum observed CPU usage over 24 hours plus 20% overhead.
You can find the optimization settings in the scaling policies. You can carry out the following configuration tasks:
- Scale recommendations by adding overhead.
- Fine-tune the percentile values for CPU and memory recommendations.
- Specify the optimization threshold.
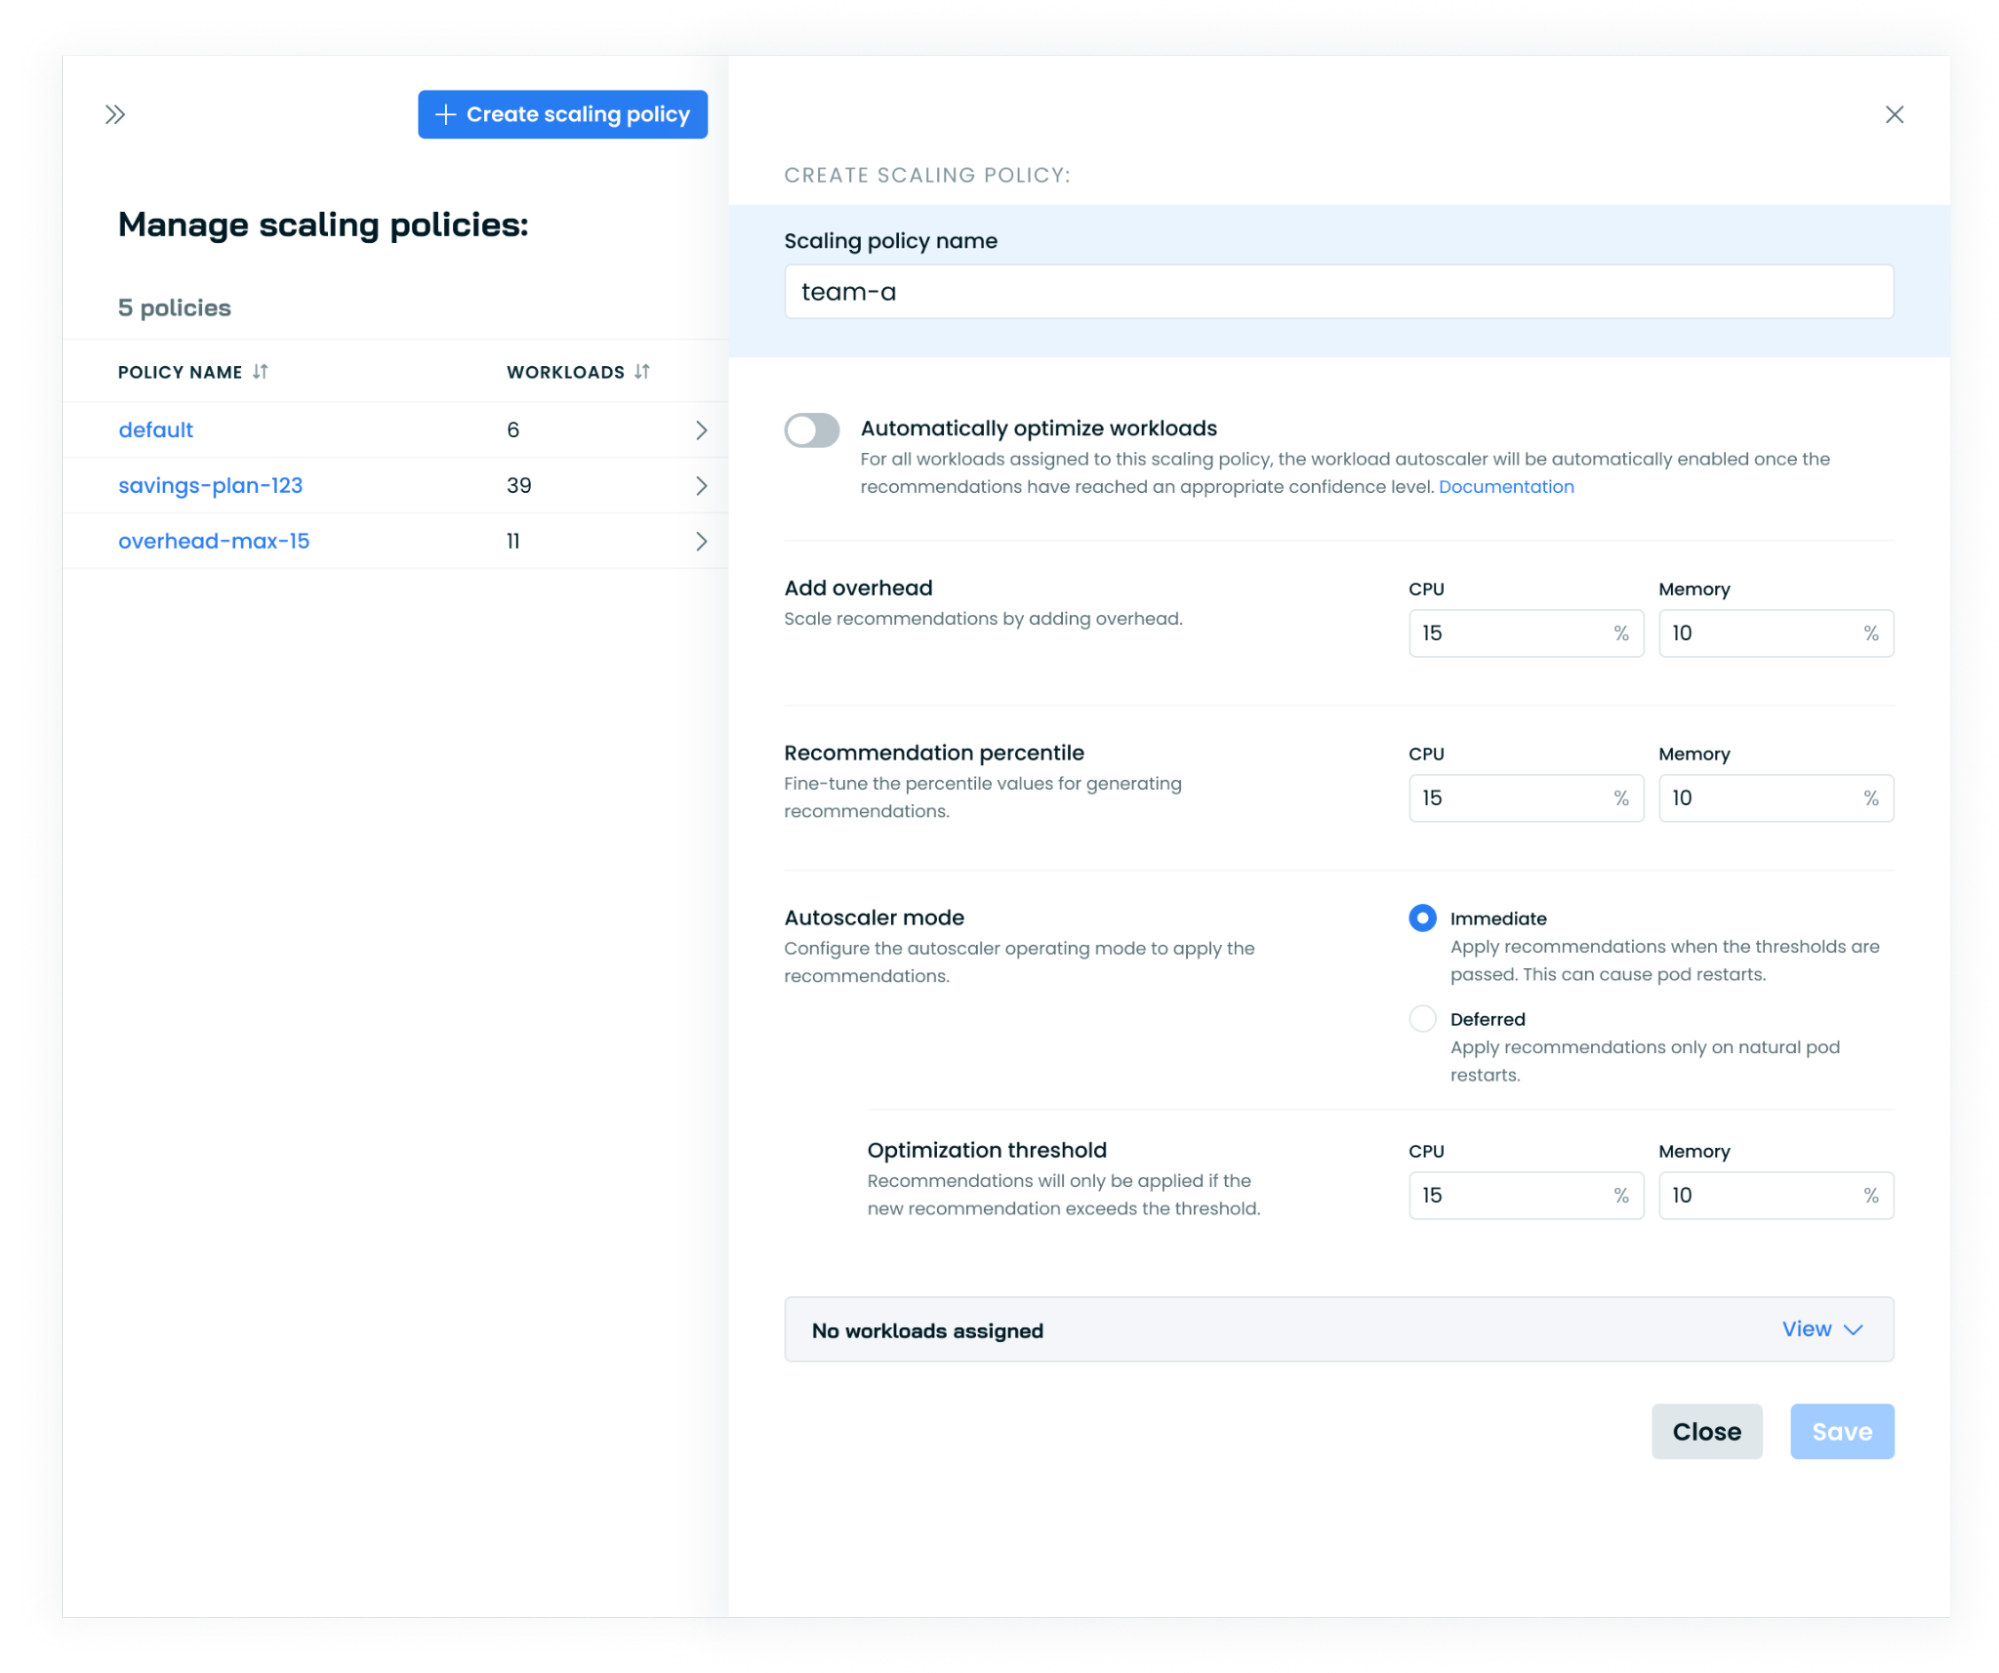
You can fine-tune the following settings in the scaling policies:
- Automatically optimize workloads – the policy allows you to specify whether our recommendations should be automatically applied to all workloads associated with the scaling policy. This feature enables automation only when there is enough data available to make informed recommendations.
- Recommendation percentile – this determines which percentile Cast AI will recommend considering the last day of usage. The recommendation will be the average target percentile across all pods spanning the recommendation period. Setting the percentile to 100% will no longer use the average of all pods but the maximum observed value over the period.
- Overhead – it marks how much extra resource should be added on top of the recommendation. By default, it's set to 10% for memory and 10% for CPU.
- Autoscaler mode - this can be set to immediate or deferred.
- Optimization threshold – when automation is enabled and Workload Autoscaler works in immediate mode, this value determines when to apply scaling recommendations.
For upscaling, the threshold is calculated relative to current resource requests, while for downscaling, it's calculated relative to the new recommended value.
For example, with a threshold of 10%, an upscale from 100m to 120m CPU would be applied immediately (20% increase relative to current 100m), while an upscale from 110m to 120m would not be applied immediately (8% increase relative to new 110m).
The default value for both memory and CPU is 10%.
Immediate vs. deferred scaling mode
If the autoscaler mode is set to immediate, it will check if a new recommendation meets the user-set optimization thresholds. It won't be applied if the recommendation doesn’t meet these thresholds. If it does pass the threshold, Workload Autoscaler will automatically modify pod requests per the recommendation.
Moreover, Workload Autoscaler will also apply new recommendations upon natural pod restarts, such as a new service release or when a pod dies due to a business or technical error. This helps to avoid unnecessary pod restarts.
If the scaling mode is set to deferred, Workload Autoscaler will not initiate a forced restart of the pod. Instead, it will apply the recommendation whenever external factors initiate pod restarts.
System overrides for scaling mode
NoticeIn certain scenarios, Workload Autoscaler may override the chosen scaling mode to ensure optimal performance and prevent potential issues.
Here are some cases where the system may default to deferred mode, even if immediate mode is selected:
- Hard node requirements: Workloads with certain specific node constraints are set to deferred mode. This includes:
- Specific pod anti-affinity: If a workload has pod anti-affinity rules that use the
kubernetes.io/hostnameas thetopologyKeywithin arequiredDuringSchedulingIgnoredDuringExecutionblock. - Host network usage: Pods that require the use of the host's network.
- Specific pod anti-affinity: If a workload has pod anti-affinity rules that use the
These constraints are considered hard node requirements. Using deferred mode in these cases prevents potential scheduling conflicts and resource issues that could arise from immediate pod restarts.
- Rollouts: Workloads of the Rollout kind are always set to deferred mode, as they have their own update mechanisms that could conflict with immediate scaling.
These overrides help maintain cluster stability and prevent scenarios where immediate scaling could lead to increased costs or resource conflicts. Check your workload configurations for these conditions if you notice unexpected deferred scaling behavior.
Mark of recommendation confidence
Cast AI's Workload Autoscaler uses recommendation confidence to determine how aggressively to optimize your workloads. Confidence is based on the quality and quantity of historical usage data available for analysis.
Confidence levels
Full confidence workloads have sufficient historical data for Workload Autoscaler to generate reliable, unrestricted recommendations. These workloads receive optimization based on comprehensive usage analysis without artificial limits. See building sufficient confidence to learn what is required for a workload to be considered as having full confidence.
Low confidence workloads lack sufficient historical data for reliable analysis. The autoscaler applies different optimization strategies depending on how optimization for the workload was enabled:
- Policy-optimized workloads: Receive gradual scaling with conservative limits during the confidence-building period
- Manually enabled workloads: Receive unrestricted recommendations immediately, bypassing confidence checks
Gradual scaling for new clusters
For newly onboarded clusters (within the first 24 hours), Workload Autoscaler provides immediate optimization benefits through gradual scaling, even for workloads with low confidence. This allows you to see optimization results within hours rather than waiting days for complete data collection.
| Workload Data | Max Resource Request Adjustment | Behavior After Threshold |
|---|---|---|
| < 2.4 hours | 10% | - |
| < 6 hours | 25% | - |
| < 24 hours | 35% | - |
| > 24 hours | - | Confidence-based optimization |
During this period:
- Policy-optimized workloads automatically receive conservative resource adjustments with progressive limits
- Manually enabled workloads (via annotations or direct UI toggle) bypass gradual scaling and receive unrestricted recommendations immediately
Confidence indicators in the UI
The Recommendation Confidence column displays visual indicators for workloads with low confidence:
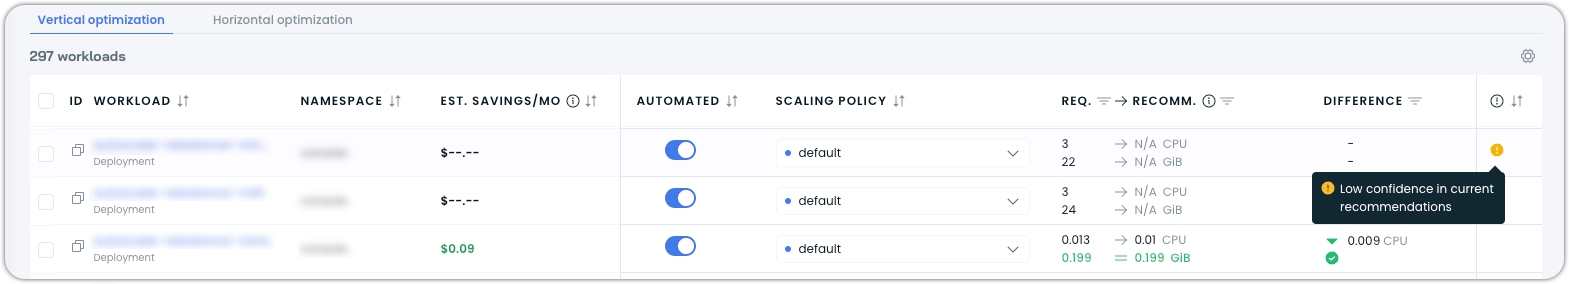
Workloads showing low confidence indicators and belonging to automated scaling policies will be scaled gradually for the first 24 hours, then wait for sufficient (full) confidence before transitioning to unrestricted optimization.
Building sufficient (full) confidence
For Workload Autoscaler to consider confidence as sufficient for unrestricted optimization:
-
Minimum monitoring period: The workload must be monitored for at least 24 hours, even for existing workloads in newly connected clusters.
-
Adequate metric density: Beyond the minimum 24-hour requirement, workloads with longer look-back periods need metrics for approximately 40% of the configured period. For example, with a 7-day lookback period, confidence continues building over about 3 days of continuous operation.
How to create a new scaling policy?
Scaling policies are a great tool for managing multiple workloads at once. Some workloads may require a higher overhead, while others would be unnecessary.
To learn how to create and manage scaling policies, refer to our dedicated guides:
Enabling Workload Autoscaler for a single workload
To enable optimization for a single workload:
- Select the workload you want to optimize.
- The drawer that opens allows you to review the historical resource usage and recommendations, view current settings, and toggle optimization on or off.
- Once you’ve made the review, click the Turn Optimization On button and save the changes.
OOM event handling
Despite careful monitoring and historical data analysis, out-of-memory (OOM) events can occur due to sudden workload spikes or application-level issues.
Cast AI Workload Autoscaler has a robust system for handling possible OOM events in Kubernetes clusters. This feature prevents OOMs by dynamically adjusting memory allocations based on historical data and recent events.
Detection
The system detects OOM events by monitoring pod container statuses.
- The CAST AI Agent collects pod data through regular snapshots.
- Pod container termination states are extracted from these snapshots:
{ "name": "data-analysis-service", "lastState": { "terminated": { "exitCode": 137, "reason": "OOMKilled", "startedAt": "2023-08-16T13:51:08Z", "finishedAt": "2023-08-16T13:58:43Z", "containerID": "containerd://8f7e9bc23a1d5f6g987h654i321j987k654l321m987n654o321p987q654r" } } } - When an
OOMKilledstate is detected, an OOM event is emitted. - The OOM event is stored in the database to ensure each event is handled only once.
When a container is terminated with the reason OOMKilled, it triggers the OOM handling process.
Handling
When an OOM event is detected, the system takes the following actions:
- The OOM event handler watches for new OOM events.
- Upon receiving an event, it adjusts the configuration based on the previous workload state.
- A new recommendation is generated with increased memory overhead.
Memory Overhead Adjustment
The system uses an incremental approach to adjust memory overhead, with a minimum baseline to ensure effective recovery for small workloads:
- Initial OOM event: memory overhead is increased by 20%, calculated from a minimum baseline of 500Mi. For workloads with recommendations below 500Mi, the 20% is calculated from 500Mi rather than the actual recommendation value.
- If no further OOM events occur, the overhead slowly decreases back to the original allocation (x1) over time.
- If the latest recommendation was not applied to the OOM-killed pod container, the memory overhead increase is 1% (x1.01). The system tracks whether recommendations have been applied before counting new OOM events toward the consecutive OOM threshold.
- If another OOM event occurs during this decrease:
- The system starts from the current overhead increase.
- An additional 20% is added to the current value (still using the 500Mi minimum baseline for calculations when applicable).
For example:
- A workload with a 100Mi recommendation that experiences an OOM event doesn't just get 20Mi added. The 20% is calculated from the 500Mi baseline, bumping the recommendation to 200Mi.
- A workload already at 500Mi or above uses its actual recommendation as the baseline, so a 500Mi workload increases to 600Mi after an OOM event.
- If the current overhead is 5% (x1.05) when an OOM occurs again, it will be increased to 25% (x1.25).
- This process can continue up to a maximum of 2.5x the original allocation.
- The maximum memory overhead is capped at 2.5x (250%) the original allocation. If a workload reaches this ceiling and continues to experience OOM kills, it will eventually trigger the automatic optimization disable after 20 consecutive events and enter a 4-hour cooldown period.
Recommendation regeneration
After adjusting the configuration, the OOM handler invokes the recommendation generator with the latest settings. This process does the following:
- Generates a new recommendation based on the adjusted configuration.
- Emits a
recommendation generatedevent. - Applies the new recommendation asynchronously.
Automatic optimization disable
As a safety mechanism, Workload Autoscaler automatically disables optimization for workloads experiencing persistent OOM events that cannot be resolved through memory adjustments.
How it works
If a workload experiences 20 OOM kill events within a rolling 1-hour window, the system automatically disables optimization for that specific workload. This prevents the autoscaler from continually adjusting a workload that may have underlying issues unrelated to resource sizing.
The OOM counter operates as follows:
- Each OOM kill event increments the counter within the rolling 1-hour window.
- The counter does not reset when a new recommendation is generated.
- The counter resets only after a recommendation has been applied and the system identifies a subsequent OOM kill event.
- OOM kill events are only recognized within a 10-minute detection window — if a recommendation has not been applied, only OOM kills older than 10 minutes from the last OOM event are counted. This means at most 6 OOM kills can be recognized per hour under normal detection conditions.
This ensures the system waits for recommendations to take effect before reevaluating their impact.
Automatic re-enable
After 4 hours, the system automatically re-enables optimization for the workload. This allows the autoscaler to attempt optimization again after a cooldown period, which can help in cases where:
- The underlying application issue has been resolved
- Traffic patterns have changed
- The workload's memory requirements have stabilized
If the workload continues to experience consecutive OOM kills after re-enablement, the disable cycle repeats.
Handling memory pressure events
Workload Autoscaler has built-in logic to handle memory pressure events and prevent pod evictions due to out-of-memory (OOM) issues. This feature is particularly important in tightly packed clusters where increased pod memory usage might trigger eviction events before the OOM kill, and pods might enter eviction loops due to unaddressed memory pressure.
Understanding memory pressure evictions vs OOM kills
It's important to distinguish between memory pressure evictions and OOM kills:
- Memory pressure evictions: These occur when a node is under memory pressure but before the pod reaches its memory limit. Evictions happen in the range between a pod's memory request and its limit. The Kubernetes scheduler may evict pods to free up resources and maintain node stability.
- OOM kills: These happen when a pod exceeds its memory limit. The container runtime terminates the pod immediately.
How it works
When a memory pressure eviction event is detected, the autoscaler follows this process:
- Check if the pod experiencing the eviction is managed by CAST AI.
- Determine if this pod is the one causing the memory pressure.
- Verify if the pod's memory usage data is available in the event.
- If all conditions are met, create a system override for minimum memory adjustment.
Minimum memory adjustment calculation
- Pod's memory usage at the time of the eviction event
- Plus the configured memory overhead (as defined in the vertical scaling policy)
This adjustment is applied when generating the next recommendation for the pod and remains in effect for 8 hours to ensure stability.
Criteria for adjustment
It's important to note that this mechanism only applies to pods that meet the following criteria:
| Criterion | Requirement |
|---|---|
| Management | Cast AI must manage the pod |
| Cause | The pod must be directly causing memory pressure |
| Data Availability | Memory usage data must be available in the eviction event |
NoticeNo automatic adjustment is made for pods that don't meet all these criteria.
This targeted approach ensures that the autoscaler efficiently addresses the root cause of memory pressure events.
Surge handling
Workload Autoscaler includes a surge detection and handling mechanism that automatically responds to rapid increases in resource utilization. This feature ensures your workloads remain stable during traffic spikes or unexpected load increases without requiring manual intervention.
How surge detection works
The system continuously monitors container resource usage and compares it with current Vertical Pod Autoscaler (VPA) recommendations. A surge is detected when usage exceeds certain thresholds:
- CPU surge: Detected when there's both a minimum absolute increase of
100mCPU and a minimum relative increase of100%(comparing average usage to VPA recommendation) - Memory surge: Detected when there's both a minimum absolute increase of
100Miand a minimum relative increase of20%(comparing average usage to VPA recommendation)
If the surge continues, the system will re-evaluate every 15 minutes to track ongoing elevated resource usage.
Automatic response to surges
When a surge is detected, Workload Autoscaler dynamically adjusts the configuration of the affected workload and generates new VPA recommendations:
- Progressive lookback shortening: For every 15 minutes since the surge started, the system shortens the lookback period to focus on recent usage patterns
- Gradual quantile increase: For every 5 minutes since the surge started, the system increases the quantile used for recommendations to be more conservative
These adjustments help the system respond more quickly to rising resource demands while maintaining stability.
Workloads with Horizontal Pod Autoscaler
For workloads with a native Kubernetes HPA, surge detection behaves differently. Workload Autoscaler suppresses surge detection as long as the HPA has not scaled to its maximum replica count.
HPA responds to load increases by adding replicas horizontally, which is faster than adjusting vertical resource recommendations and waiting for pods to restart. Workload Autoscaler defers to HPA as the first line of defense against traffic spikes. Surge detection activates only when horizontal scaling capacity is fully exhausted. That is, when the workload is already running at maxReplicas.
Why spikes may not affect recommendations
Even when you sometimes see a spike in the console for such a workload, it may not necessarily change the CPU/memory recommendation due to per-pod aggregation.
Per-pod aggregation: Recommendations are calculated per container across all pods. If only a small number of pods experience a spike out of many replicas, the spike has minimal statistical weight. For example, if 5 out of 100 pods briefly exceed the recommendation, a P95 quantile calculation over a multi-day lookback window treats those data points as outliers.
Temporary configuration adjustments
The surge-related configuration adjustments are temporary and expire based on the original quantile configured:
- Adjustments for workloads using lower quantiles (e.g.,
p50) last up to 12 hours - Adjustments for workloads using higher quantiles (e.g.,
p99) last as little as 1 hour - The maximum duration for any surge configuration adjustment is 24 hours
After the adjustment period expires, the system reverts to using the original configuration for VPA recommendations.
NoteThese adjustments only apply to workloads using the
quantilefunction for recommendation generation. Workloads configured to use themaxfunction already use the maximum observed value, so no configuration adjustment is needed during surges.
Recommendation generation and application
After adjusting the configuration, the surge handler follows this process:
- Generates a new recommendation based on the adjusted configuration
- Records a
recommendation generatedevent in the system - Applies the new recommendation according to the workload's configured scaling mode
You can view surge detection events and the resulting adjustments in the Event log, which provides visibility into how Workload Autoscaler responds to changing resource demands.
Startup failure detection
Optimized resource requests can leave workloads without enough CPU or memory to pass their readiness and startup probes during initialization. This is especially common when workloads rely on a startup period that excludes initialization metrics from recommendations, or when many workloads restart simultaneously after enabling optimization.
How it works
Workload Autoscaler collects the prober_probe_total metric from each node via the castai-workload-autoscaler-exporter. A startup failure event is raised when the number of readiness or startup probe failures for a workload exceeds 10 in the last 5 minutes.
NoteProbe failure metrics reflect individual check failures, not definitive pod failures. A probe can fail multiple times before the
failureThresholdis reached. If the probe eventually succeeds, the earlier failures are still counted.
When a startup failure is detected, Workload Autoscaler adds 20% overhead to both CPU and memory recommendations. This overhead decays over time, similar to OOM kill memory overhead. Unlike OOM handling, repeated detections reset the overhead to 20% rather than stacking additional increases.
Startup failure detection requires VPA optimization to be enabled, at least one recommendation to have been generated, and castai-workload-autoscaler-exporter v0.60.0 or later. The exporter is installed by default during cluster onboarding — see Custom metrics for manual installation instructions.
Relationship to pod startup recommendationsPod startup recommendations proactively prevent startup issues by preserving original CPU requests during initialization. Startup failure detection is a reactive safety net for cases where the workload still fails to pass its probes. Both can be active on the same workload.
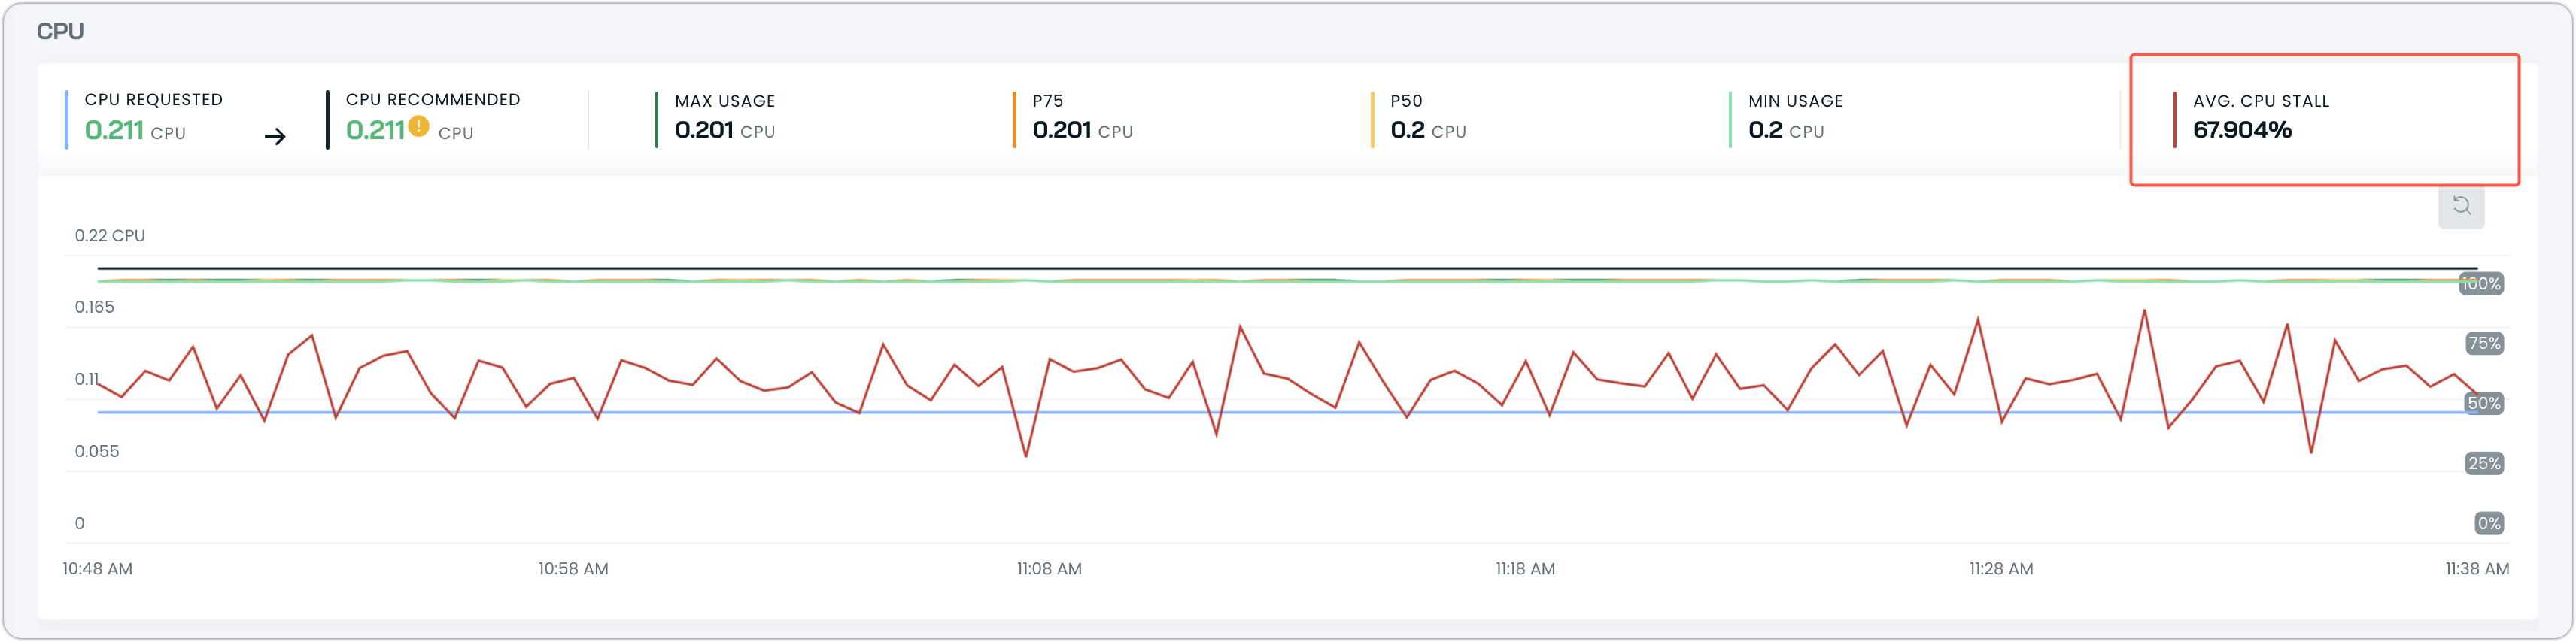
Stall detection
Resource contention can cause workloads to underperform even when CPU usage appears normal. This happens when requests are set too low or the node lacks effective headroom. Workload Autoscaler uses Pressure Stall Information (PSI) metrics to detect hidden CPU contention and respond by adjusting resources.
How stall detection works
The system collects CPU stall metrics per workload container, checking every 5 minutes for the percentage of time spent waiting for CPU. If the calculated percentage exceeds the configured threshold and enough pods are affected (based on the pod threshold), the Workload Autoscaler generates a new recommendation with adjustments designed to relieve contention. The recommendation is applied according to the scaling mode configured in the policy (immediate or deferred).
Why stall detection improves performance
Traditional approaches to CPU contention, such as evicting and moving pods, often fail because:
- Musical chairs effect: Under-provisioned pods relocate the problem rather than solve it. Unless eviction is paired with an immediate change to requests and limits, you're spreading the same pain to another node.
- Context blindness: Eviction logic needs to understand what it's affecting and why. Without workload-aware context (SLO sensitivity, stall tolerance, intent), eviction can cause more harm than good.
By increasing CPU requests first, stall detection gives workloads higher cgroup weight, allowing them to burst more effectively and reducing contention. In some cases, this improves performance without a restart because the workload simply gets higher priority on the same node (using in-place resize). If the new requests no longer fit the node, Kubernetes can reschedule the pod, and the cluster can add capacity, avoiding the "move the pain elsewhere" pattern.
Automatic response to stall
When CPU stall is detected and sustained, Workload Autoscaler progressively adjusts recommendations based on detection duration:
- Increased recommendation percentile: Higher percentiles capture more of the workload's resource demand
- Shortened look-back window: Focuses on recent usage patterns
- Increased overhead: Surfaces demand that traditional metrics miss
After issuing a stall-aware recommendation, the system waits 15 minutes before re-evaluating that workload. This stabilization window gives the updated recommendation time to take effect. If stall persists after the stabilization period, the system can issue further adjustments.
The magnitude of each adjustment depends on multiple factors, including workload size, stall duration, the configured look-back period, and recommendation percentile. Immediate results also vary based on how the workload responds to increased requests—whether the additional resources successfully reduce CPU stall.
Monitoring stall detection
You can monitor stall detection activity in several ways:
- Event log: The Event log records "CPU stall detected" events when thresholds are breached, showing stall percentage per container and the resulting recommendation adjustment.
- Workload charts: The workload detail page displays observed CPU stall in the resource charts, allowing you to track contention over time.
For information on configuring stall detection thresholds, see Stall detection settings.
Troubleshooting
NoteSome of the Helm commands below use the
--reset-then-reuse-valuesflag, which requires Helm v3.14.0 or higher.
Failed Helm test hooks
When installing Workload Autoscaler, a Helm test hook is executed to verify proper functionality. Workload autoscaler is an in-cluster component that applies resource request recommendations to workloads. For that, it uses two main mechanisms, the functionality of which is verified by the test hook.
The test validates these two key mechanisms:
- Reconciliation loop on Recommendation objects
- Admission webhook for Kubernetes Pod objects
A failed test indicates one or both mechanisms aren't working correctly, which prevents workload optimization. Follow these steps to identify and resolve the issue:
Verify Recommendation CRD installation
- Check the CRD status:
kubectl describe crd recommendations.autoscaling.cast.aiThe output should describe the object without any failure status.
- Verify API server metrics:
kubectl get --raw /metrics | grep apiserver_request_total | grep recommendationsThe output should show metrics for Recommendation objects being queried from the Kubernetes API server.
- Review Workload Autoscaler logs for reconciliation messages containing
reconciling recommendation. This shows that the reconciliation loop is being invoked.
Check admission webhook invocation
- Verify webhook metrics:
kubectl get --raw /metrics | grep apiserver_admission_webhook | grep workload-autoscaler.cast.aiThe output should show metrics from the Kubernetes API server invoking the admission webhook.
- Check Workload Autoscaler logs for pod mutation messages containing
mutating pod resources. This shows that the admission webhook is being invoked, and the Kubernetes pod is being mutated.
Validate port configuration
Check that ports are aligned across components, i.e., the admission webhook is pointing to the port exposed by the service, and the service is pointing to the port exposed by Workload Autoscaler:
- Check admission webhook port:
kubectl describe mutatingwebhookconfigurations castai-workload-autoscaler- Check service port:
kubectl describe service castai-workload-autoscaler- Check deployment port:
kubectl describe deployment castai-workload-autoscalerLook for the WEBHOOK_PORT environment variable value.
AWS EKS with custom CNI (Calico, Cilium)
When using Amazon EKS with a custom CNI such as Calico or Cilium instead of the default AWS VPC CNI, additional configuration is required for Workload Autoscaler to function properly. The custom CNI setup can interfere with the admission webhook connectivity.
Configuration
For EKS clusters using custom CNI solutions like Calico or Cilium, you must enable host networking for Workload Autoscaler deployment. This ensures that the Kubernetes API server can properly invoke the admission webhook.
To configure Workload Autoscaler with host networking enabled:
helm upgrade -i castai-workload-autoscaler castai-helm/castai-workload-autoscaler \
  -n castai-agent \
  --reset-then-reuse-values \
  --set hostNetwork=true
Host network and port conflicts
When running Workload Autoscaler with hostNetwork=true, the webhook service port is exposed directly on the node's network interface. This can lead to port conflicts if another service on the same node is already using the webhook port.
NoteWorkload Autoscaler includes built-in pod anti-affinity rules (since v0.30.0) that prevent multiple replicas from running on the same node, avoiding port conflicts between its own instances.
Handling port conflicts
If you encounter port binding errors in Workload Autoscaler logs (such as address already in use), this typically indicates a conflict with another service using the same port (commonly Kyverno).
Recommended solution: configure pod anti-affinity on both services
Configure pod anti-affinity rules on both Workload Autoscaler and the conflicting service to ensure they don't schedule on the same nodes. This is the preferred approach as it maintains the default port configuration.
Alternative: change the webhook port to 9444
If pod anti-affinity is not feasible, you can change the webhook port to avoid the conflict:
helm upgrade -i castai-workload-autoscaler castai-helm/castai-workload-autoscaler \
  -n castai-agent \
  --reset-then-reuse-values \
  --set hostNetwork=true \
  --set webhook.port=9444
WarningChanging the webhook port may require additional configuration:
- Network policies may need to be updated to allow traffic on the new port.
- Firewall rules may need to be adjusted to permit the new port.
The workload-autoscaler is OOMKilled
workload-autoscaler is OOMKilledIf your Workload Autoscaler pods are being terminated due to OOMKilled errors, follow the steps outlined below in order.
Resolution steps
-
Ensure you are using the latest Workload Autoscaler version.
- To check the installed version, run the following:
helm get metadata castai-workload-autoscaler -n castai-agent - To upgrade to the latest version, run:
helm repo update castai-helm
helm upgrade castai-workload-autoscaler castai-helm/castai-workload-autoscaler -n castai-agent --reset-then-reuse-values
- To check the installed version, run the following:
-
Upgrade the Kubernetes cluster to version
1.32or higher: Kubernetes version1.32introduced improved memory handling features. -
Enable pagination for the initial list request: If upgrading the Kubernetes cluster is not feasible, you can enable pagination to split the initial list requests into smaller chunks, reducing memory usage.
NoteThis may increase startup time and place additional load on the API server.
To enable pagination, run:
helm repo update castai-helm
helm upgrade castai-workload-autoscaler castai-helm/castai-workload-autoscaler -n castai-agent \
  --reset-then-reuse-values \
  --set additionalEnv.LIST_WATCHER_FORCE_PAGINATION=true
Since the request is processed in smaller chunks after enabling pagination, it may take longer to load initial workloads. If Workload Autoscaler pod restarts due to readiness issues, more time is needed to load objects from the cluster. Extend the probe timeouts to counter this issue.
You can configure the readiness and liveness probes with the following settings:
  # Number of seconds after the container has started before [probe] is initiated
  initialDelaySeconds: 10
  # How often (in seconds) to perform the [probe]
  periodSeconds: 15
  # Number of seconds after which the [probe] times out
  timeoutSeconds: 15
  # Minimum consecutive successes for the [probe] to be considered successful after having failed
  successThreshold: 1
  # Minimum consecutive failures for the [probe] to be considered failed after having succeeded
  failureThreshold: 6
To increase the initial delay to 60 seconds for both readiness and liveness probes, run:
helm repo update castai-helm
helm upgrade castai-workload-autoscaler castai-helm/castai-workload-autoscaler -n castai-agent \
  --reset-then-reuse-values \
  --set readinessProbe.initialDelaySeconds="60" \
  --set livenessProbe.initialDelaySeconds="60"
Adjust these settings based on your cluster size and requirements.
-
If pagination and probe adjustments don't help, consider increasing both the memory limit and request.
For example, to change the memory limit to2Giand memory request to1Gi, run:helm repo update castai-helm helm upgrade castai-workload-autoscaler castai-helm/castai-workload-autoscaler -n castai-agent \ --reset-then-reuse-values \ --set resources.limits.memory=2Gi \ --set resources.requests.memory=1Gi
Optimization isn't being applied
Problem: You want to verify that your workloads are actually running with optimized resource allocations.
Solution:
- Check the workload details page in the Cast AI console to compare current requests vs. recommendations
- Look for the annotation
autoscaling.cast.ai/vertical-recommendation-hashon your pods - this indicates optimization was applied - Compare pod resource requests with the recommendations shown in the console
# Check if optimization was applied to a specific pod
kubectl get pod <pod-name> -o yaml | grep "autoscaling.cast.ai/vertical-recommendation-hash"

# Compare actual pod resources with recommendations
kubectl describe pod <pod-name> | grep -A 10 "Requests:"
Manually trigger optimization application
If you do, in fact, determine that optimization was not applied, you can manually trigger the update by performing a rollout restart of your workload.
Problem: Some workloads appear to be running with outdated or unoptimized resource allocations.
Solution: Trigger a rolling restart to reapply current recommendations:
# Force reapplication of optimization for a Deployment
kubectl rollout restart deployment/<deployment-name>

# For StatefulSets
kubectl rollout restart statefulset/<statefulset-name>
This works because Workload Autoscaler optimizes resources during pod creation, so restarting pods will apply the latest recommendations.