
Analyzing database performance
Database performance analysis is essential for ensuring your applications run efficiently and your cloud resources are used effectively. Cast AI's Database Optimizer (DBO) provides rich visualization tools that help you understand performance patterns, identify bottlenecks, and make data-driven optimization decisions. This tutorial explores how to leverage these tools to improve your database efficiency.
Time Range Selection for Meaningful Analysis
The context of your analysis changes dramatically depending on the timeframe you examine. A performance dip might look alarming when viewed in isolation, but may actually be part of a regular pattern when seen in a broader context.
Cast AI's DBO includes a flexible time range selector in the top-right corner of both instance and database views. This tool allows you to adjust your analysis window to match your specific needs.
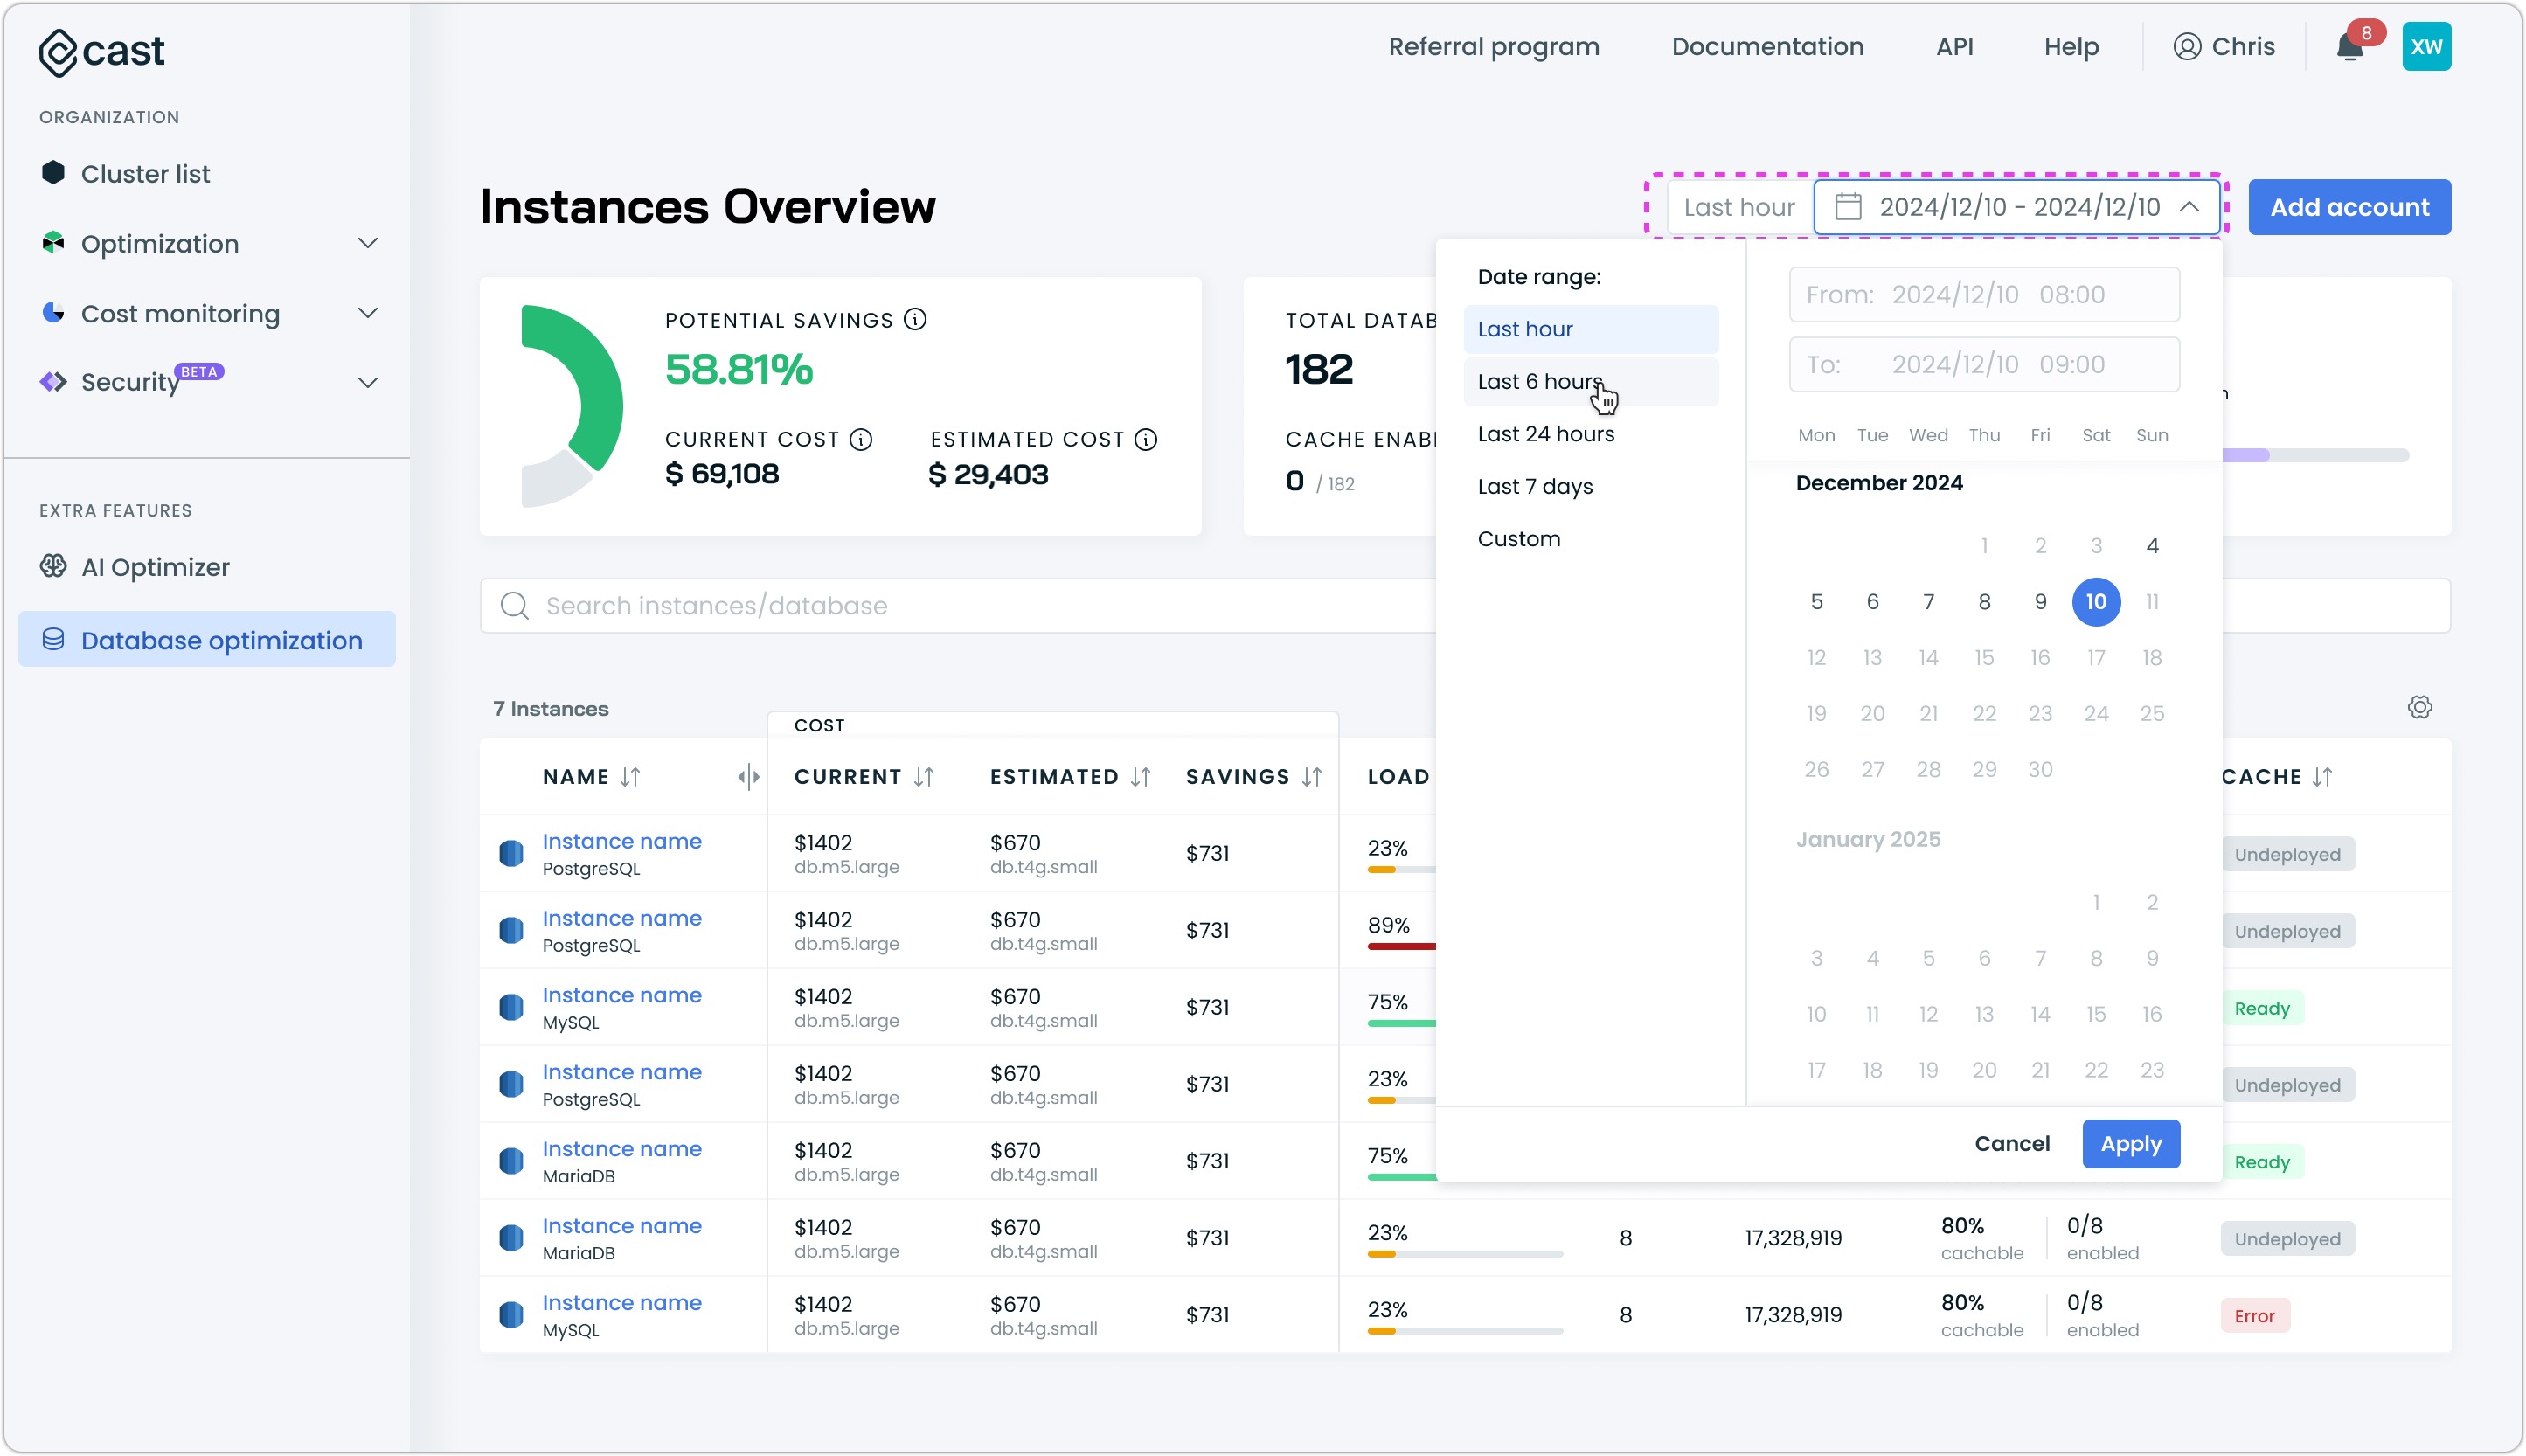
Each time range serves a different analytical purpose by adjusting how data is sampled and displayed:
| Time Range | Data Point Interval | Data Points | Typical Use Case |
|---|---|---|---|
| Last hour | 60 seconds | 60 points | Investigating immediate issues or monitoring real-time performance |
| Last 6 hours | 5 minutes | 72 points | Tracking performance through peak usage periods |
| Last 24 hours | 1 hour | 24 points | Analyzing daily patterns and identifying time-of-day trends |
| Last 7 days | 4 hours | 42 points | Discovering weekly patterns and assessing longer-term performance |
| Custom range | Varies based on selection | Varies | Analyzing specific time periods or events |
When you change the time range, all visualizations update simultaneously, ensuring consistent cross-comparison of metrics within the same timeframe.
Instance-Level Performance Insights
The instance view provides a holistic perspective on your database instance's performance across all its constituent databases. This view helps you identify system-wide patterns before diving into specific database details.
Overall Cache Efficiency
The primary visualization at the instance level is the Cache performance chart, which illustrates how effectively your instance utilizes its cache over time.
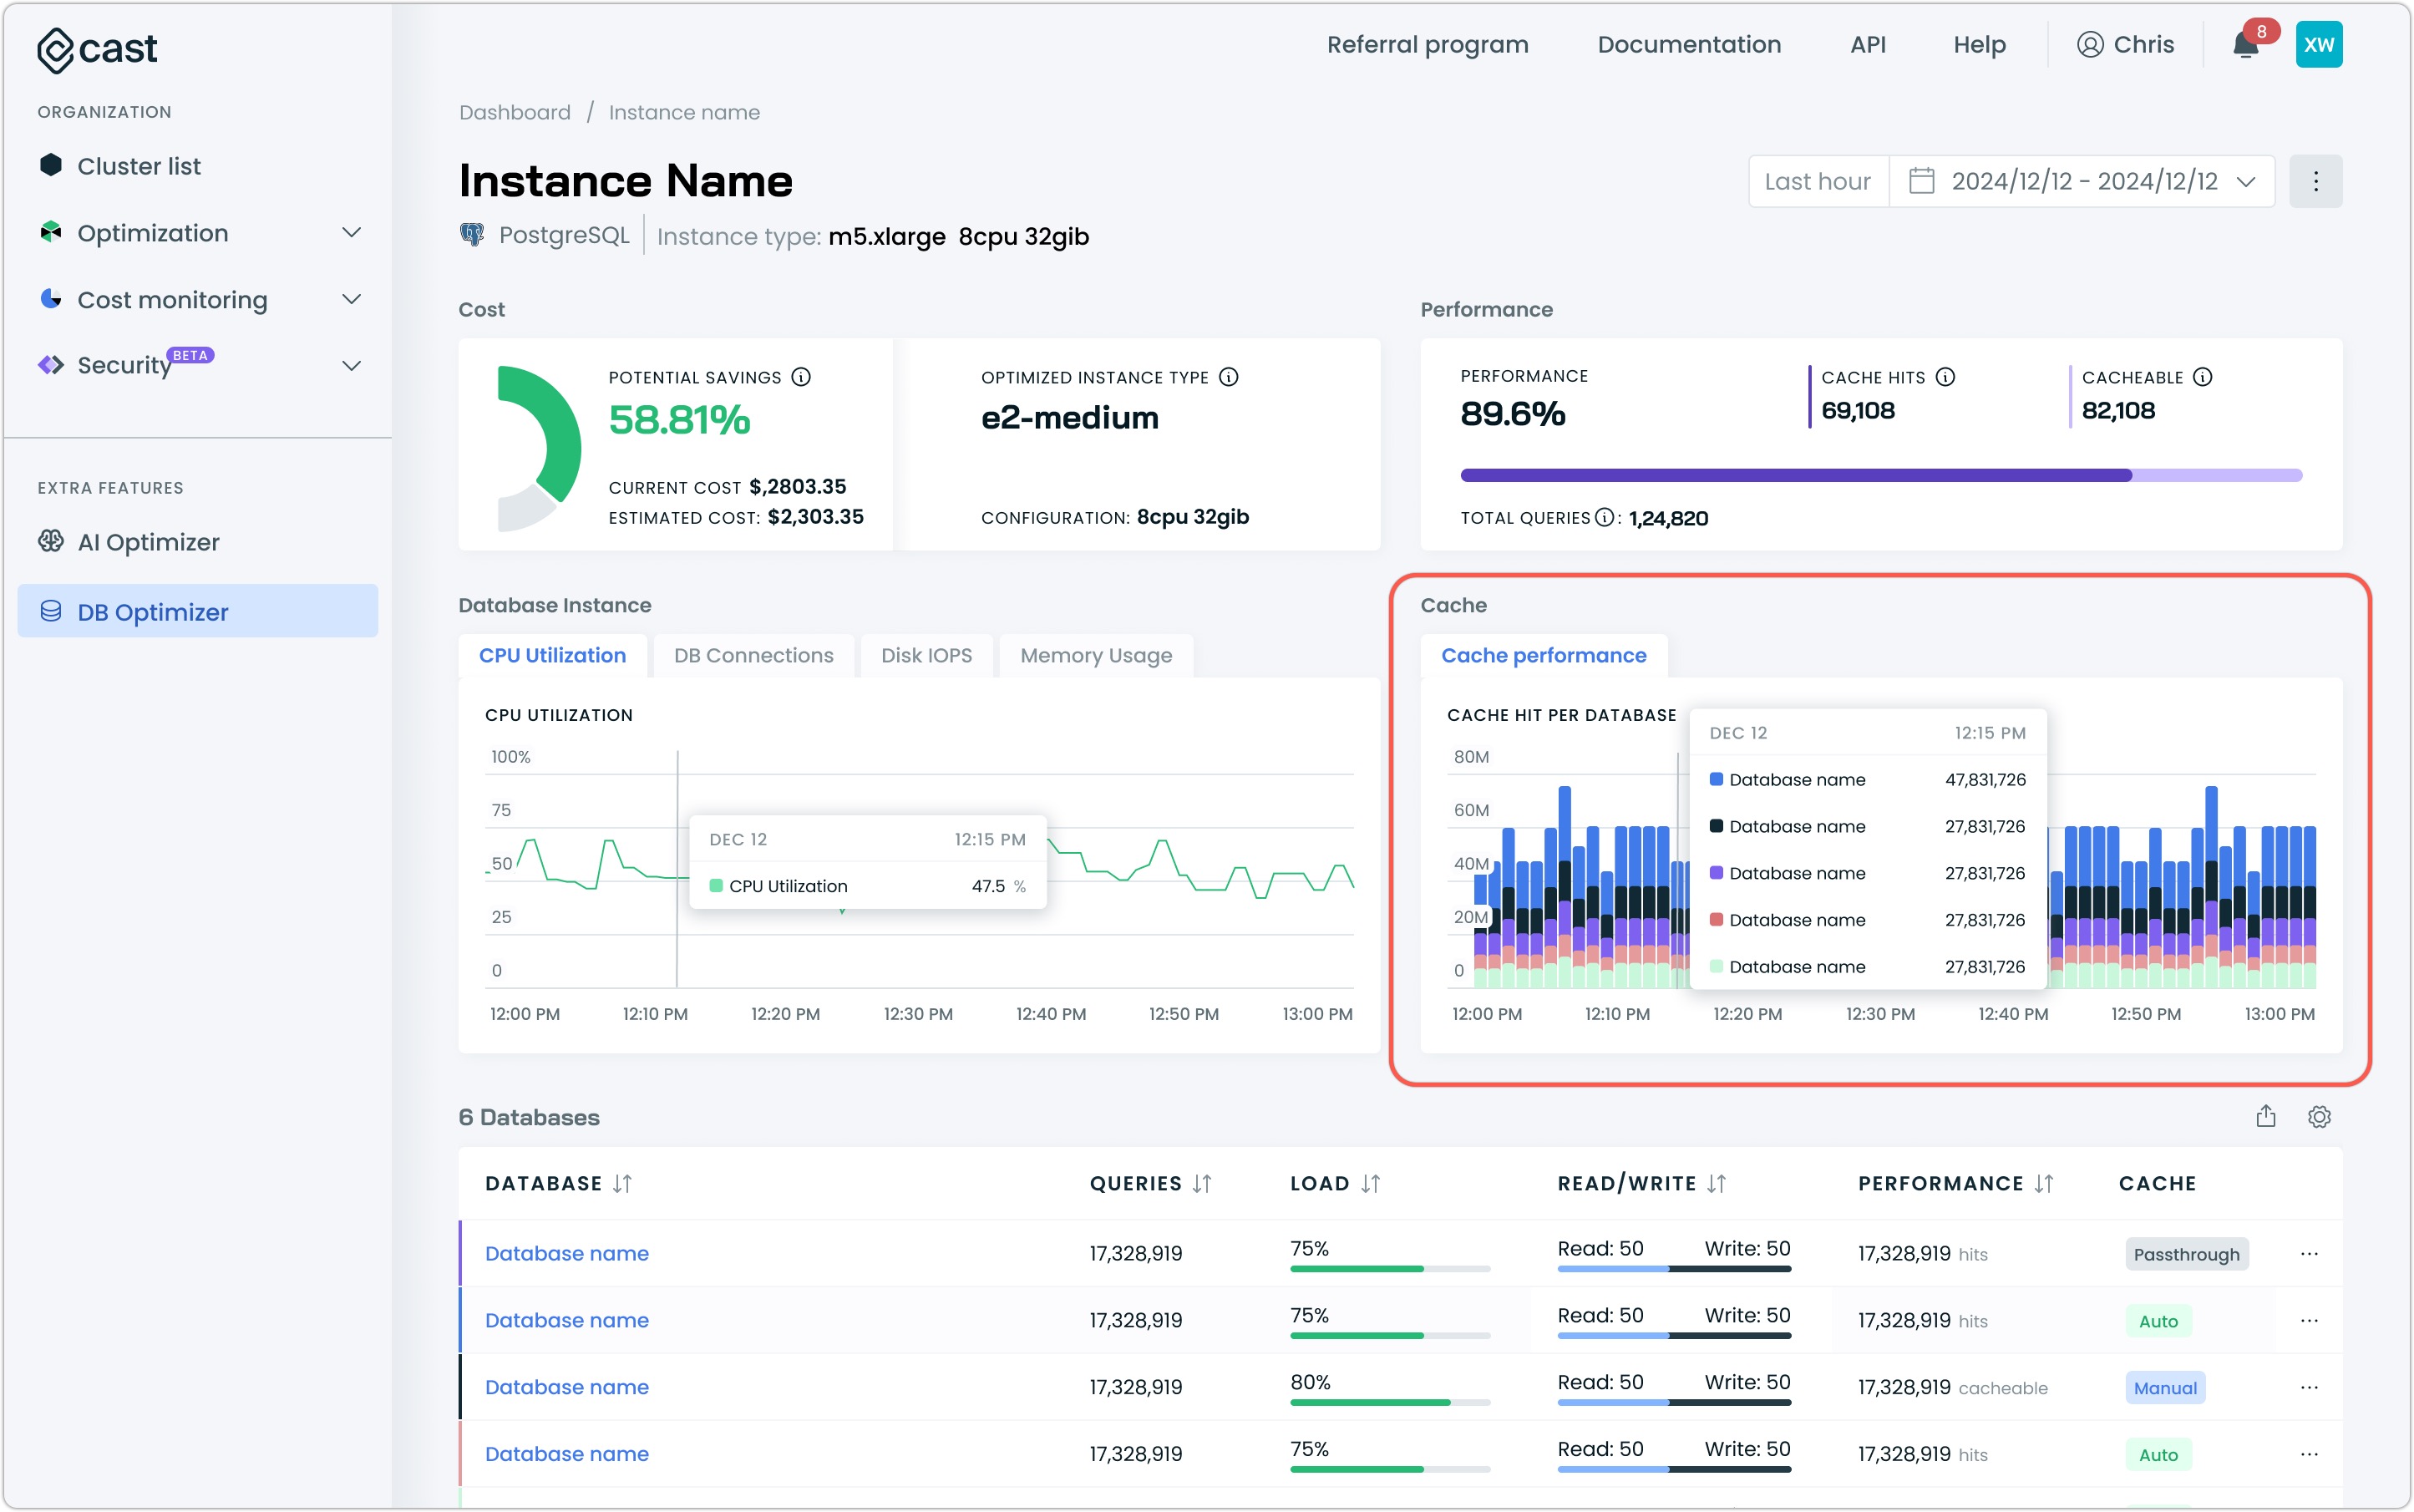
This chart reveals caching efficiency throughout your selected time period, utilizing cache hits per database as the comparison metric. Watching how this metric changes over time helps identify potential issues with cache configuration or usage patterns.
Resource Utilization Metrics for Cloud Databases
For cloud-hosted databases like AWS RDS, the instance view includes additional resource metrics that aren't available for manually connected databases. These metrics provide valuable context about the overall health of your database instance.
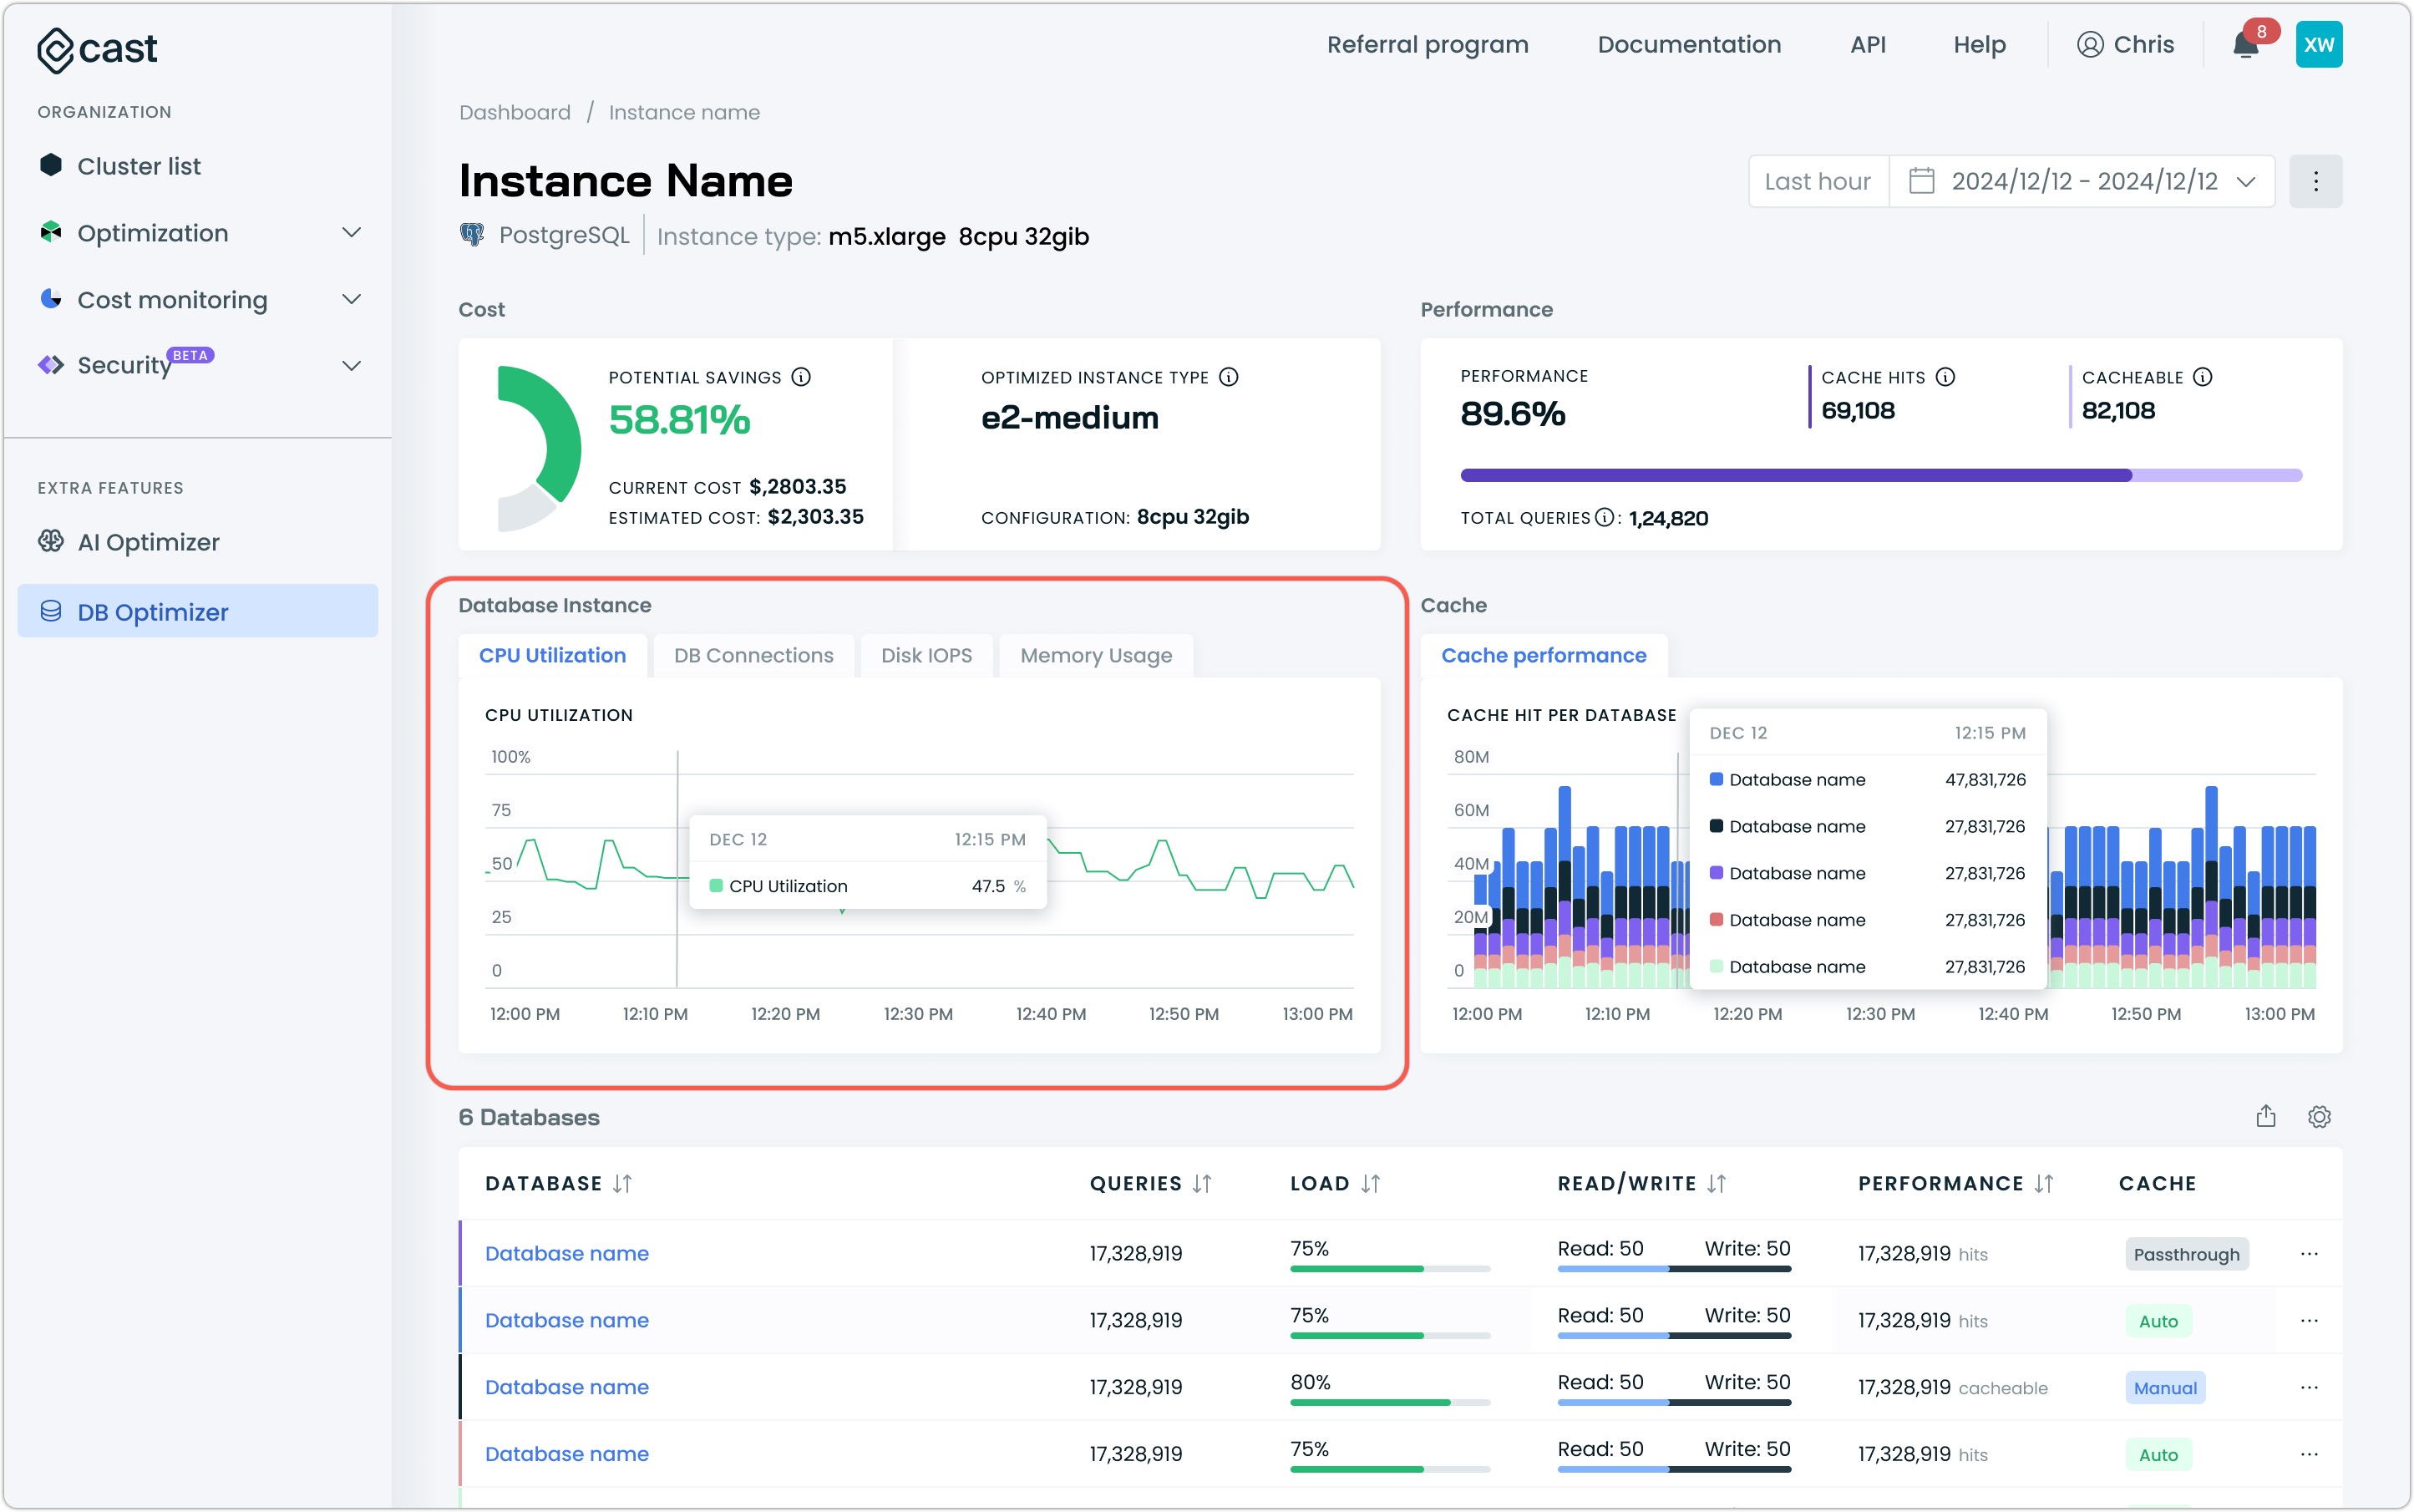
Cloud database instance metrics include:
- CPU Utilization: Shows processor usage over time, helping identify processing bottlenecks
- DB Connections: Displays the number of active connections, useful for capacity planning
- Disk IOPS: Reveals input/output operations per second for storage performance analysis
- Memory Usage: Shows memory consumption patterns for resource optimization
These resource metrics help you understand if performance issues stem from database configuration or resource constraints. For example, high CPU utilization coinciding with low cache hit rates might indicate query optimization opportunities rather than caching issues.
Database-Specific Performance Analysis
While instance-level metrics provide a broad view, database-specific metrics offer deeper insights into individual database performance. The visualizations you'll see depend on whether you're analyzing a manually connected PostgreSQL database or a cloud-hosted database like AWS RDS.
PostgreSQL Manual Database Metrics
For manually connected PostgreSQL databases, the metrics focus primarily on cache performance with the Cache Hit Per Database chart. This visualization shows how effectively your specific database utilizes the cache over time.
The chart displays cache hit trends for your selected timeframe, helping you identify when caching is working well and when it might need adjustment. While simpler than the metrics available for cloud databases, this visualization still provides valuable insights into cache efficiency.
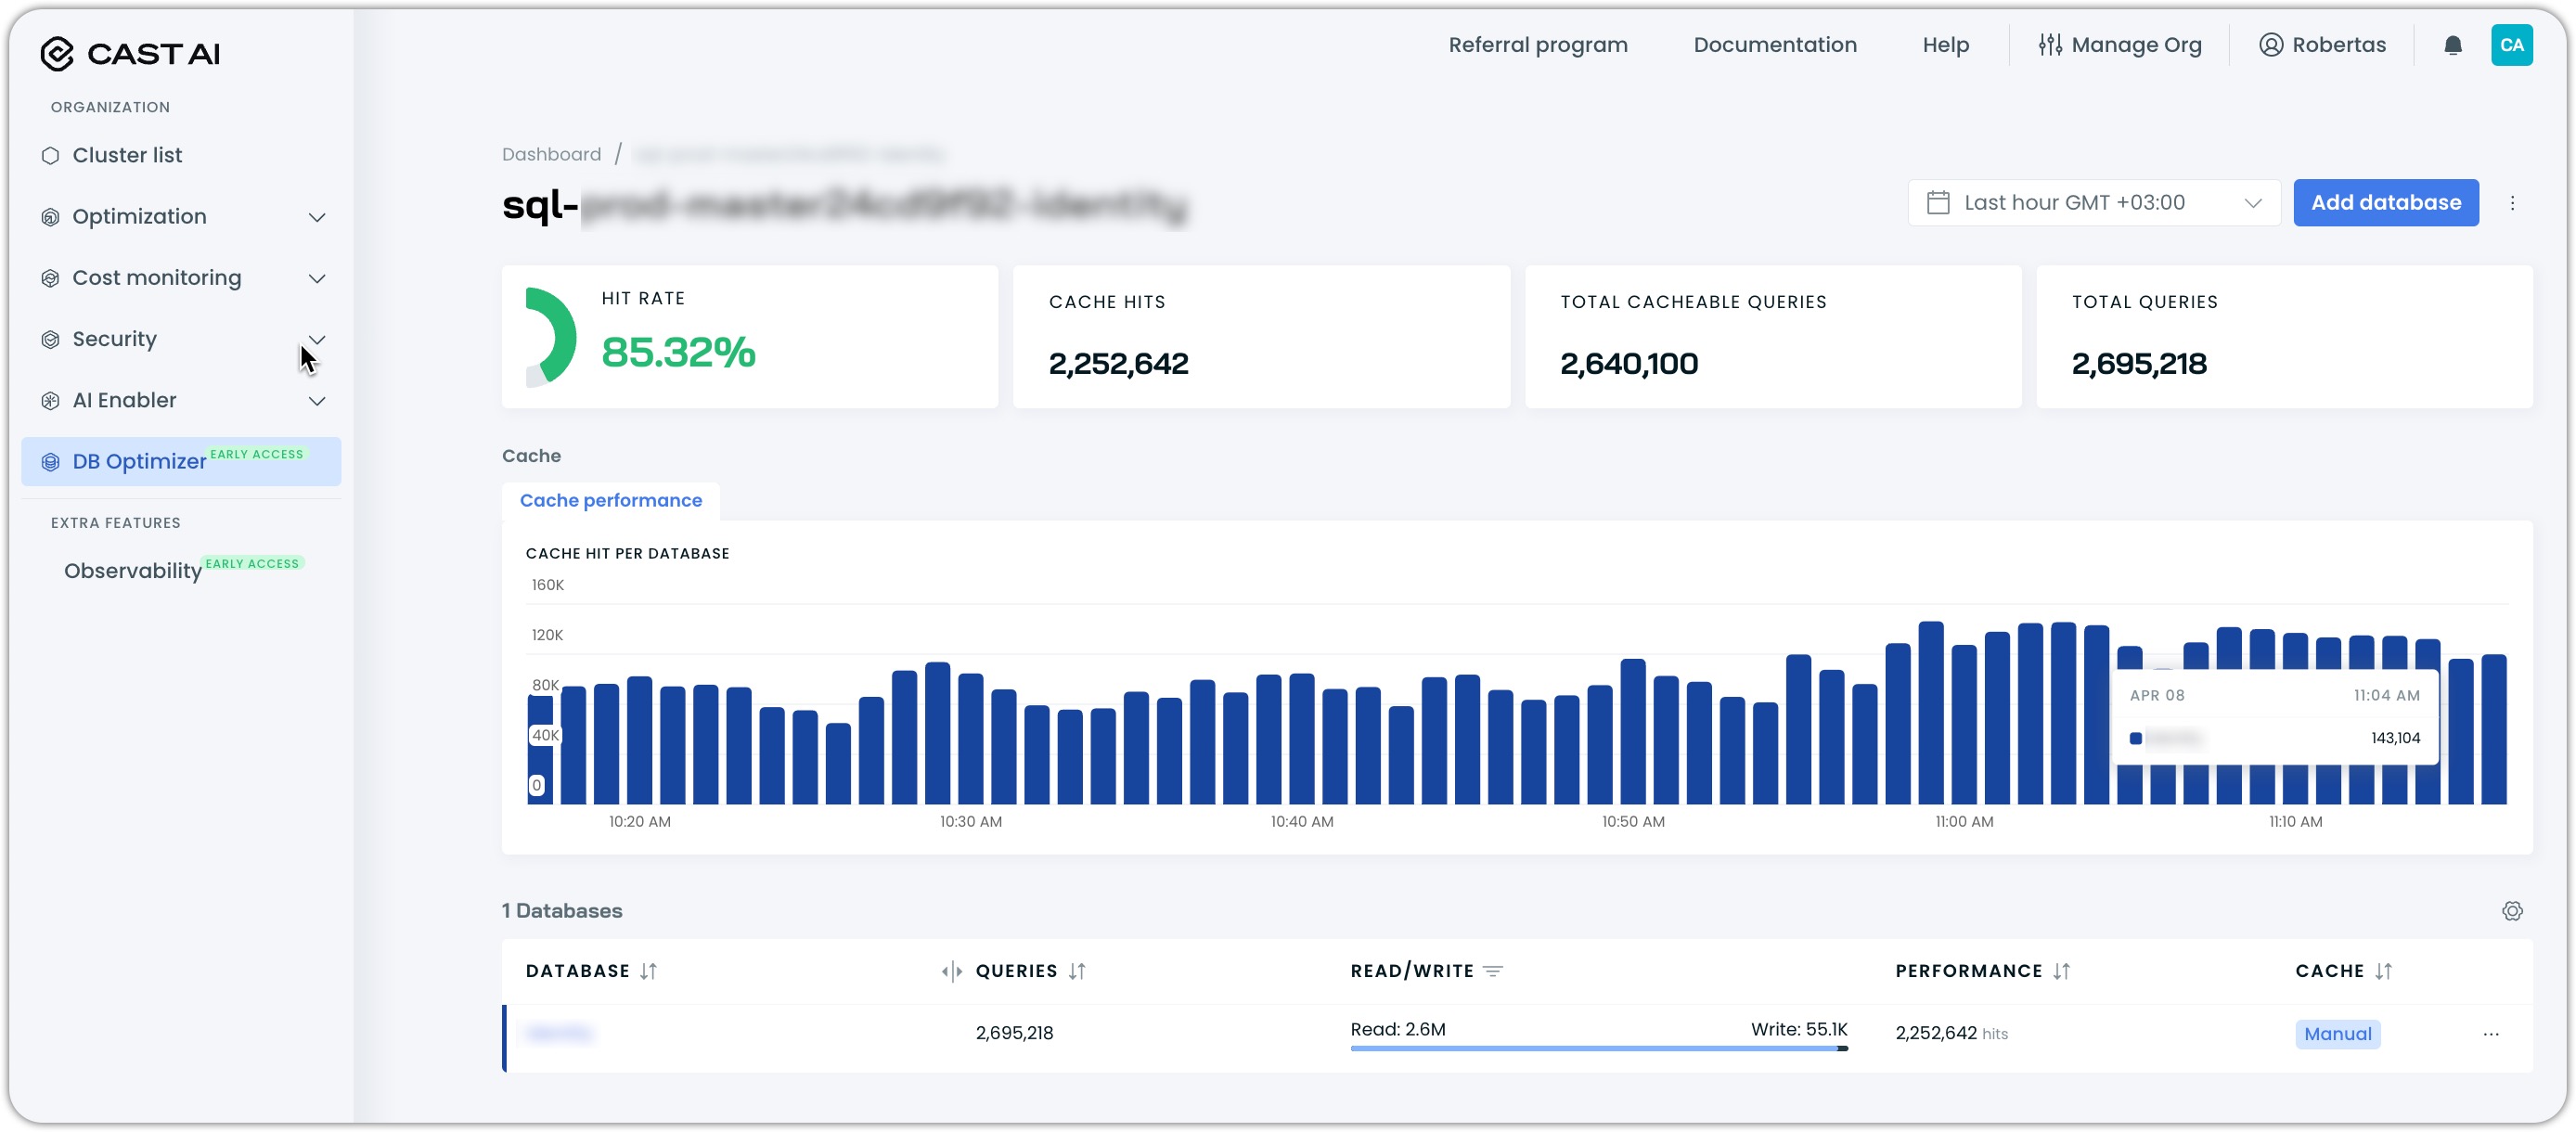
Comprehensive Cloud Database Metrics
Cloud-hosted databases like AWS RDS offer a richer set of performance visualizations. These include detailed query distribution charts and query-specific metrics that provide deeper insights into database behavior.
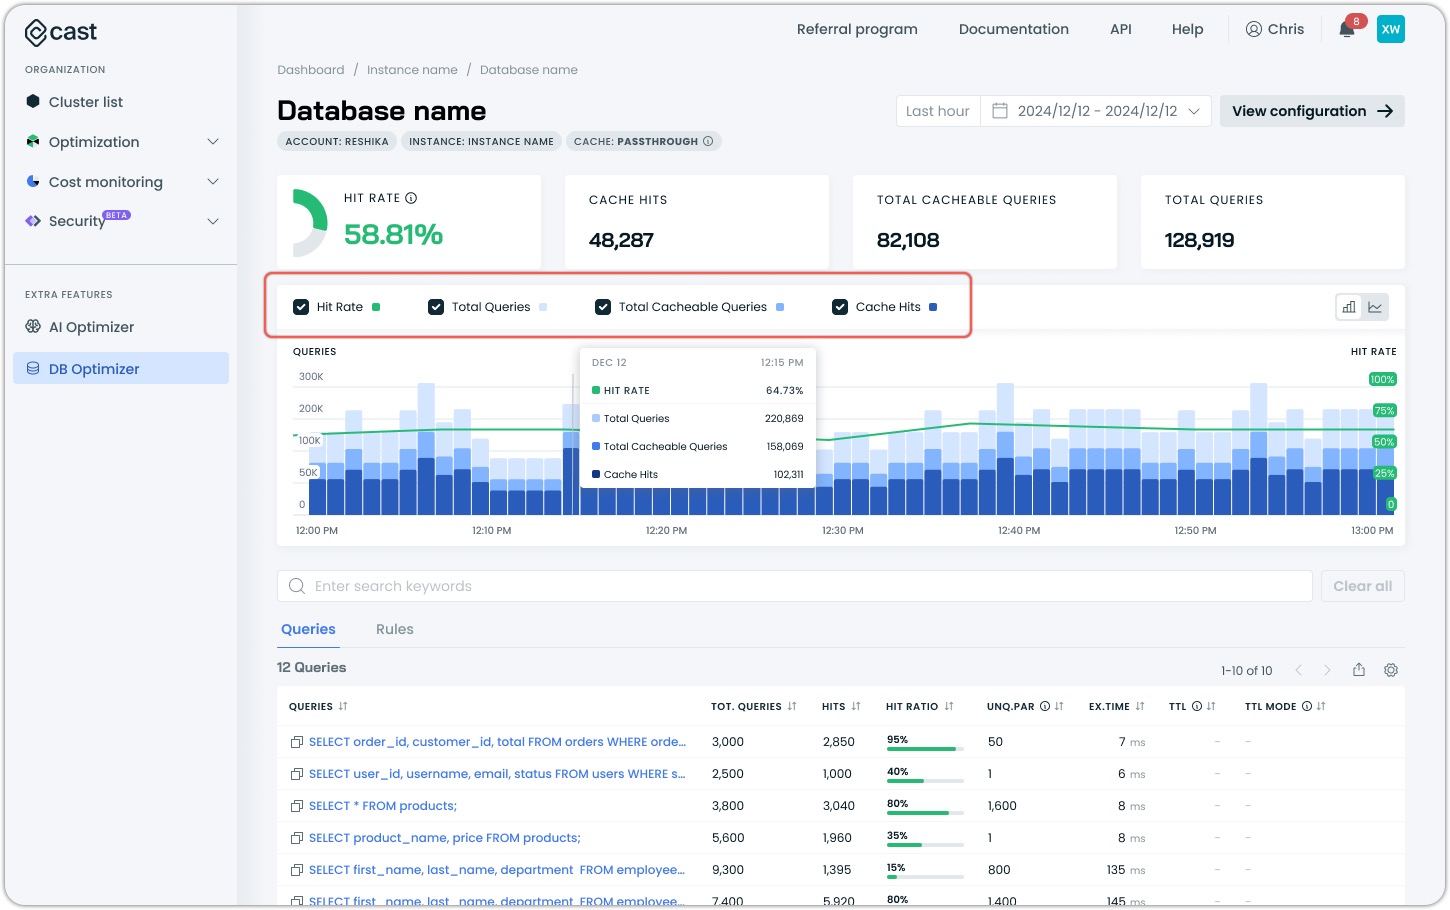
Key metrics for cloud databases include:
- Hit Rate Performance: Shows the percentage of queries served from the cache over time
- Total Queries: Displays the breakdown of total queries
- Cache Hits: The number of queries successfully served from the cache
- Total Cacheable Queries: The number of queries eligible for caching
- Hit Rate: The percentage of queries served from the cache rather than from the database
The query list below the chart provides detailed information about specific queries running in your database, showing execution times, cache hit ratios, and response times for individual queries.
You can sort this list by different metrics to identify problem areas, such as frequently executed queries with low hit ratios or queries with long execution times that would benefit most from effective caching.
Making Sense of Performance Data
Having access to performance data is only valuable if you can interpret what it's telling you. When analyzing your database metrics, look for these key patterns and signals:
Understanding Cache Efficiency Trends
A healthy database typically shows consistent cache hit rates with predictable patterns. When you notice a sudden drop in cache hit rates, it often indicates a change in query patterns, data modifications invalidating cached results, or application changes affecting how queries are constructed.
For example, if you see cache hit rates consistently drop during certain hours of the day, it might indicate that you generate new queries or update data in ways that invalidate the cache. By examining the specific time periods with lower hit rates, you can often identify the cause and adjust your caching strategy accordingly.
Analyzing Query Patterns
For cloud databases, the query distribution chart reveals important insights about how your database is being used. Common patterns to watch for include:
- Times when total queries increase but cache hits remain stable (indicating new workloads)
- Periods where cacheable queries and actual cache hits diverge (suggesting optimization opportunities)
- Regular patterns that align with business hours or application usage cycles (helping with capacity planning)
Query-Level Optimization Opportunities
The detailed query list provides actionable insights at the individual query level. Focus your optimization efforts on:
- Queries with high execution counts but low hit ratios (high-impact optimization targets)
- Queries with long execution times (resource-intensive operations that benefit most from caching)
- Frequently executed queries that aren't being cached (potential configuration issues)
By addressing these high-impact queries first, you can achieve significant performance improvements with minimal effort.
Applying Performance Insights to Database Optimization
Performance data becomes truly valuable when used to drive optimization decisions. The time range you choose influences the type of optimization you might consider.
Addressing Immediate Issues
When analyzing hourly or daily data, focus on identifying and addressing immediate issues:
- Investigate sudden drops in hit rates or spikes in query volume
- Check for recent deployments or configuration changes that might explain performance shifts
- Make adjustments to address immediate concerns, such as optimizing problematic queries
Planning Long-term Optimizations
Weekly data helps with longer-term decisions:
- Identify consistent patterns in database usage across different days of the week
- Plan for capacity based on peak usage periods and regular cycles
Compare current performance with historical data to measure the impact of previous optimizations. This helps you refine your approach and focus efforts where they'll have the greatest impact.
Continuous Performance Monitoring
Database optimization is an ongoing process. To get the most from Cast AI's DBO performance metrics:
- Regularly review performance across different time ranges to build a comprehensive understanding of your database's behavior
- Compare metrics before and after making configuration changes to measure their impact
- Use custom date ranges to analyze performance during specific events or marketing campaigns
By consistently leveraging Cast AI's DBO visualization tools, you can make informed decisions about database optimization, ultimately improving application performance and reducing costs.