
AWS RDS & Aurora quick start
This guide walks you through setting up Cast AI DB Optimizer (DBO) for AWS RDS and Aurora databases using the auto-discovery feature. This approach automatically discovers your databases and provides performance insights specific to AWS managed services.
Overview
Cast AI DB Optimizer for AWS provides:
- Automatic database discovery - Finds all RDS and Aurora instances in your AWS account
- Performance insights integration - Leverages AWS Performance Insights data when available
- Cost analysis - Shows potential savings based on actual database usage
- Two-phase deployment - Safe monitoring before enabling active caching
Like the manual setup, DBO operates in two phases:
Phase 1: Passthrough Mode
- Monitor database traffic without interference
- View AWS-specific performance metrics
- Analyze cost-saving opportunities
- Zero risk to production
Phase 2: Active Caching
- Enable intelligent caching
- Realize performance improvements
- Reduce database load and costs
Prerequisites
Before beginning:
- Access to an AWS account with RDS/Aurora instances
- AWS CLI access or the ability to run scripts in AWS CloudShell
- Kubernetes cluster for deploying DBO components
- (Optional) Appropriate AWS permissions for Performance Insights (see Access requirements)
Phase 1: Auto-Discovery and Setup
Step 1: Navigate to Databases
- Log in to the Cast AI console.
- Navigate to DB Optimizer → Databases in the left sidebar.
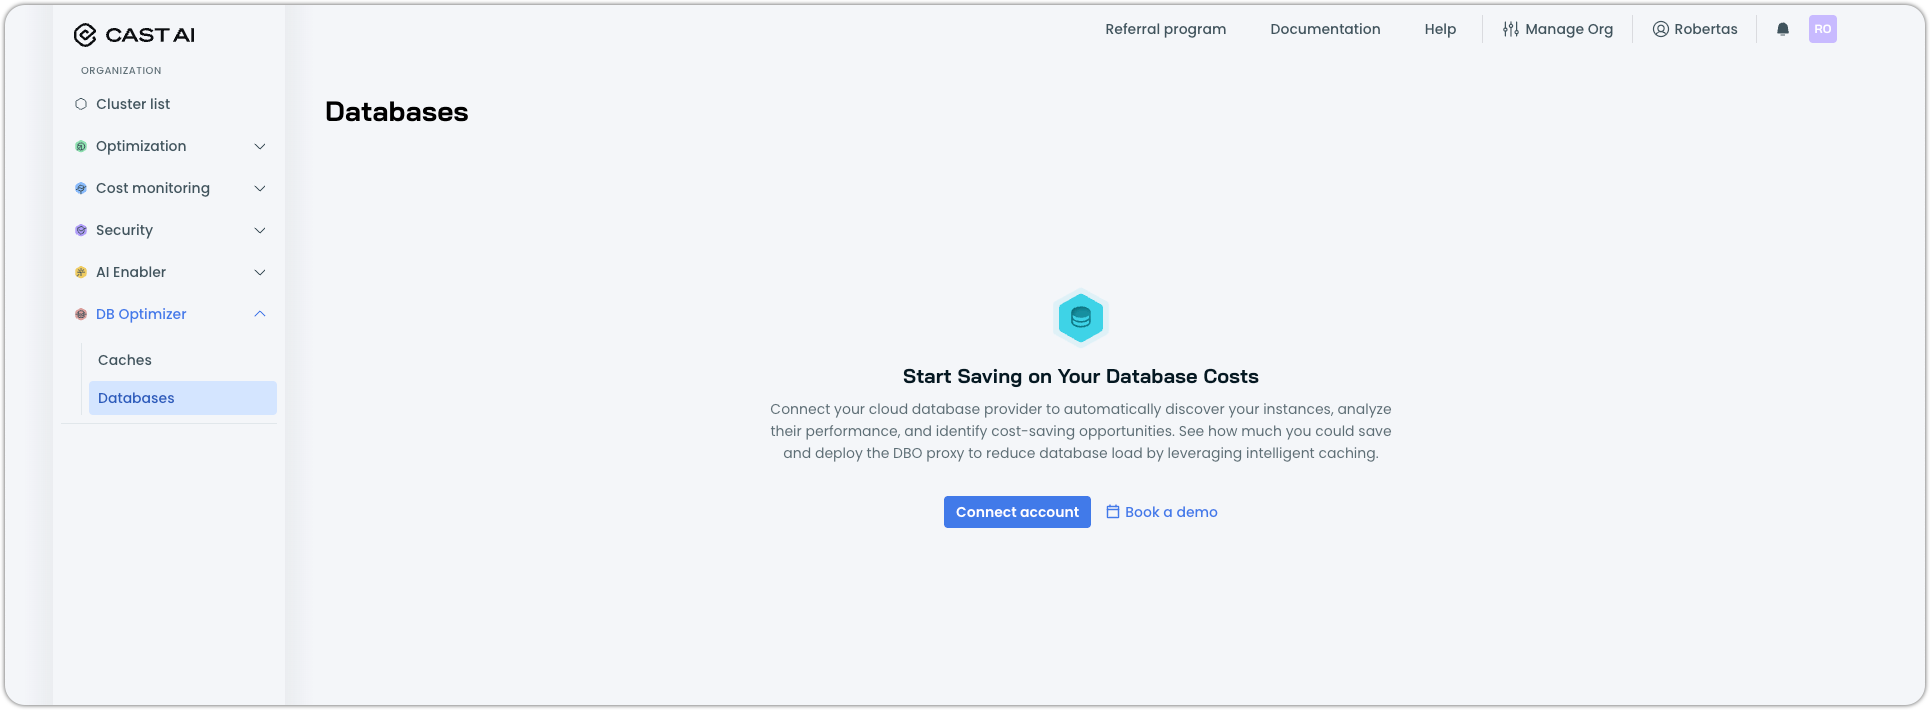
Step 2: Connect Your AWS Account
Click Connect account to begin the AWS integration process.
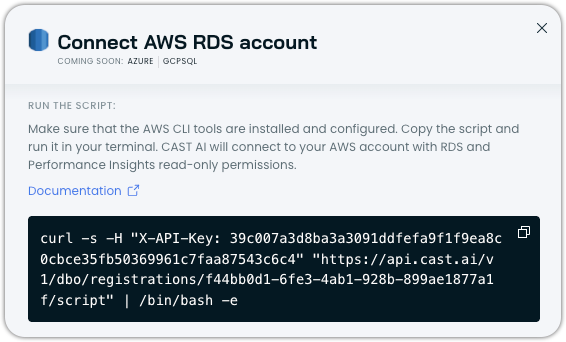
- Copy the provided script from the modal.
- Run the script in one of these environments:
- AWS CloudShell (recommended)
- Local terminal with AWS CLI configured
The script will:
- Create an IAM role with the necessary read-only permissions
- Establish a trust relationship with Cast AI
- Connect to your AWS account with read-only access
- Enable access to RDS and Performance Insights data
Step 3: Deploy Cache to Your Database
After running the script, DBO will automatically discover your AWS databases:
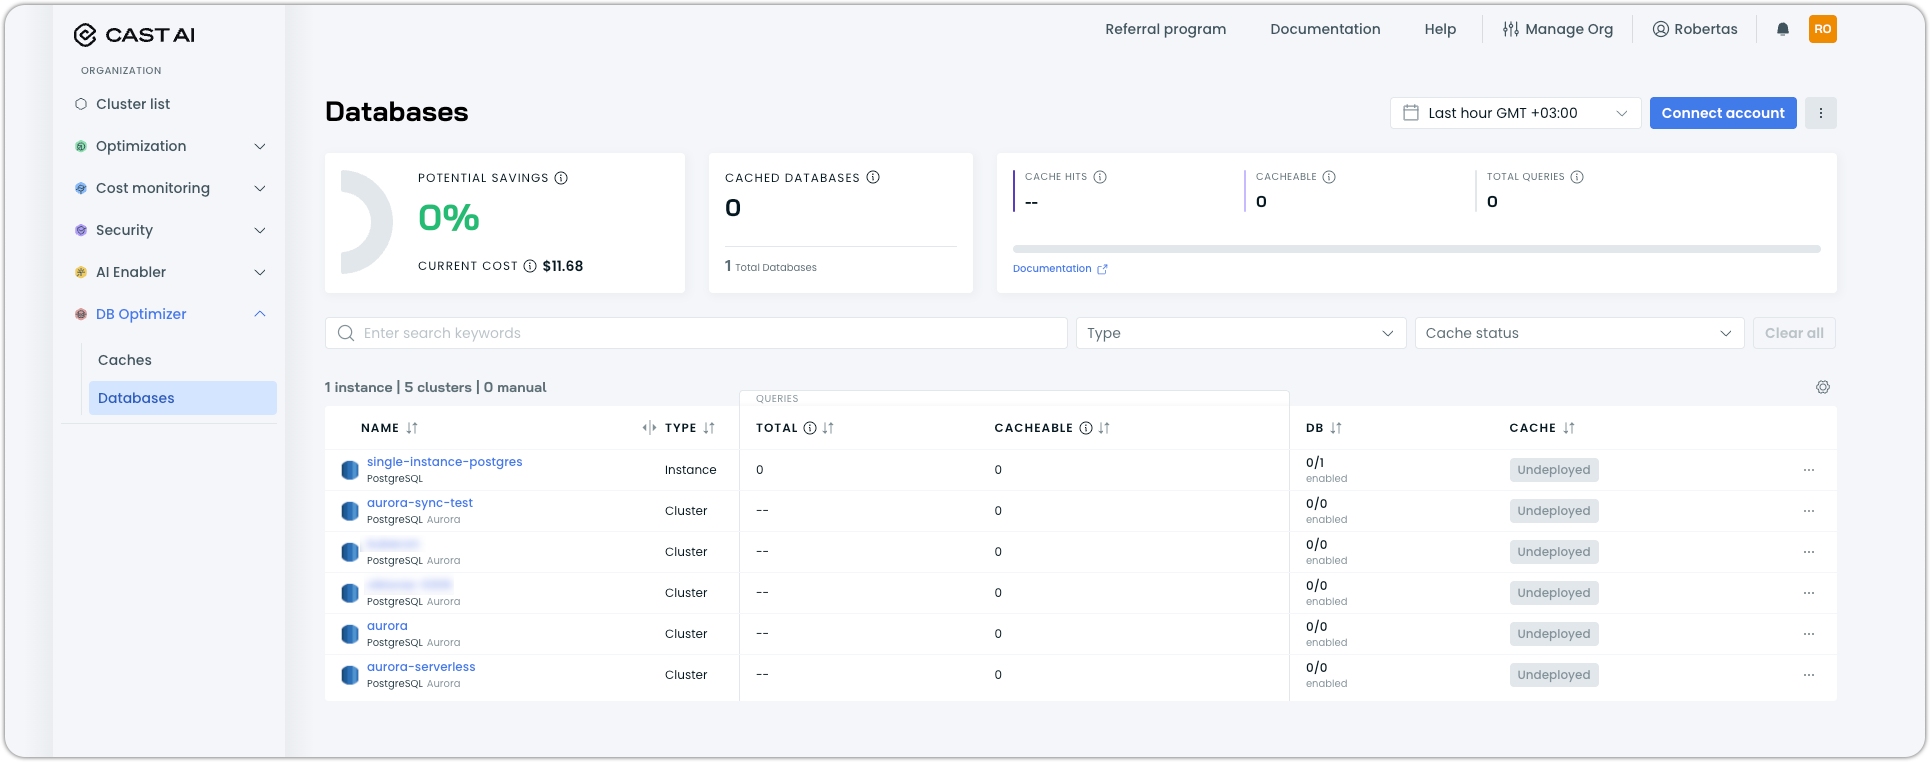
The discovered instances will show:
- Instance names and types (RDS instance, Aurora cluster)
- Database count per instance
- Cache status (initially "Undeployed")
To deploy DBO:
- Click on an instance to view detailed information
- Click Deploy cache button on the instance details page.
- Copy the deployment script provided and run it in your Kubernetes cluster environment.
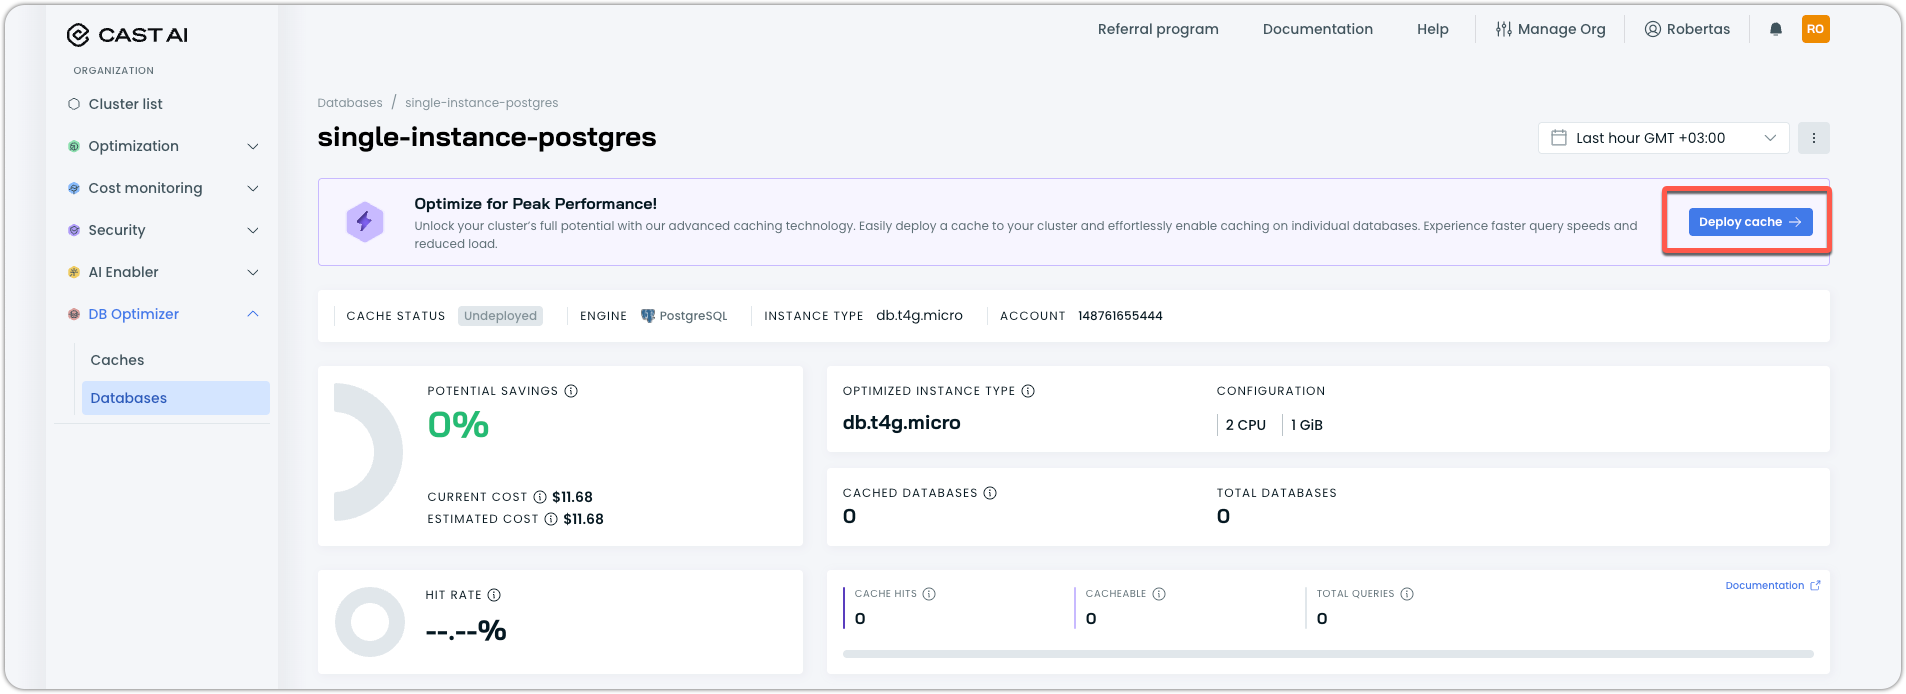
The script will deploy the configured DBO cache into your cluster, in the castai-db-optimizer namespace.
Step 4: Update Application Connection Strings
To start monitoring traffic through DBO:
- Click on a specific database within your instance.
- Locate the connection string in the details drawer.
- Update your application to use the DBO connection string:
- Replace the RDS/Aurora endpoints with the appropriate DBO endpoints
- Keep all other connection parameters the same
For detailed connection instructions, see Connecting client applications.
Step 6: Verify Traffic Flow
After updating connection strings, verify that traffic is flowing through DBO
You should see:
- Query counts increasing
- Cacheable queries being identified
- Performance metrics updating
Phase 2: Enabling Active Caching
Once you're comfortable with the passthrough metrics and potential benefits. The steps to enable caching and configure TTL rules are exactly the same between manual caches and RDS instances/Aurora clusters. For more guidance on those steps, see Manual configuration quick start.
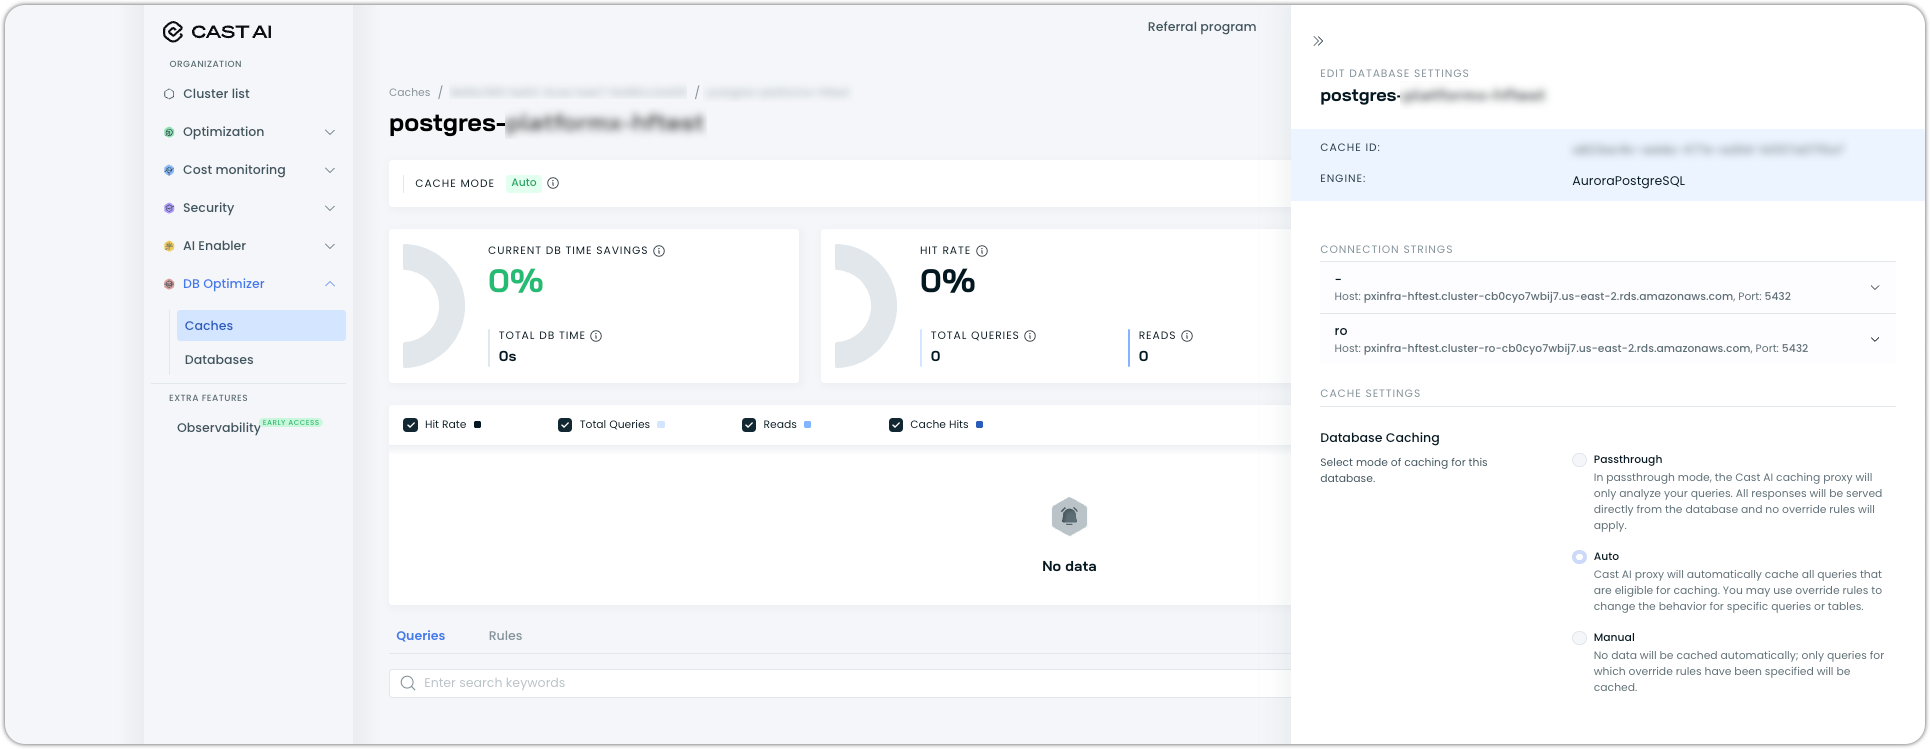
Step 1: Access Database Settings
- Navigate to your database in the Databases list.
- Click on the specific database name.
- Locate the Database Caching section in the details panel.
Step 2: Select Caching Mode
Choose your preferred caching mode:
Auto Mode (Recommended)
- AI-driven caching that automatically optimizes all queries
- No configuration required
- Continuously adapts to your workload patterns
Manual Mode
- Full control over what gets cached
- Only caches queries per specific rules
Step 3: Monitor Active Performance
With caching enabled, monitor the improvements.
Key metrics to watch:
- Hit rate - Percentage of queries served from cache
- Cost savings - Actual vs. estimated savings
- Database load - Reduction in database CPU/connections
Next Steps
- Review performance metrics to optimize your cache configuration.
- Set up application failover for high availability.