
Getting started
Get started with Cast AI's database optimization.
This guide will walk you through setting up Cast AI DB Optimizer (DBO) for your database. DBO uses a two-phase approach that allows you to safely monitor your database traffic on the Cast platform before enabling active caching.
Overview
Cast DBO operates in two phases:
Phase 1: Enhanced Passthrough Mode
- Monitor your database traffic without any interference
- Analyze query patterns and view projected caching benefits
- See estimated cache hit rates and potential time savings
- View performance metrics to understand optimization opportunities
- Zero risk to your production environment
Phase 2: Active Caching
- Enable intelligent caching based on your comfort level
- Choose between Auto mode (ML-driven) or Manual mode (full control)
- Realize performance improvements and cost savings
- Continue monitoring with full visibility into cache performance
Choose Your Setup Path
DBO offers two ways to get started.
Option 1: Manual Configuration
Suited for:
- Any PostgreSQL database (self-hosted, cloud-hosted, managed services)
- Custom database deployments
- Non-AWS environments
Continue with Manual Configuration ↓
Option 2: AWS Auto-Discovery
Suited for:
- AWS RDS instances
- AWS Aurora databases
- When you want automatic database discovery
- Simplified setup with performance insights
Manual Configuration Setup
Follow these steps to manually configure DBO for your database.
Phase 1: Setting Up Enhanced Passthrough Mode
Step 1: Create a New Cache
- Log in to the Cast AI console.
- Navigate to DB Optimizer → Caches in the left sidebar.
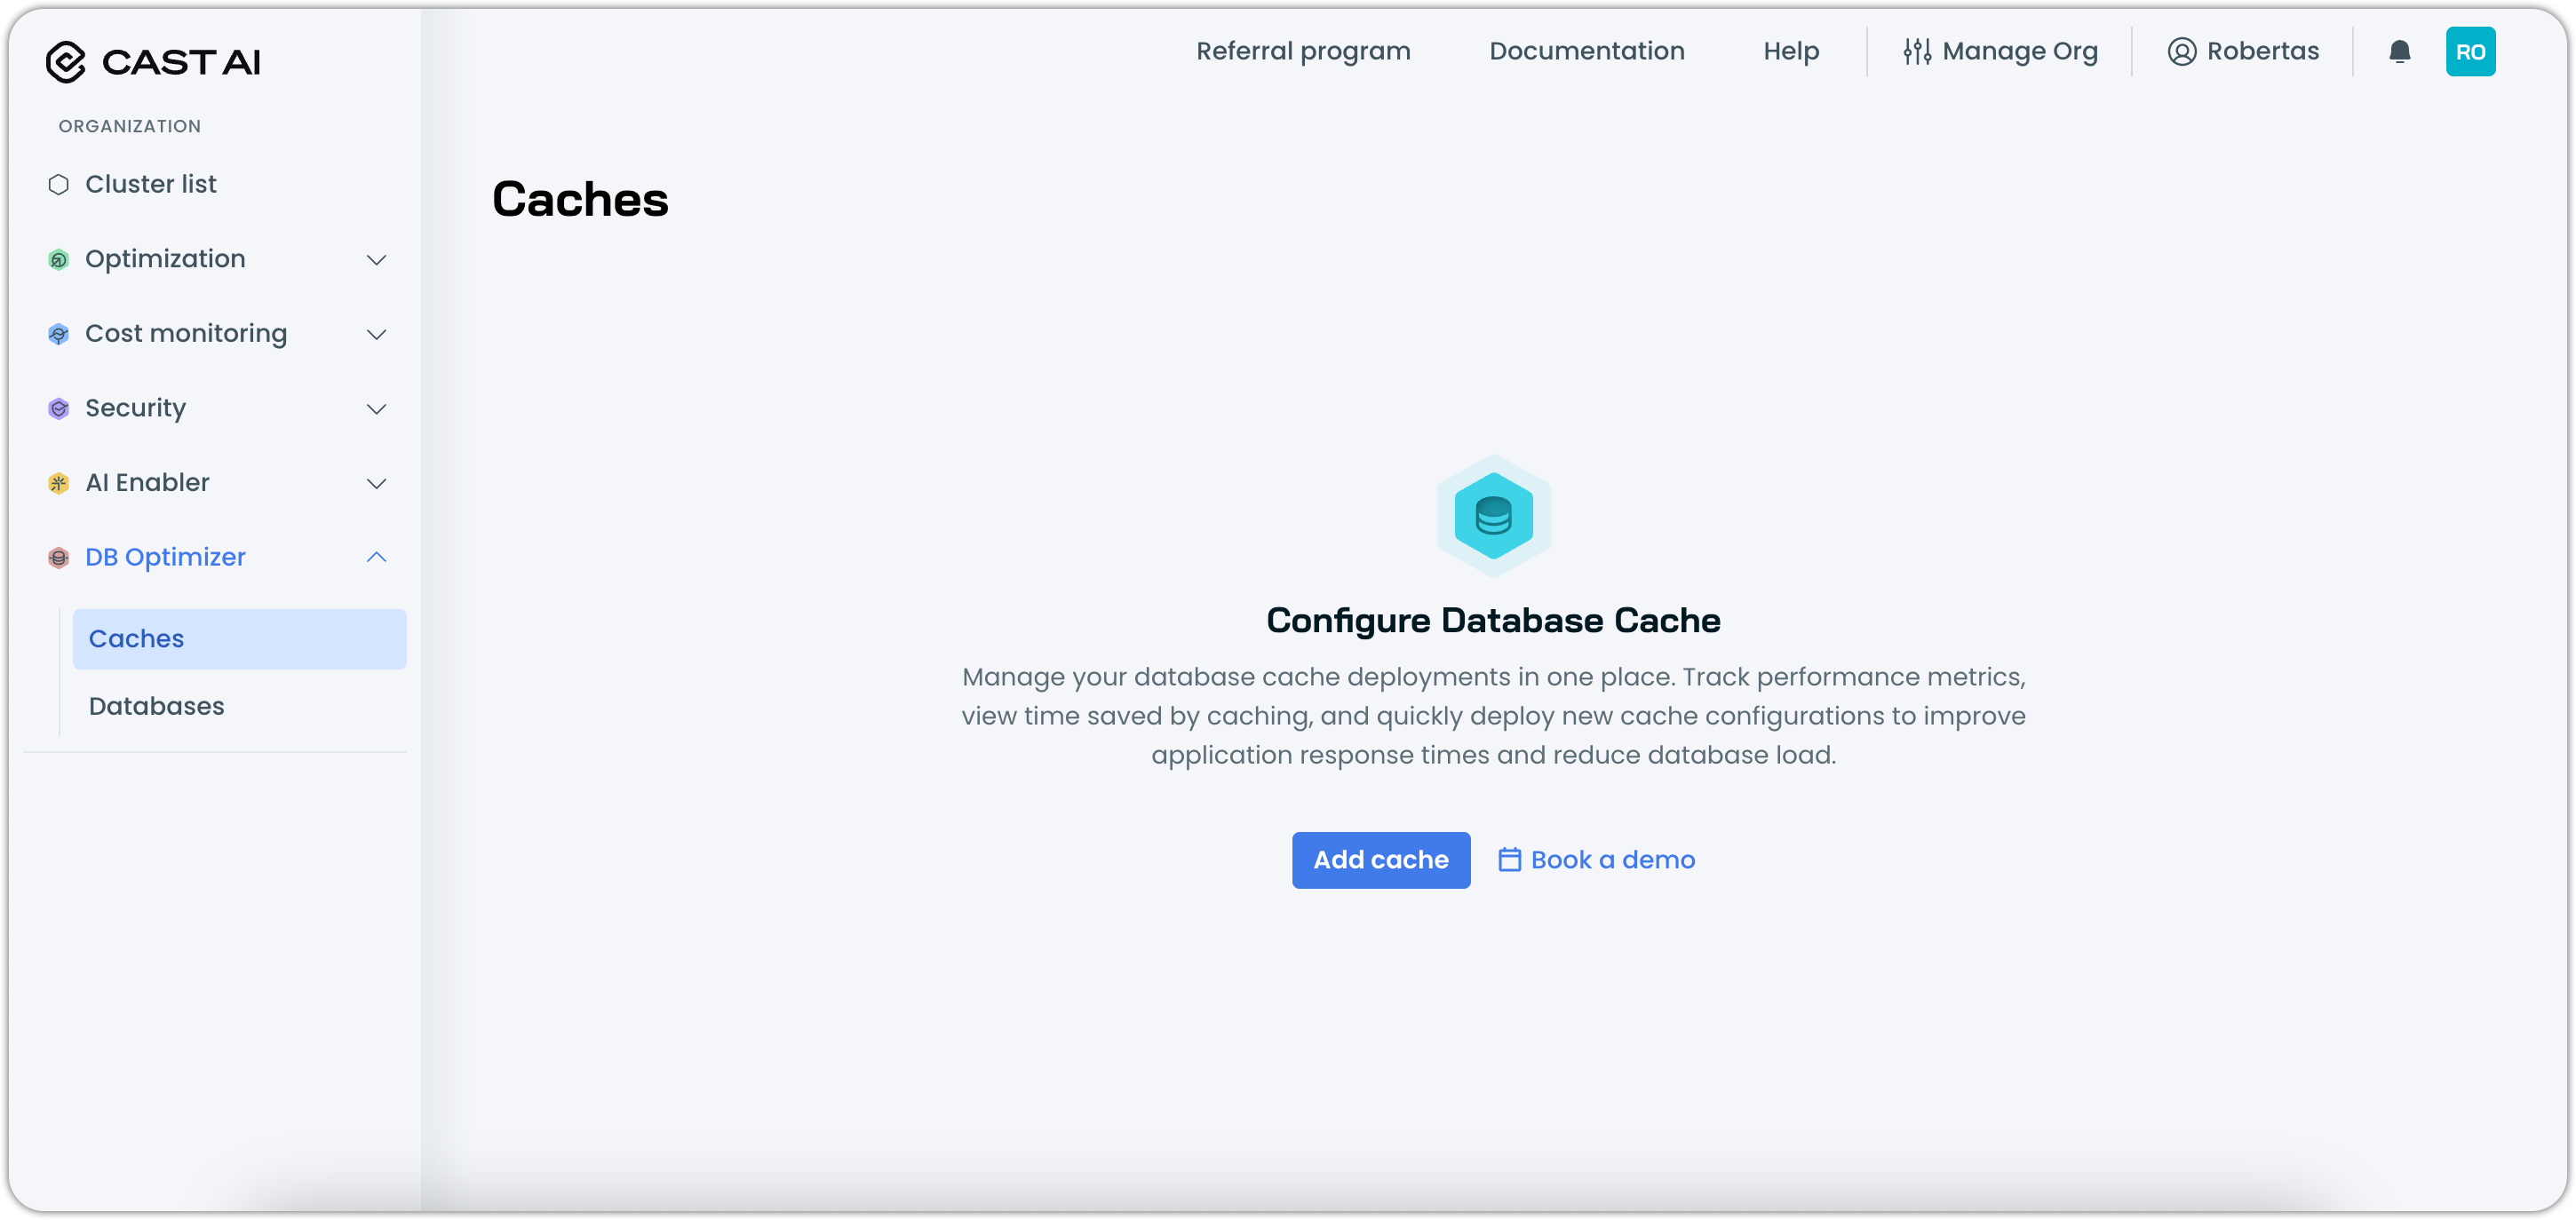
- Click Add cache to begin creating your cache configuration.
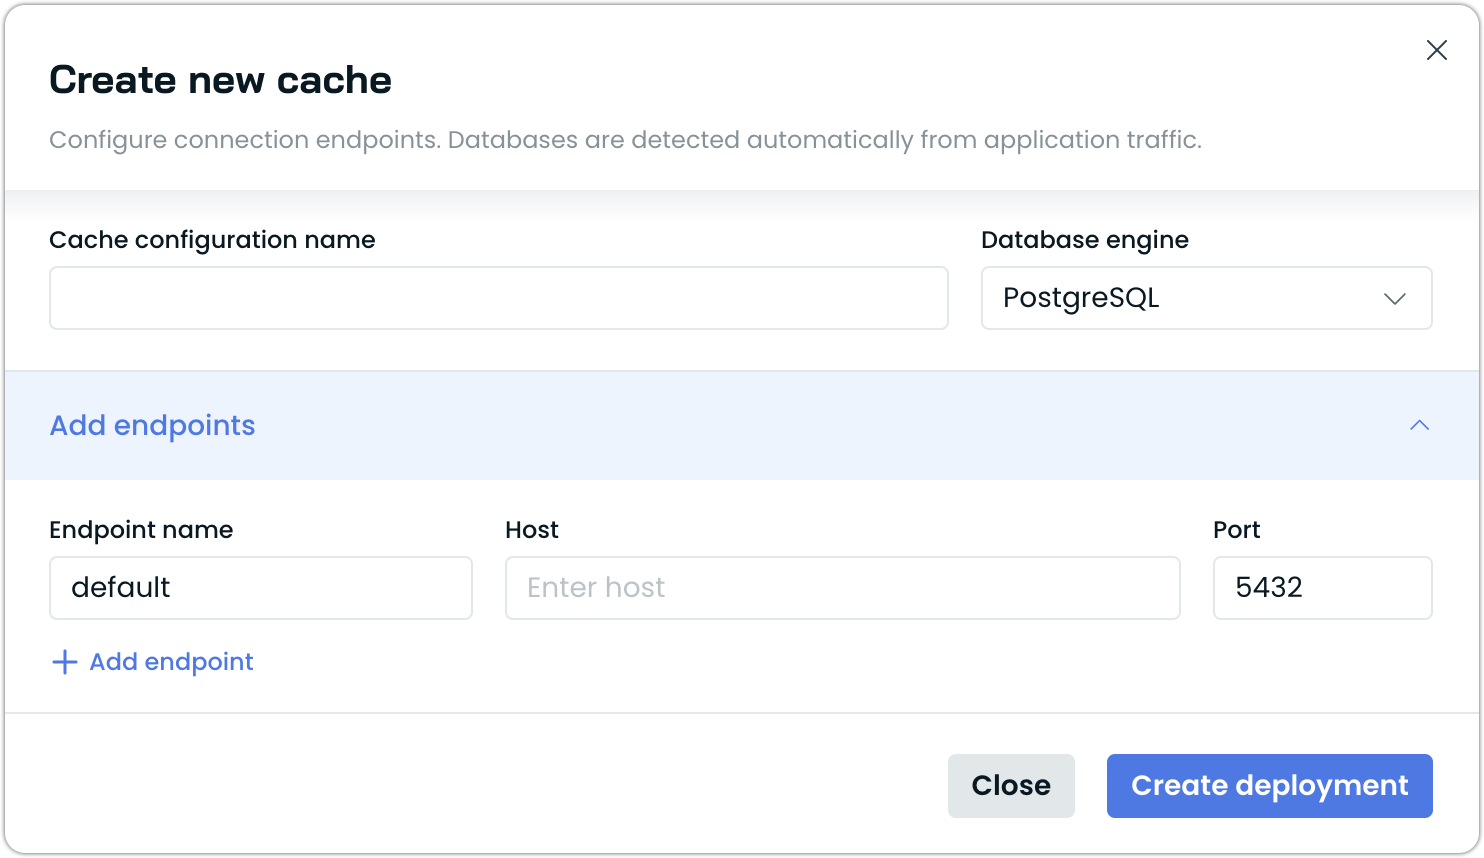
Step 2: Configure Cache Settings
In the cache creation modal, you'll need to provide the following information:
-
Cache configuration name: Enter a descriptive name for your cache configuration within DBO (e.g., "production-db-cache").
-
Database Engine: Select your database type from the dropdown. PostgreSQL and MySQL are supported.
-
Add endpoints: Configure your database connection:
- Host: Enter your database hostname or IP address
- Port: Default is 5432 for PostgreSQL and 3306 for MySQL
- Name: Provide a name for this endpoint
-
Click Create deployment to proceed.
Step 3: Deploy the Cache Components
After creating the cache configuration, you'll be prompted to deploy the DBO components to your Kubernetes cluster:
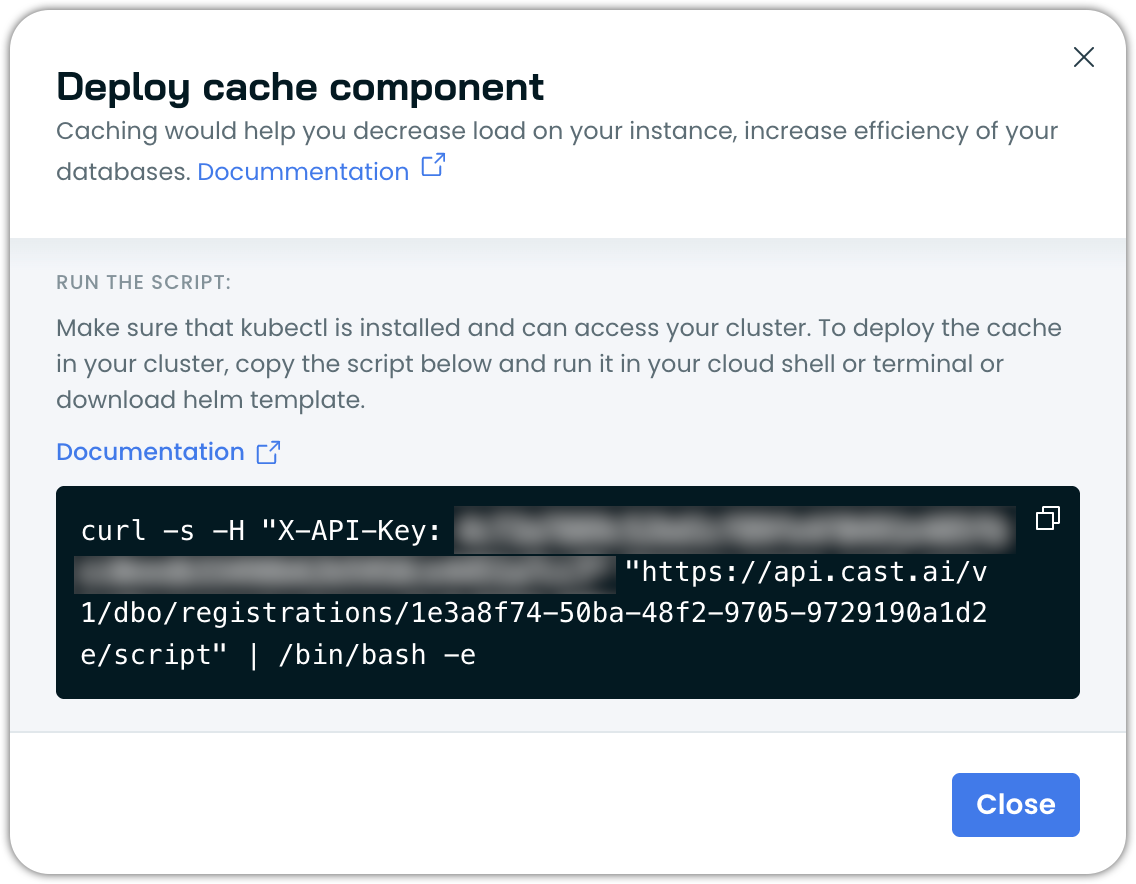
- Copy the provided deployment script.
- Run the script in your Kubernetes cluster's terminal or cloud shell.
- Wait for the deployment to complete (typically takes 1-2 minutes).
The script will deploy the configured DBO cache into your cluster, in the castai-db-optimizer namespace.
Alternative: Terraform deployment
You can also use the Cast AI DBO Terraform module to deploy DBO and manage resources declaratively. This is recommended for infrastructure-as-code workflows and automated deployments.
NoteYou can choose to deploy the cache at a later time by clicking the ⋮ in the cache row and selecting Deploy components. This will generate the same deployment script, which you can run whenever you're ready.
Step 4: Verify Deployment
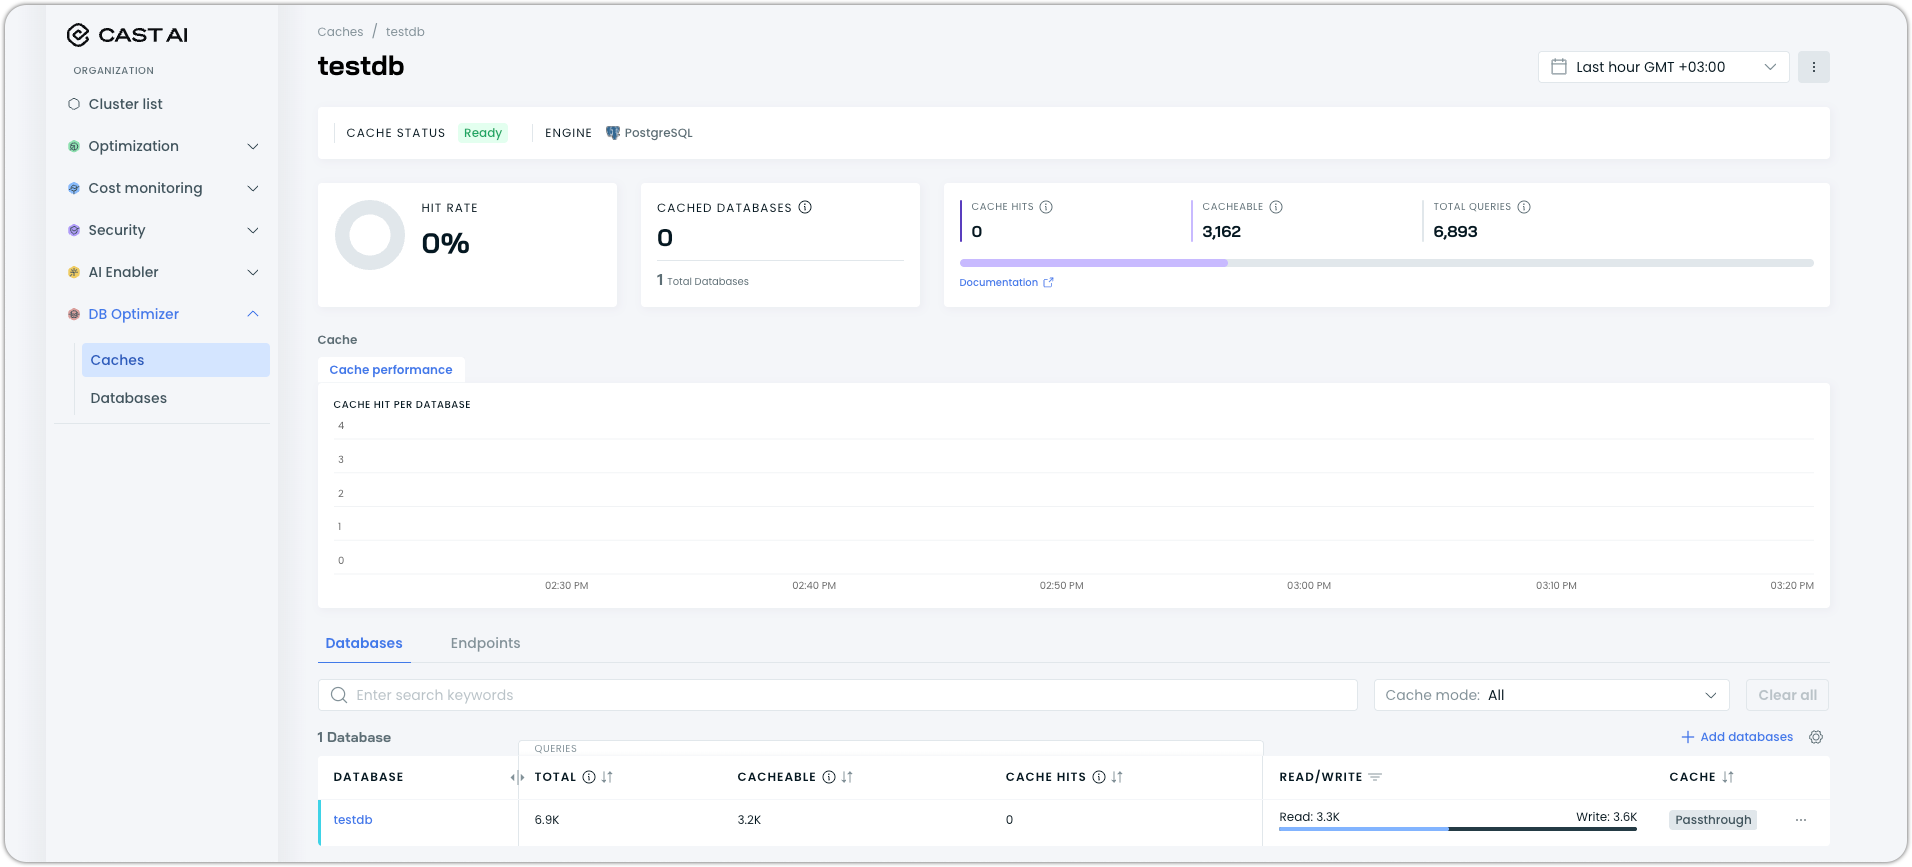
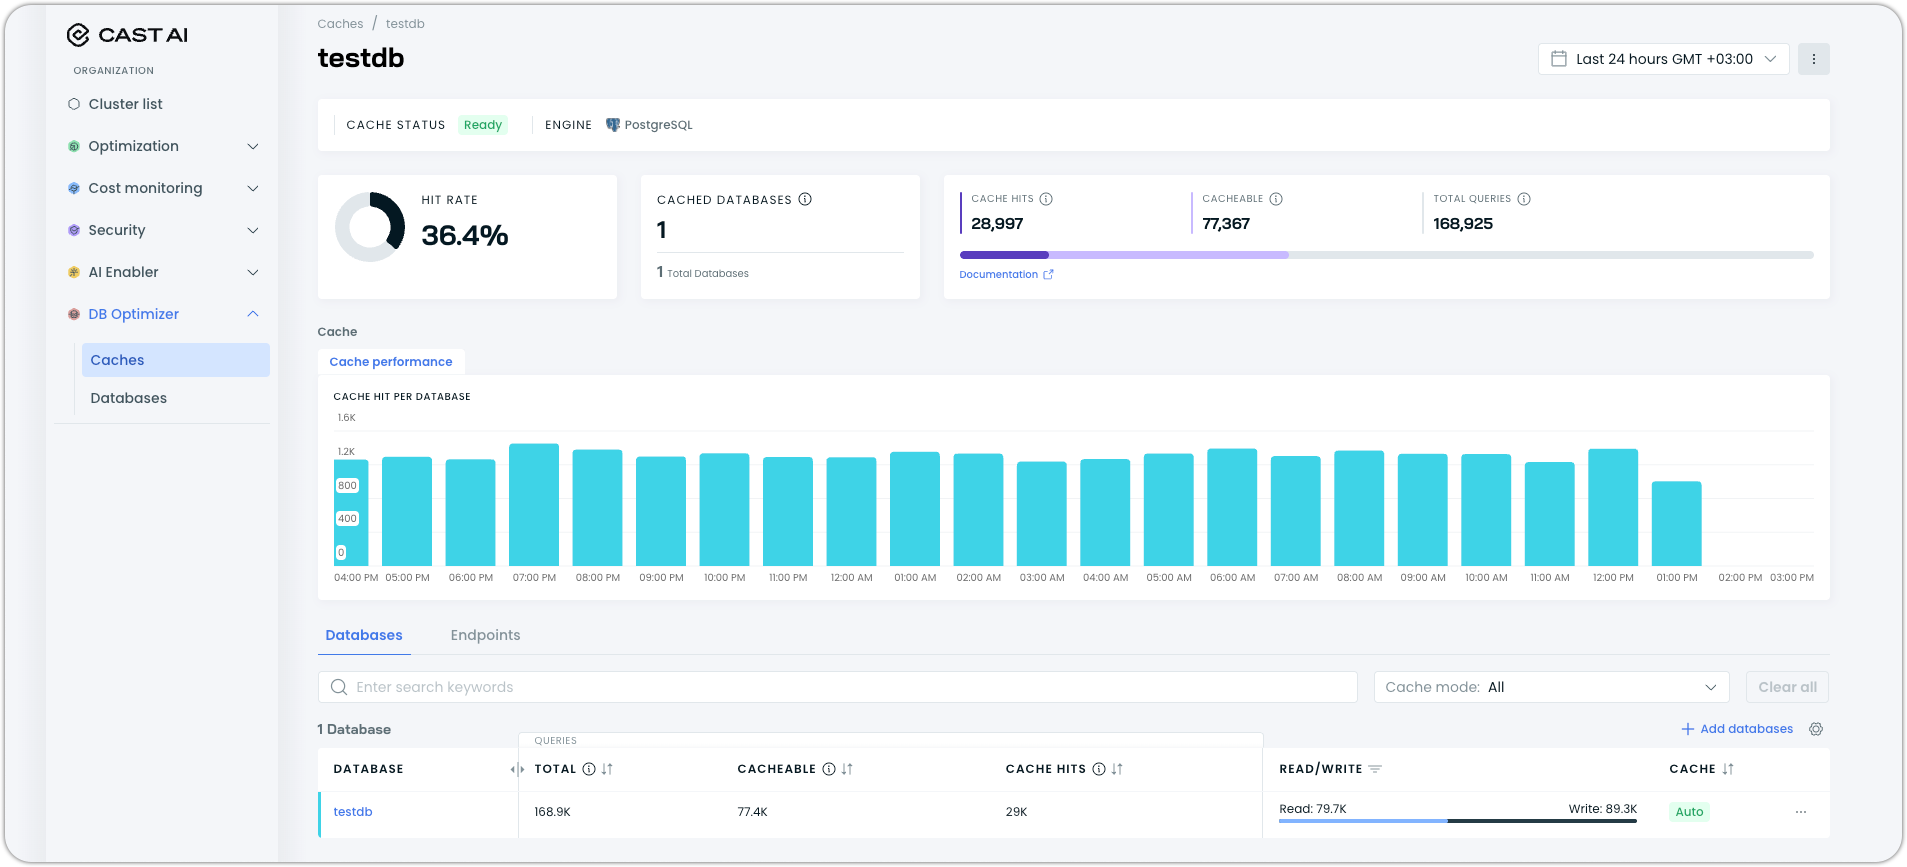
Once deployed, your cache will appear in the Caches list:
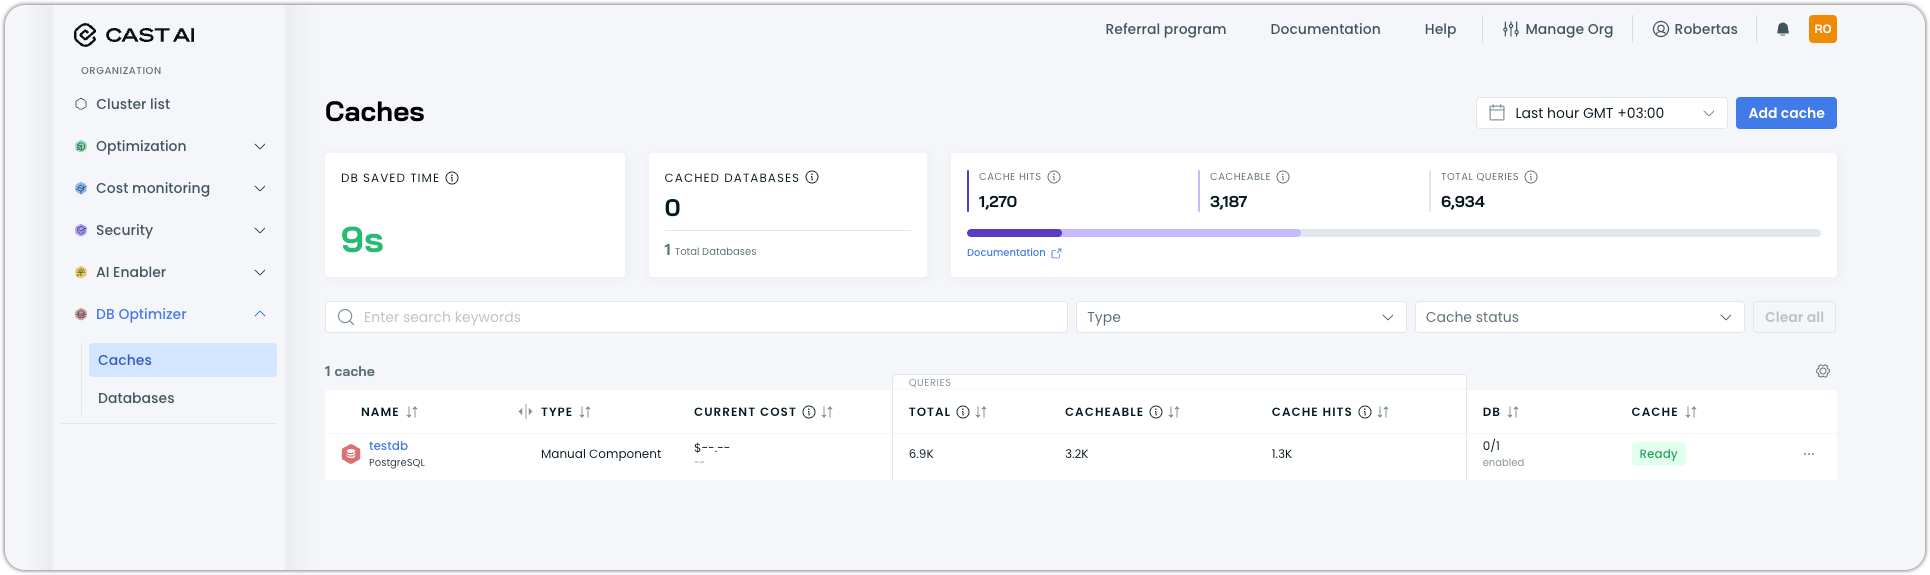
The cache will show:
- Status: Should display Ready when successfully deployed
- Type: Will show Manual Component for manually created caches
- Metrics: Initially showing 0 values as no traffic is flowing yet (the DBO proxy is not yet connected to your application)
You will notice that the number of Cached databases is 0 until DBO is connected to your application. Databases are automatically detected when your application connects through DBO - they will appear in the UI and start in passthrough mode by default. Caching will remain at 0 until you explicitly enable it for specific databases (phase 2).
Step 5: Update Application Connection Strings
To start monitoring your database traffic, update your application's connection string to route through the DBO proxy:
-
Click on your cache name to view details.
-
Click on the endpoints tab
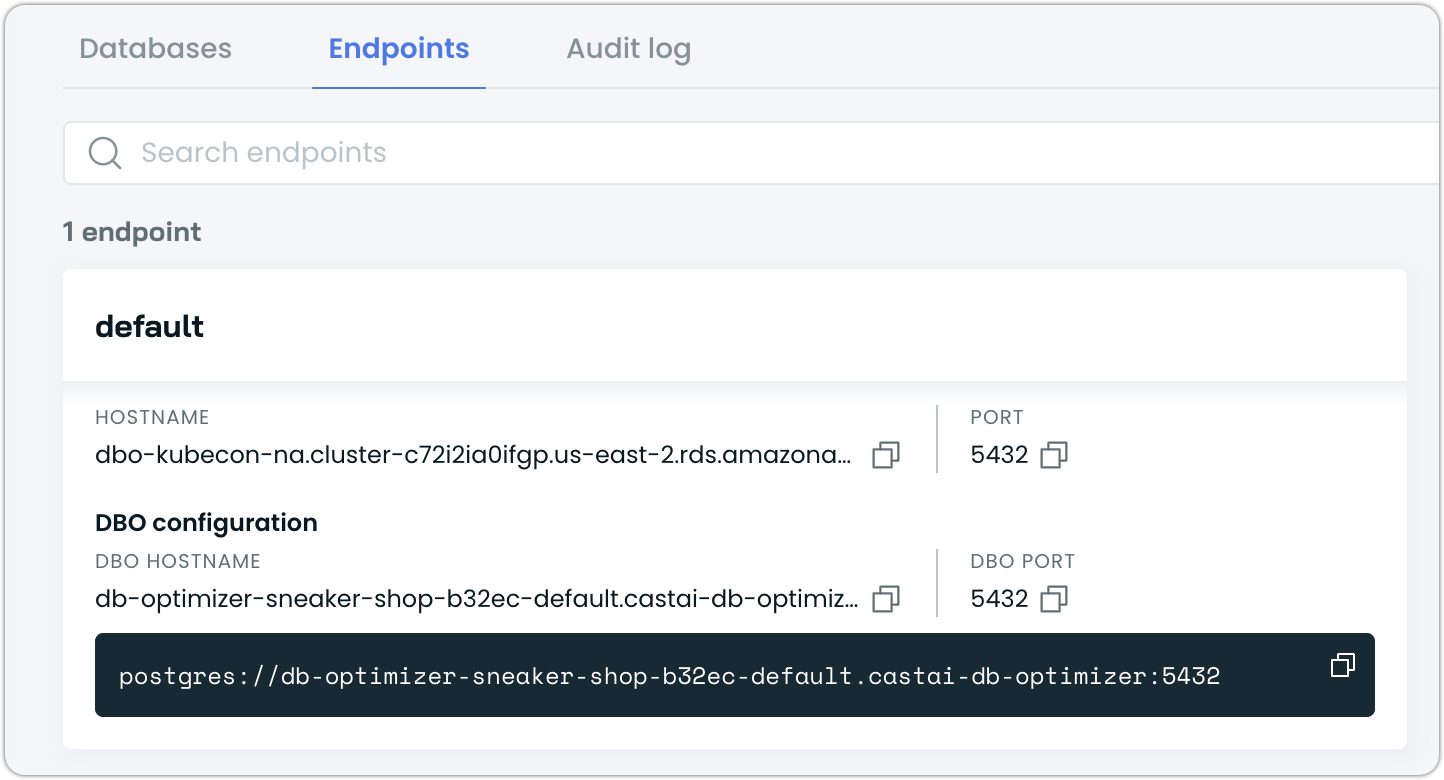
You'll see:
- Your original database hostname and port under the endpoint name
- DBO configuration section showing:
- DBO hostname: The proxy hostname to connect through
- DBO port: The port for the DBO proxy connection
- The complete connection string in the code block at the bottom
-
Copy the connection string from the code block.
-
Update your application configuration to use this connection string instead of your direct database connection.
For detailed connection instructions, see Connecting client applications.
Step 6: See the benefits of enabling caching
With your application connected, DBO will begin operating in passthrough mode:
In this mode, DBO provides powerful insights to help you understand the potential benefits before enabling active caching:
Real-time Analysis:
- All queries pass through to your database without being cached
- DBO analyzes query patterns and builds intelligence about your workload
- Zero risk to your production environment
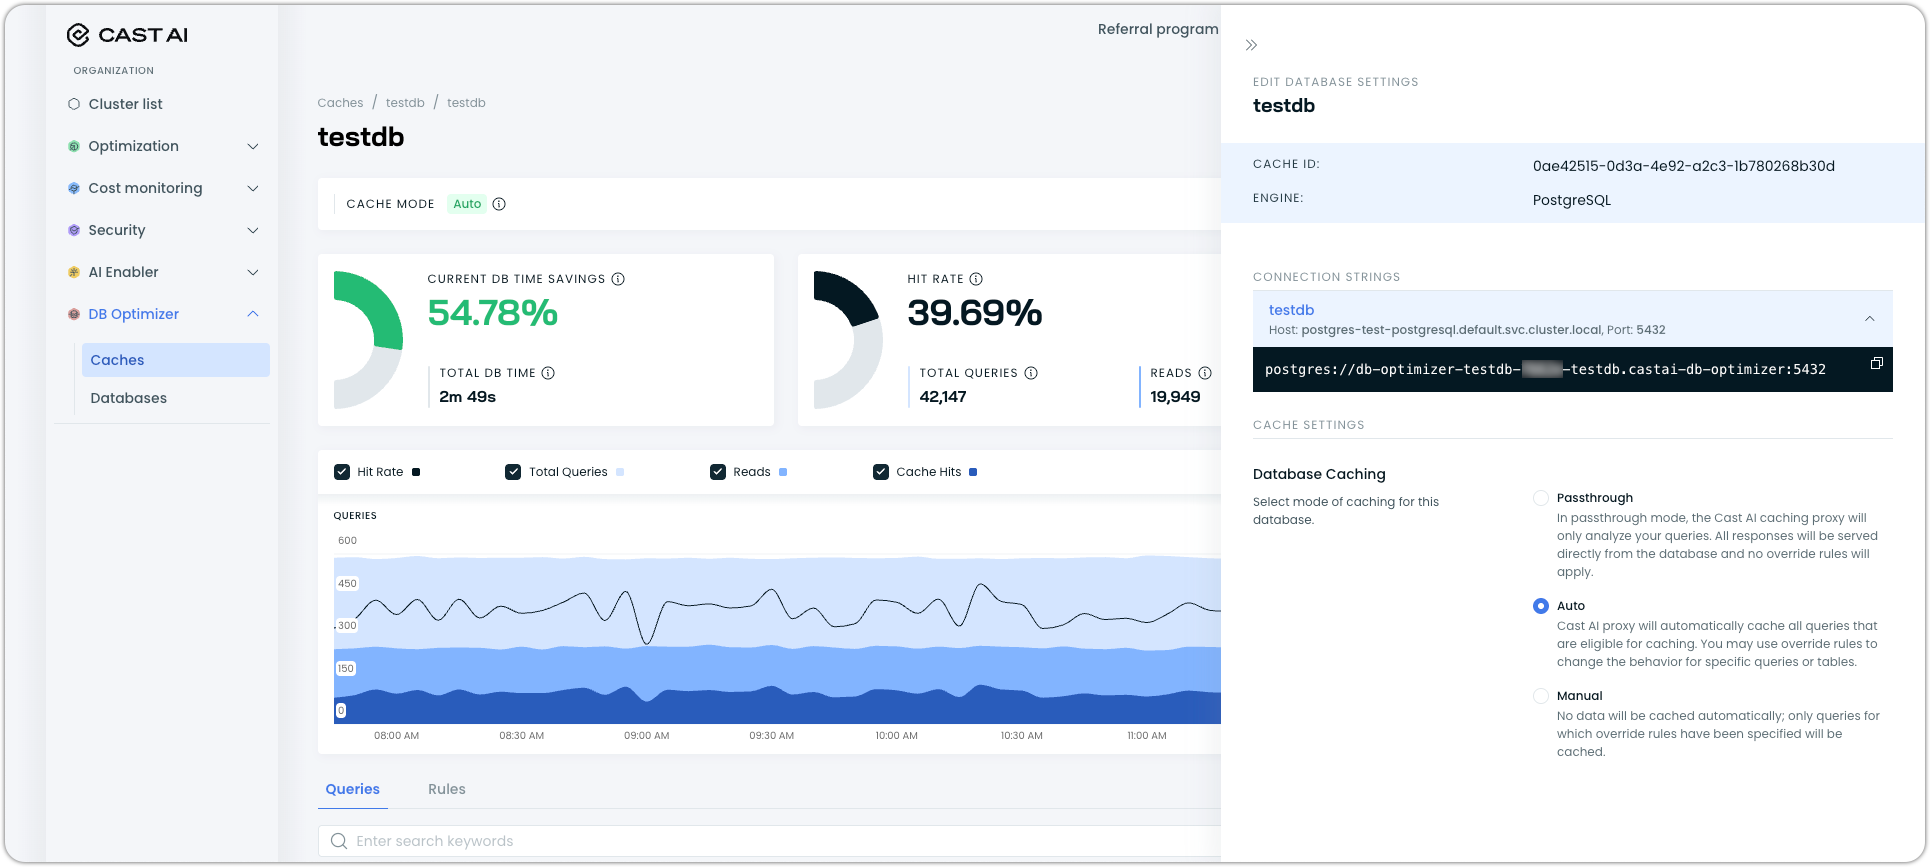
Projected Performance Metrics:
- Projected hit rate: Shows the estimated percentage of queries that would be served from cache in Auto mode
- Projected cache hits: Displays the estimated number of query hits that would have come from the cache
- Projected time savings: Calculates the total database time that would be saved based on expected cache performance
- Database time savings: Shows the percentage of total database time that could be reduced
Current Traffic Analysis:
- Total queries: Total number of database queries processed
- Cacheable queries: Read queries that are eligible for caching
- Read/Write distribution: The distribution of read and write queries processed by the database
Detailed Query Insights:
When you view individual queries in the detailed query view, you'll see additional projected metrics for each query template:
- Projected cache hits: How many times this specific query would have been served from cache
- Current response time: Average execution time for this query without caching
- Projected time saved: Estimated time savings for this query template based on the formula:
time saved = (average query execution time - min(1ms, average query execution time)) × projected cache hits
These projections give you confidence in the potential benefits and help you make informed decisions about when to enable active caching. The longer you run in passthrough mode, the more accurate these projections become as DBO learns your specific query patterns.
Phase 2: Enabling Active Caching
Once you're comfortable with the projected metrics and potential benefits shown in enhanced passthrough mode, you can enable active caching to start realizing the performance improvements.
Step 1: Access Cache Settings
- Repeat steps 1-3 from Step 5: Connecting Your Application to view the configuration for a particular database.
- Locate the Database Caching section.
Step 2: Choose Your Caching Mode
DBO offers two caching modes:
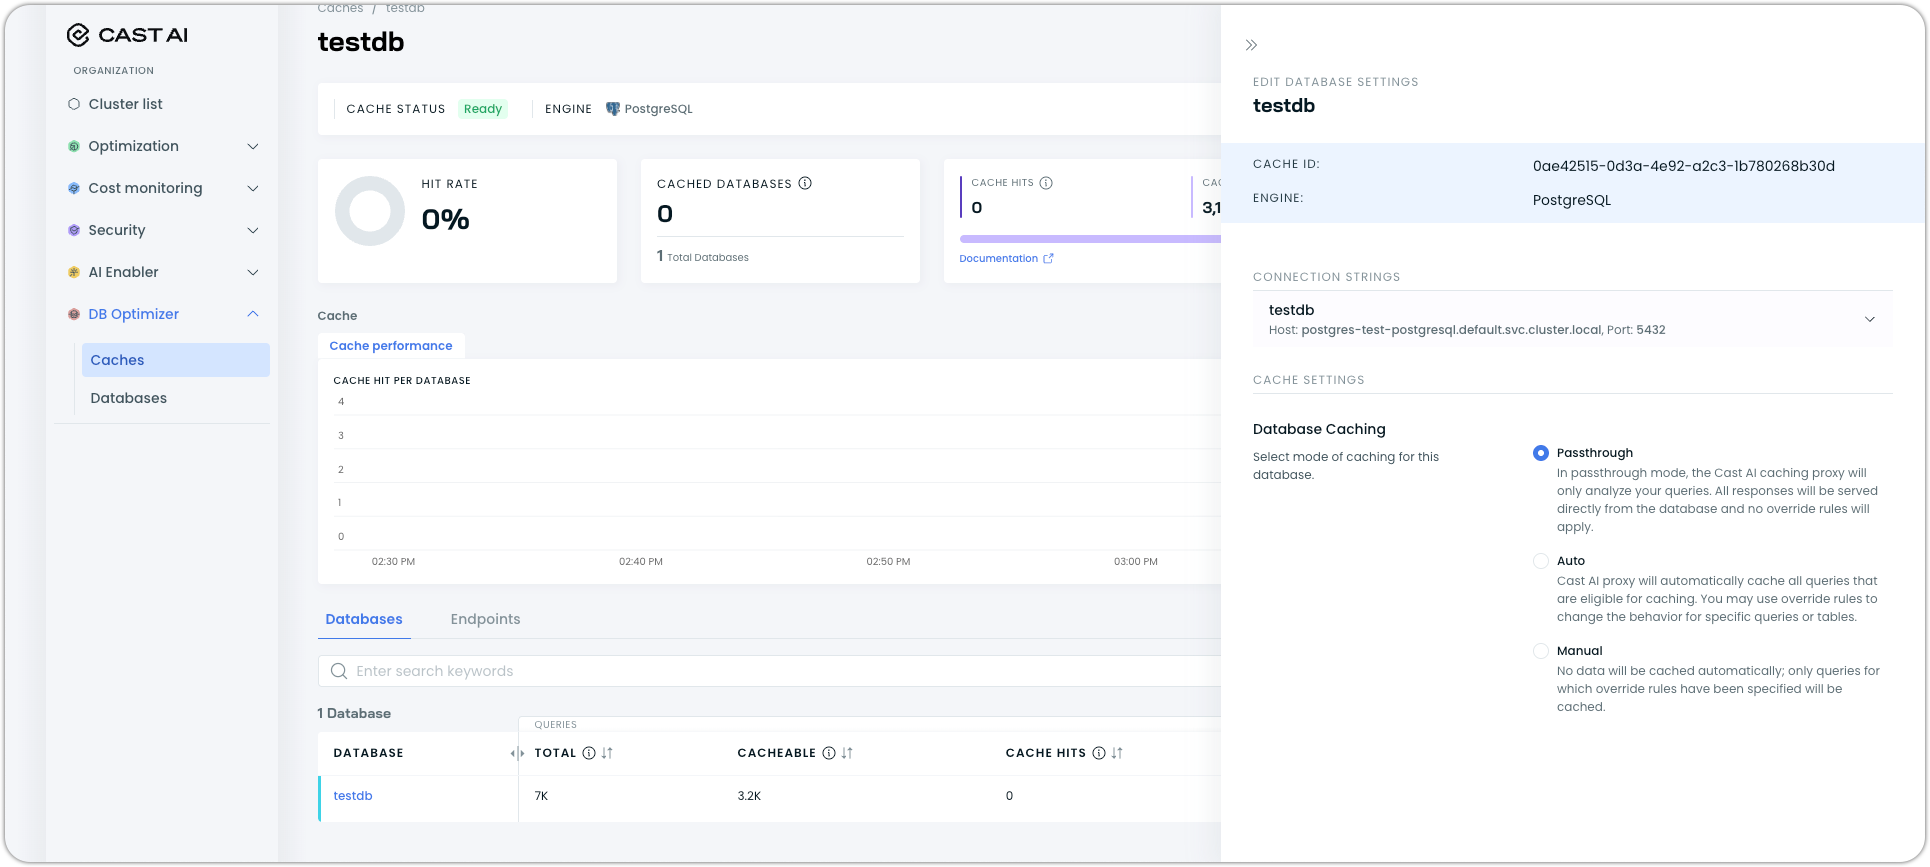
Auto Mode (Recommended)
- ML-driven caching that automatically optimizes all queries
- No configuration required
- Continuously adapts to your workload patterns
- Uses the same intelligence built during passthrough mode
Manual Mode
- Full control over what gets cached
- Only caches queries per specific rules
Step 3: Enable Caching
- Select your desired caching mode (Auto or Manual).
- The change takes effect immediately.
- Monitor the cache performance metrics to see how actual performance compares to projections.
Step 4: Compare Projected vs Actual Performance
Once caching is enabled, you can toggle between different views to compare your projected benefits with actual performance:
- Active caching view: Shows current cache performance metrics
- Passthrough comparison: Compare actual results with the projections from passthrough mode
- Combined view: See the complete journey from projections to reality
This allows you to validate the accuracy of the projections and understand how well DBO's AI predictions matched your actual workload.
Step 5: Fine-tune with Override Rules (Optional)
In either mode, you can create override rules for specific queries or tables:
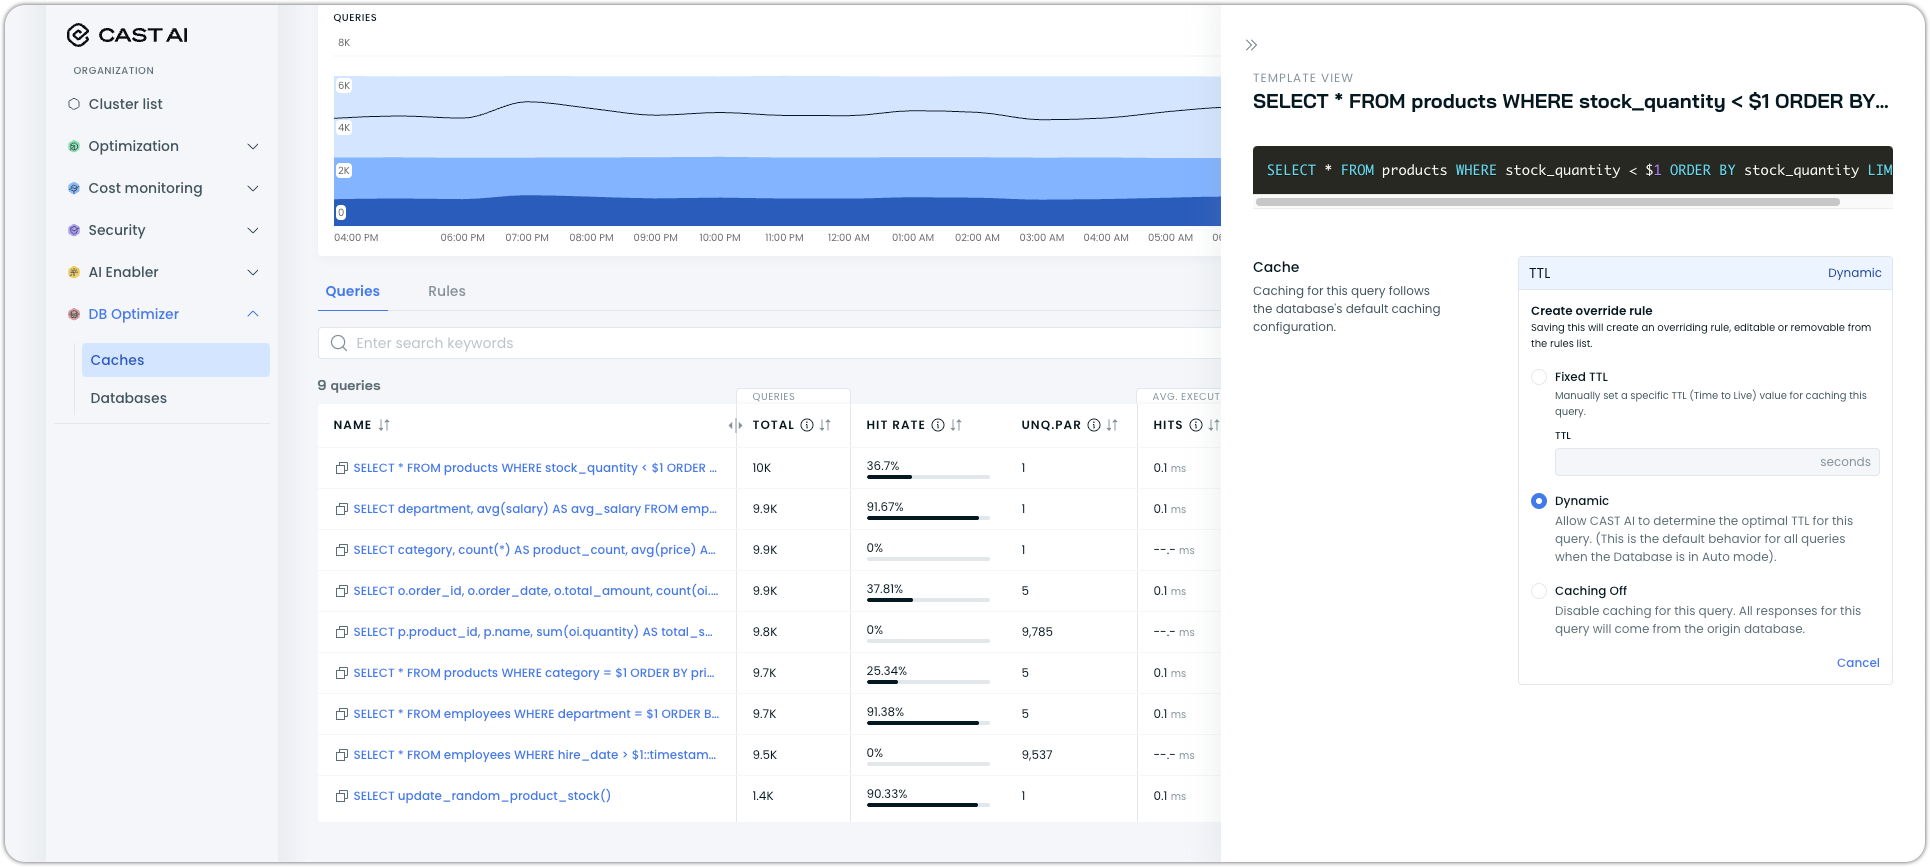
- Fixed TTL: Set specific cache duration for queries
- Dynamic: Let DBO determine optimal TTL (default in Auto mode)
- Caching Off: Disable caching for specific queries
Monitoring Performance
Once active caching is enabled, monitor key metrics and compare them to the projections:
- Hit Rate: Actual percentage of queries served from cache vs projected hit rate
- Cache Hits: Actual number of queries served without hitting the database
- Time Saved: Actual cumulative time saved vs projected time savings
- Database Load Reduction: Measured reduction in database CPU and connection usage
The enhanced passthrough mode projections provide a baseline for measuring the success of your caching implementation.
Next Steps
- Review performance metrics to optimize your cache configuration.
- Set up application failover for high availability.
- Use the projected vs actual performance comparison to fine-tune your caching strategy.
Updated 2 months ago