
Event log
The Event log provides a comprehensive view of all Workload Autoscaler actions in your cluster. You can access it from the left-hand menu under the Workload Autoscaler category.
Understanding the Event log
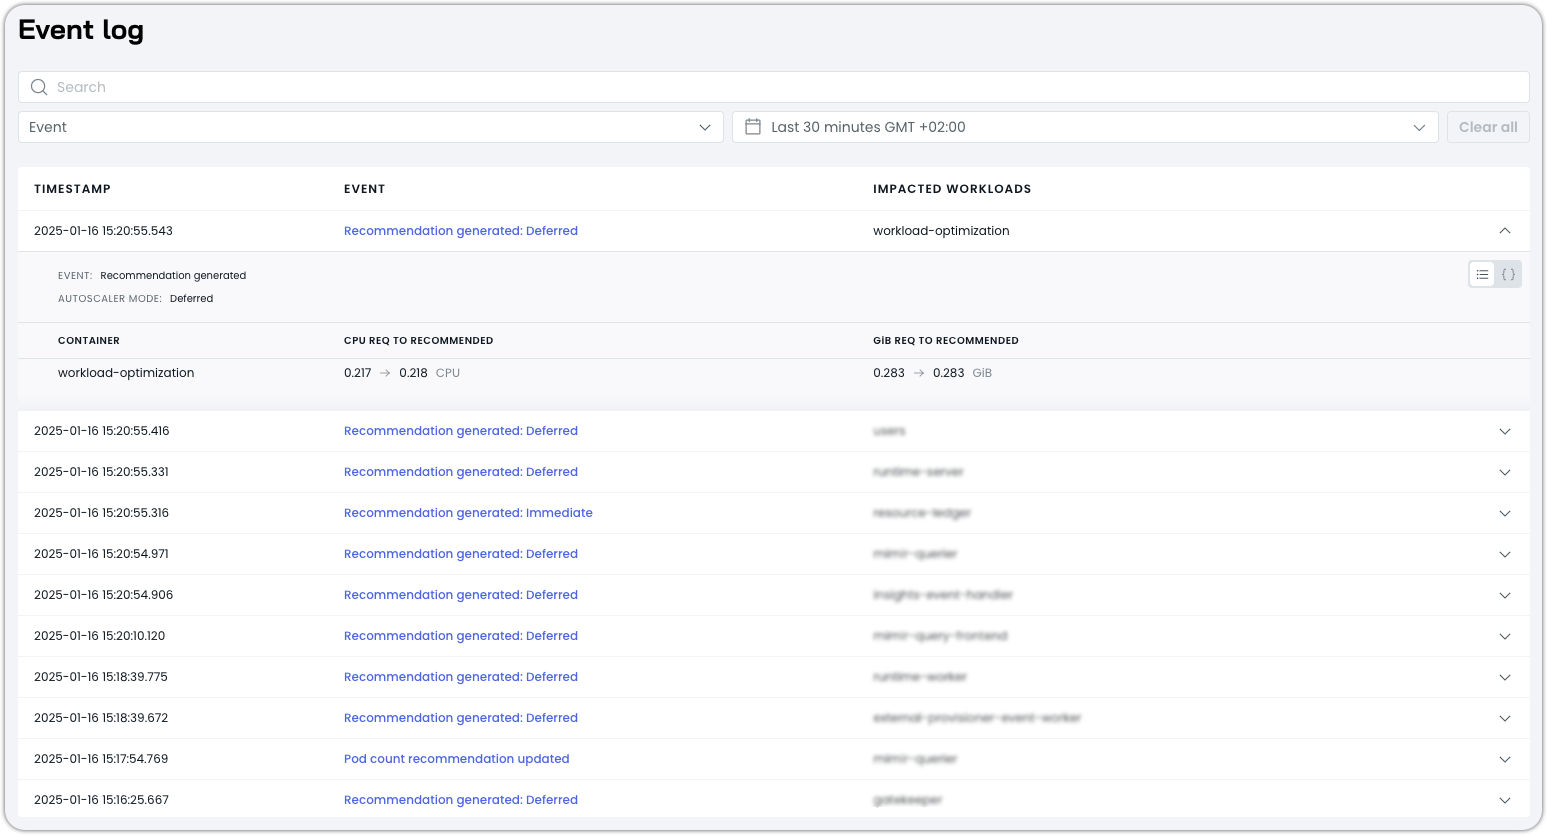
The Event log captures all types of events that help you monitor and troubleshoot automated workload optimization on Cast AI.
Workload optimization events
-
Recommendation generated events: Records when the system generates new resource adjustment recommendations, including:
- Immediate and deferred recommendation modes
- CPU and memory request recommendations
- Container-specific resource calculations
-
Request updated events: Track changes to resource requests, including:
- When the change was applied
- Which workload was affected
- Previous and new request values
-
Pod count recommendation updated events: Records when horizontal scaling recommendations are updated, showing:
- Current and recommended pod counts
- Scaling decisions and thresholds
-
Pods reverted events: Track when pods are reverted to previous configurations, including:
- Pod count changes
- Reasons for reversion
- User or system-initiated reversions
Resource and performance events
-
OOM kills events: Out-of-memory incident tracking with:
- Occurrence timestamp
- Affected workload and containers
- Memory usage data at time of termination
-
Resource surge events: Notifications when the platform detects unusual spikes in resource usage compared to established patterns, including:
- CPU and memory surge detection
- Container-specific surge information
- Surge magnitude and duration
-
CPU stall detected events: Notifications when CPU contention exceeds configured thresholds, including:
- Stall percentage per container
- Number and percentage of affected pods
- Threshold that was breached
- Resulting recommendation adjustment
-
Startup failure events: Notifications when readiness or startup probe failures exceed the detection threshold, indicating the workload may not have enough resources to initialize. See Startup failure detection for details.
System and configuration events
-
Configuration changed events: Records of workload configuration changes, including:
- Timestamp and affected workload
- The user who made the change
- Detailed before/after configuration comparisons
- Changes to optimization settings, constraints, and scaling policies
-
Failed Helm test events: System alerts when Helm test validations fail, including:
- Test failure details and error messages
- Links to troubleshooting resources
- Component health status
Scaling policy events
- Scaling policy created events: Records when new scaling policies are created, including:
- Policy configuration details
- Target rules and workload assignments
- User who initiated the creation
-
Scaling policy assigned events: Track when workloads are assigned to scaling policies, including:
- Number of workloads affected
- Policy assignment details
- User who made the assignment
-
Scaling policy edited events: Records modifications to existing scaling policies, including:
- Configuration changes (optimization settings, overhead, percentiles)
- Target rule modifications
- Impact on assigned workloads
-
Scaling policy deleted events: Track when scaling policies are removed, including:
- Policy details before deletion
- Impact on previously assigned workloads
- User who initiated the deletion
-
Scaling policy order changed events: Records when the priority order of scaling policies is modified, including:
- Previous and new policy ordering
- Number of policies affected
- Impact on workload assignments based on rule evaluation priority
Analyzing events
Each event offers two ways to analyze what happened.
Context view
Click on an event in the list to view it in context on a timeline:
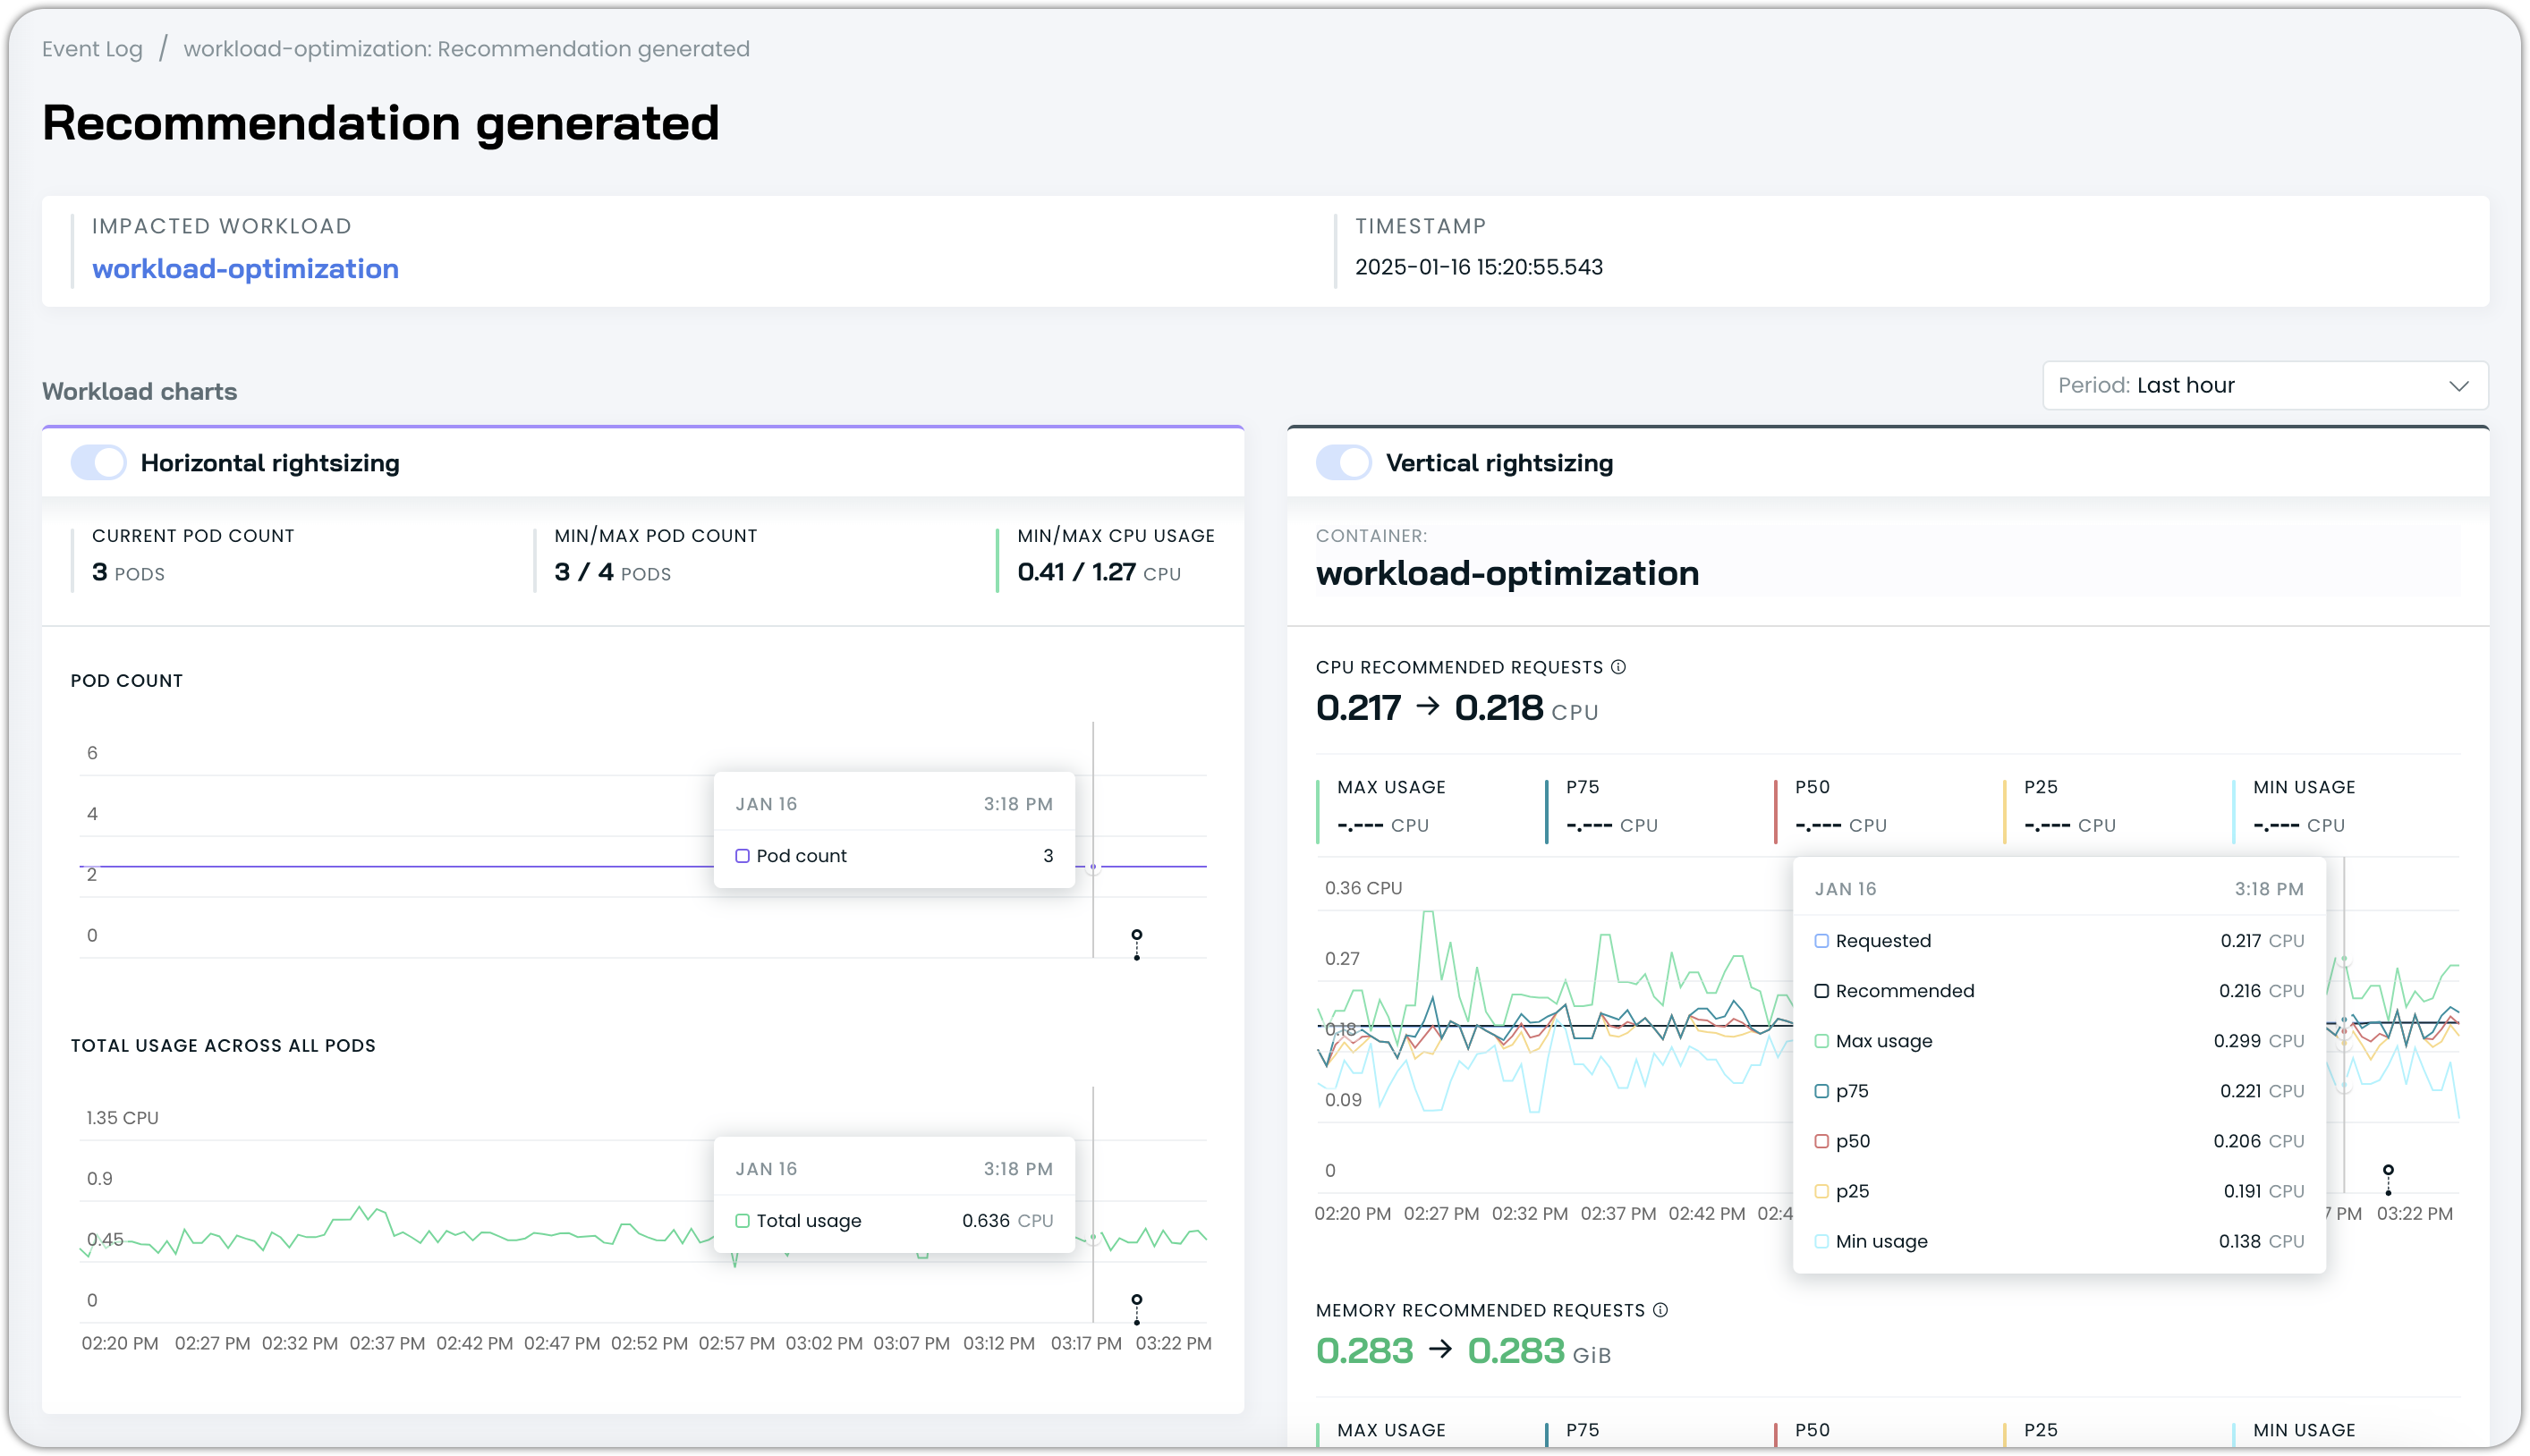
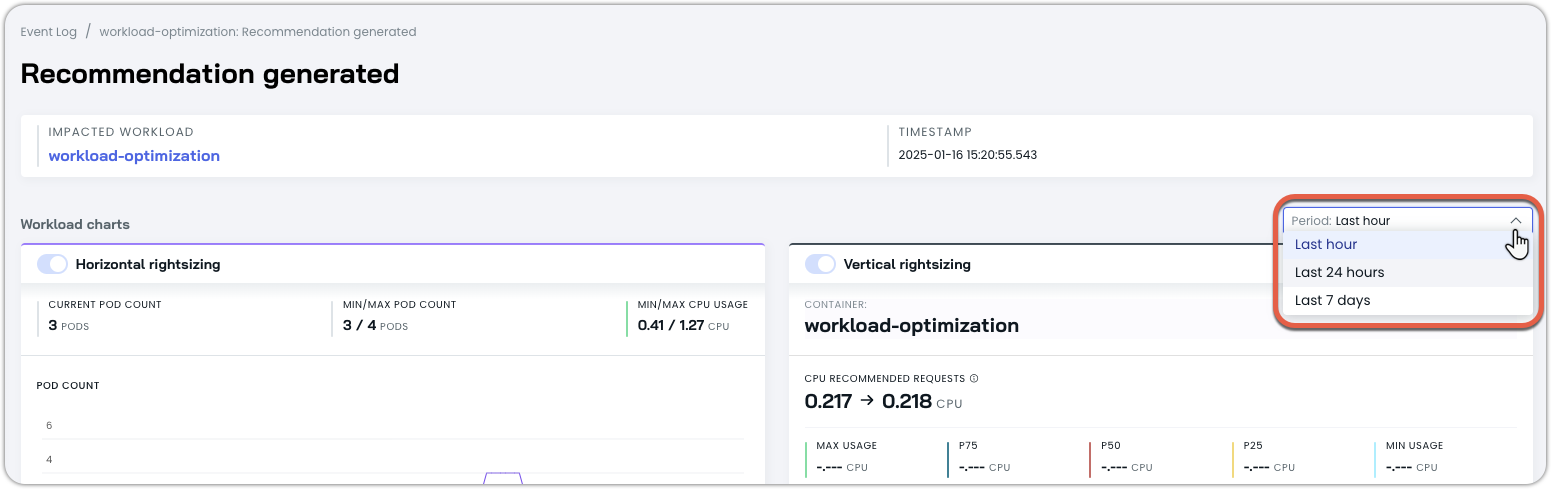
You can adjust the history window to view the desired amount of context for the workload by adjusting the period in the top right:
- Last hour
- Last 24 hours
- Last 7 days
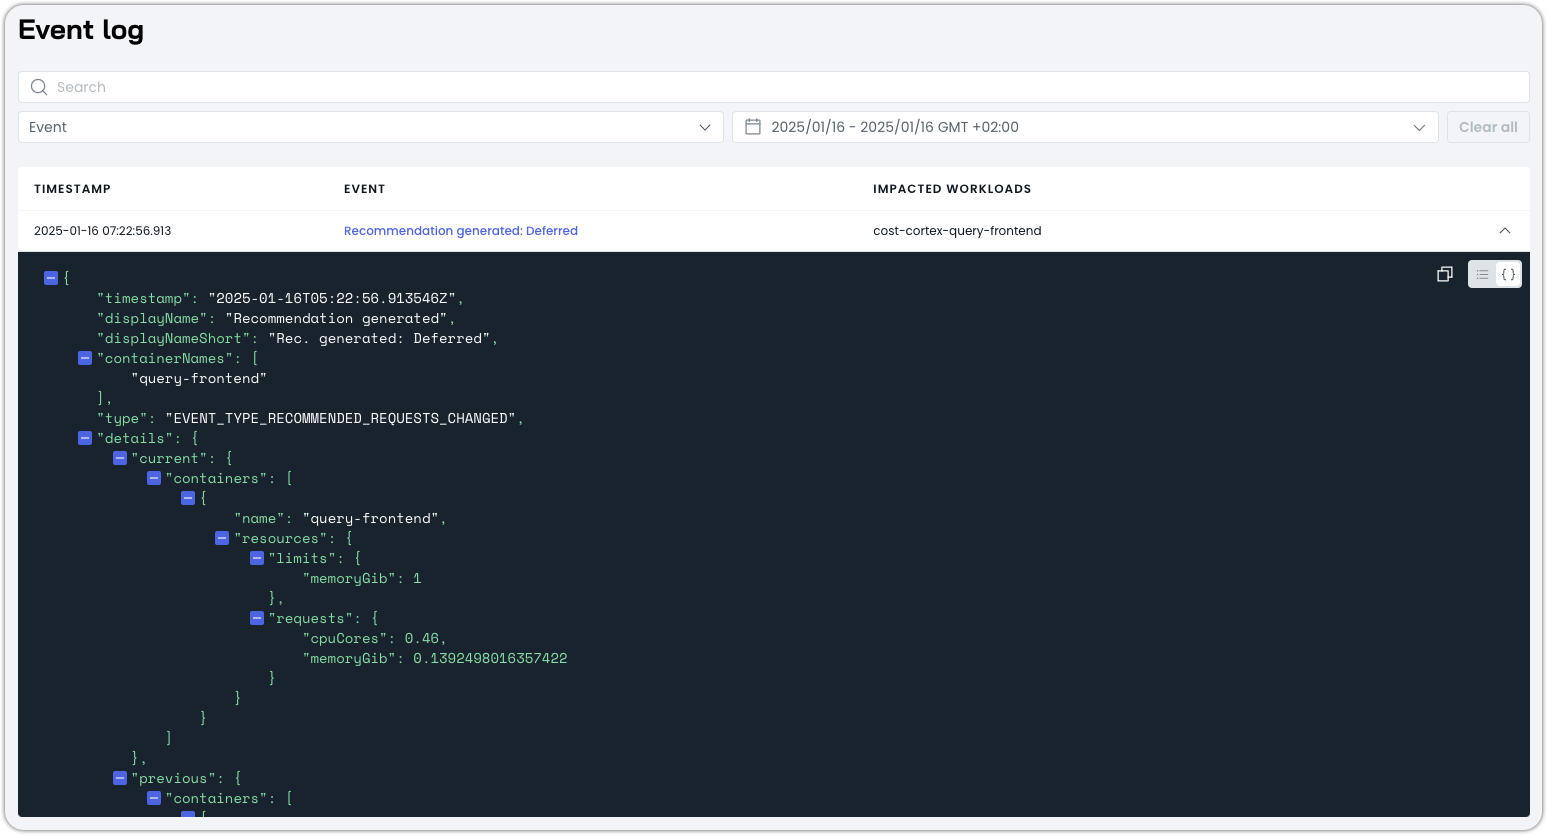
JSON view
You can examine the raw event data in JSON format for detailed troubleshooting. This provides complete transparency into the changes made and the reasoning behind them.
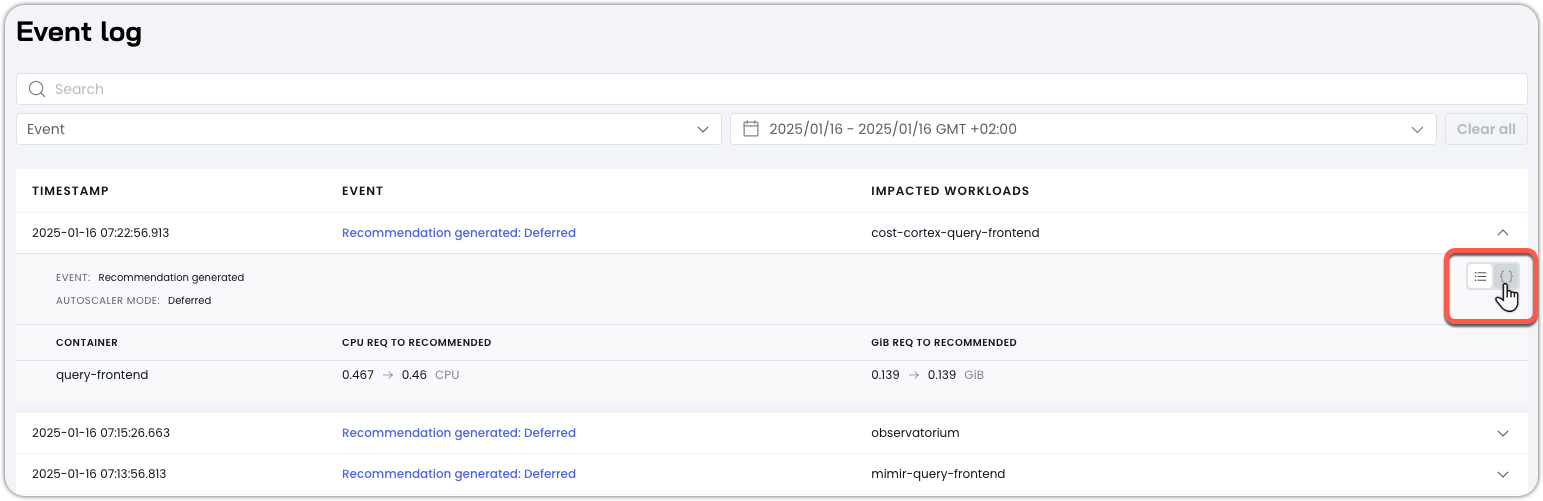
To enter the raw JSON view:
-
Expand the chosen event and click on the JSON icon in the top-right of the expanded cell:
-
This will switch the event view to raw JSON that you can analyze or easily copy into an editor or tool of your choosing:
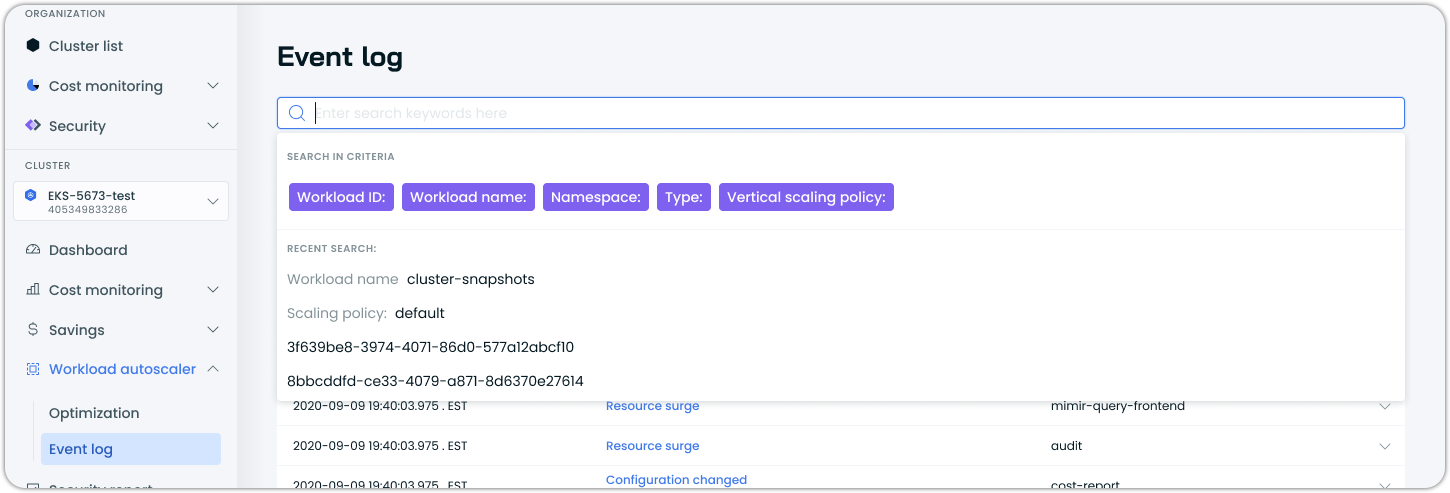
Event filtering and search
The Event log provides filtering capabilities to help you focus on specific types of events or time periods:
- Event type filters: Filter by specific event categories (recommendations, configuration changes, scaling policy events, etc.)
- Time range selection: Focus on events within particular time windows
- Workload filtering: View events related to particular workloads or namespaces
- User activity tracking: Filter events by the user who initiated changes
Event relationships
Many events in the log are interconnected and represent different stages of the optimization process or changes made by the user:
- Policy changes often trigger configuration changed events for affected workloads
- Resource surge events typically lead to recommendation generated events with adjusted parameters
- Scaling policy order changes may result in workload reassignment events as assignment rules are re-evaluated
- OOM kill events automatically trigger recommendation generated events with increased memory allocations
- CPU stall detected events automatically trigger recommendation generated events with increased CPU allocations
- Startup failure events automatically trigger recommendation generated events with increased CPU and memory allocations