
GPU utilization
Limited Availability FeatureThis feature is currently available through feature flags. Contact us to enable access for your organization.
GPU utilization monitoring helps you track and optimize the usage of GPU resources across your Kubernetes workloads. This feature, which is part of Cast AI's Cost Monitoring suite, provides detailed insights into GPU usage patterns, memory waste, and associated costs at both cluster and workload levels.
Prerequisites
Before you can access GPU utilization metrics, ensure that:
- Your cluster has GPU-enabled nodes
- You have workloads running on GPU nodes
- The Kvisor agent is installed with GPU metrics enabled (
--set agent.gpu.enabled=true). See GPU metrics collection for setup instructions.
Accessing GPU metrics
Once the prerequisites are met, GPU utilization metrics become available in the Cast AI console:
- The cluster dashboard shows aggregate GPU metrics
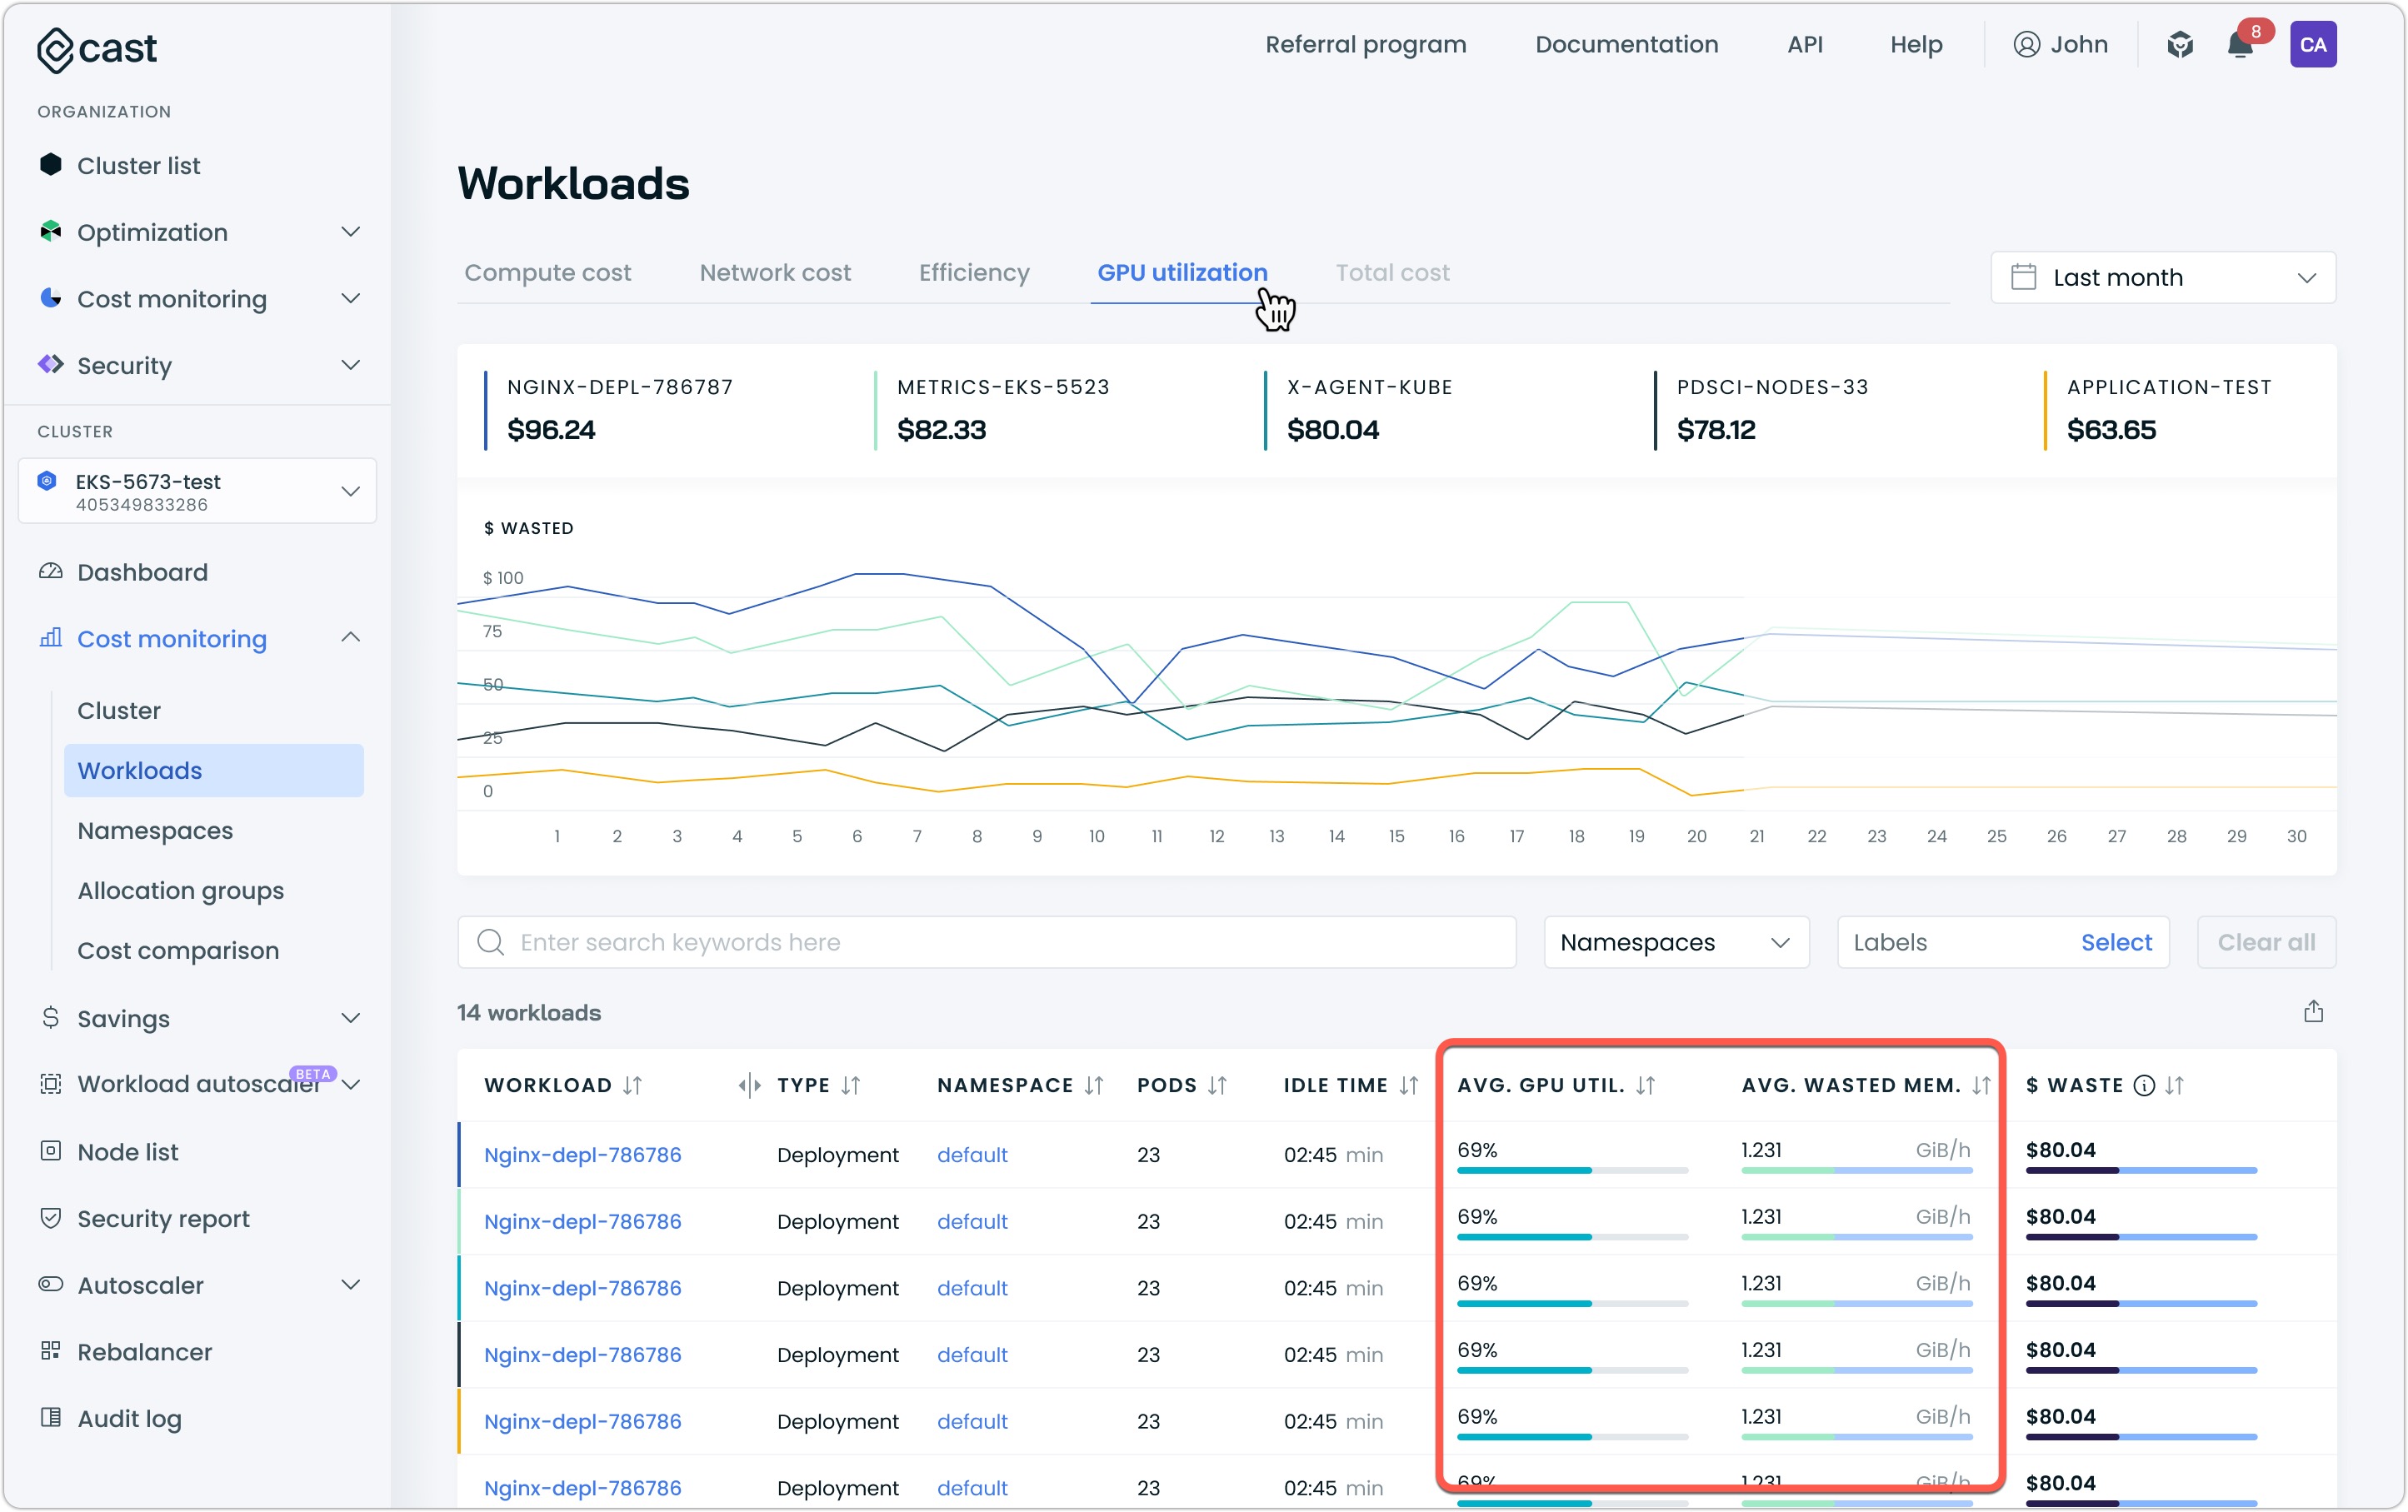
- The workloads report under cost monitoring provides detailed per-workload GPU metrics
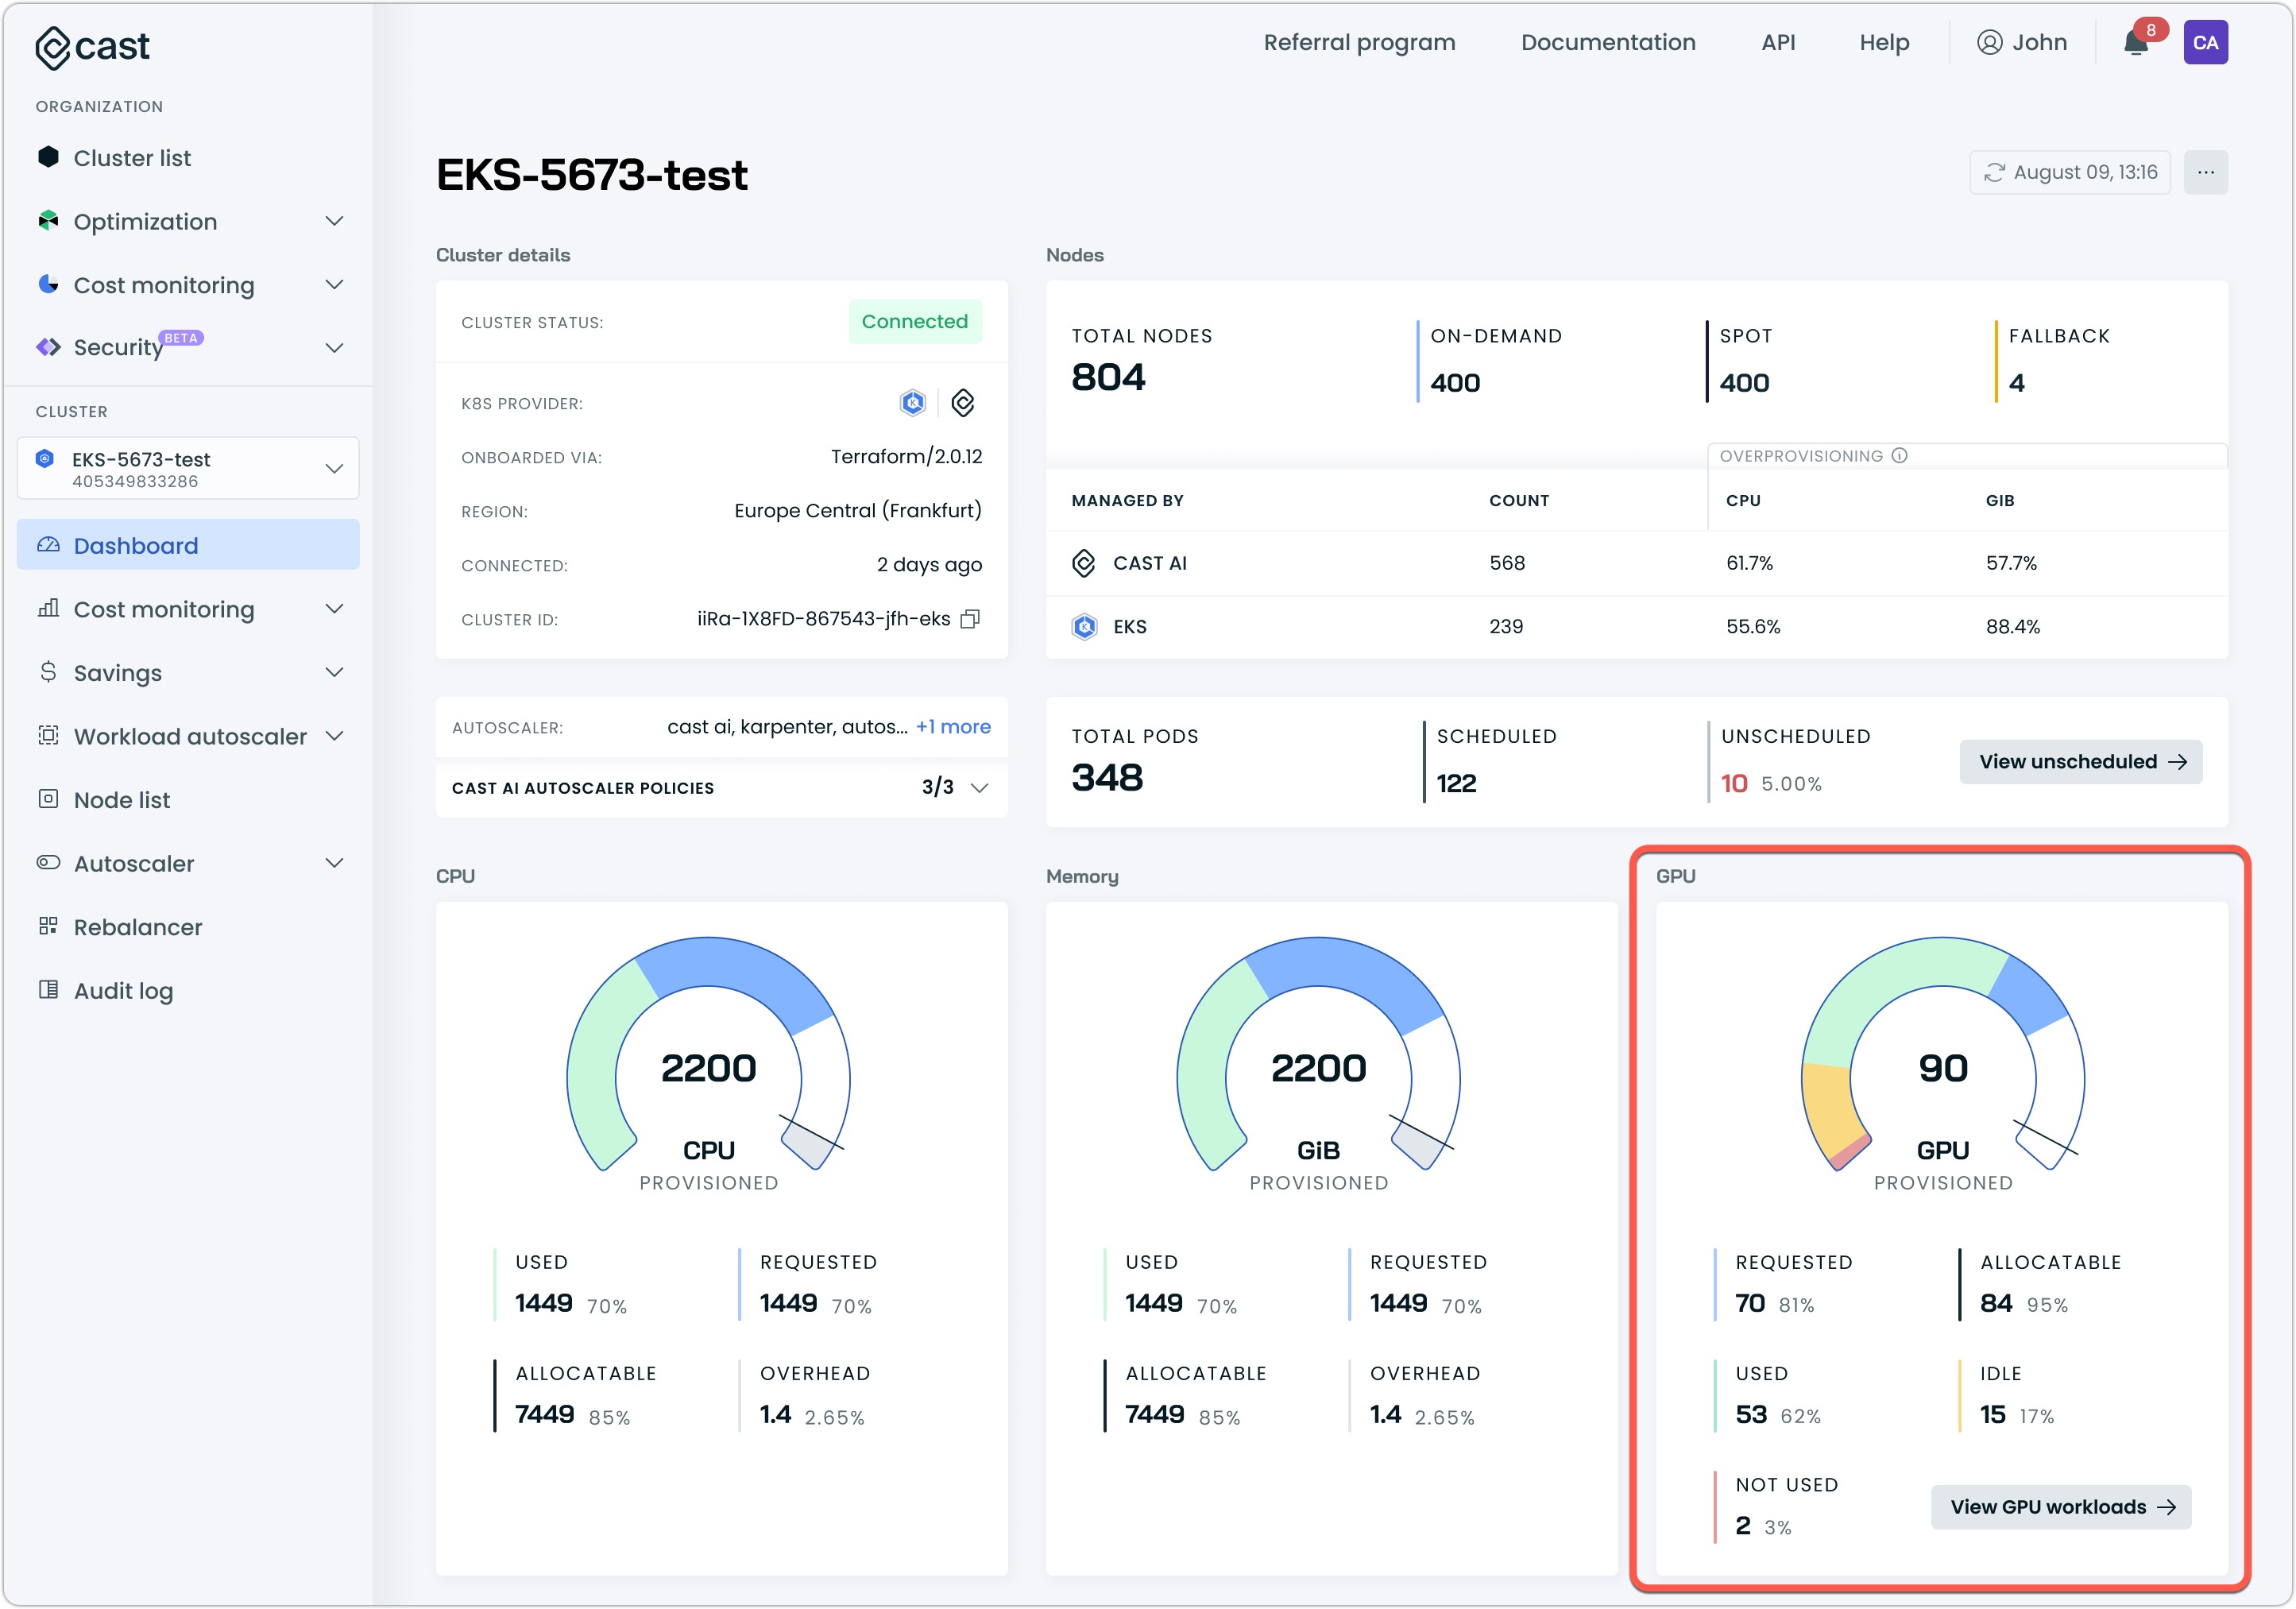
Cluster dashboard metrics
The cluster dashboard displays key aggregate GPU metrics:
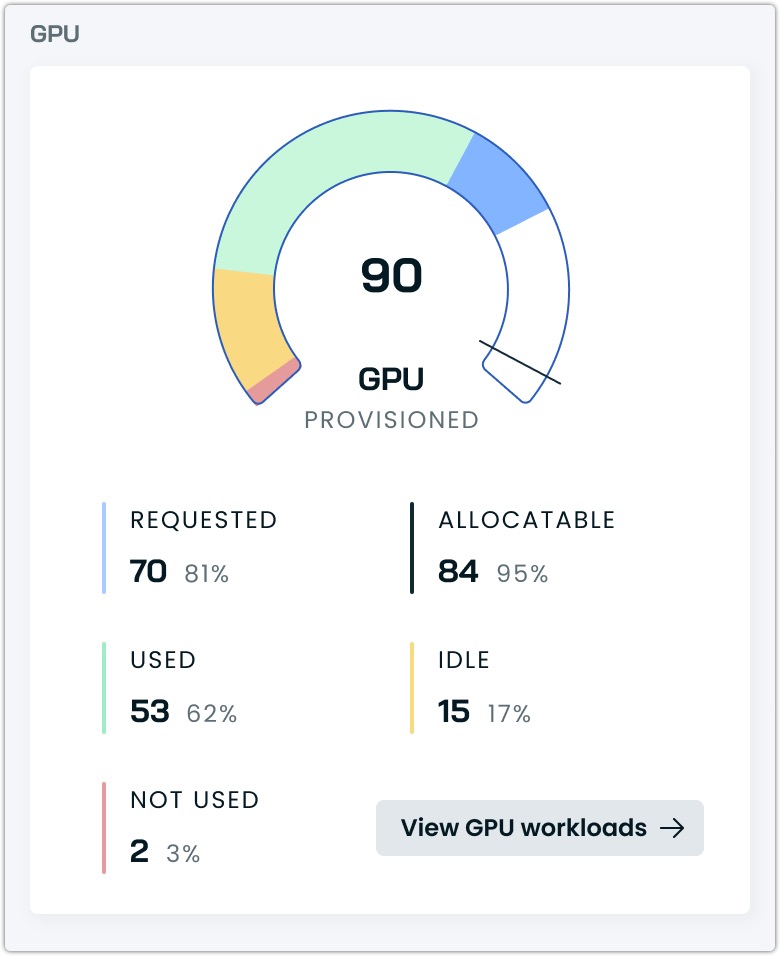
The dashboard distinguishes between physical GPUs and virtual GPU allocations (vGPUs) to provide accurate resource tracking.
- Provisioned GPUs: Represents the count of physical GPU devices in your cluster
- Allocatable GPUs: Represents the total number of vGPUs available to Kubernetes based on your sharing configuration
- Requested GPUs: The number of vGPUs requested by workloads
- Used GPUs: Active vGPU utilization across the cluster
NoteWith GPU sharing enabled, the Requested and Allocatable values may exceed the Provisioned count, as multiple workloads can share a single physical GPU. This is by design and reflects the resource multiplexing your GPU sharing configuration enabled.
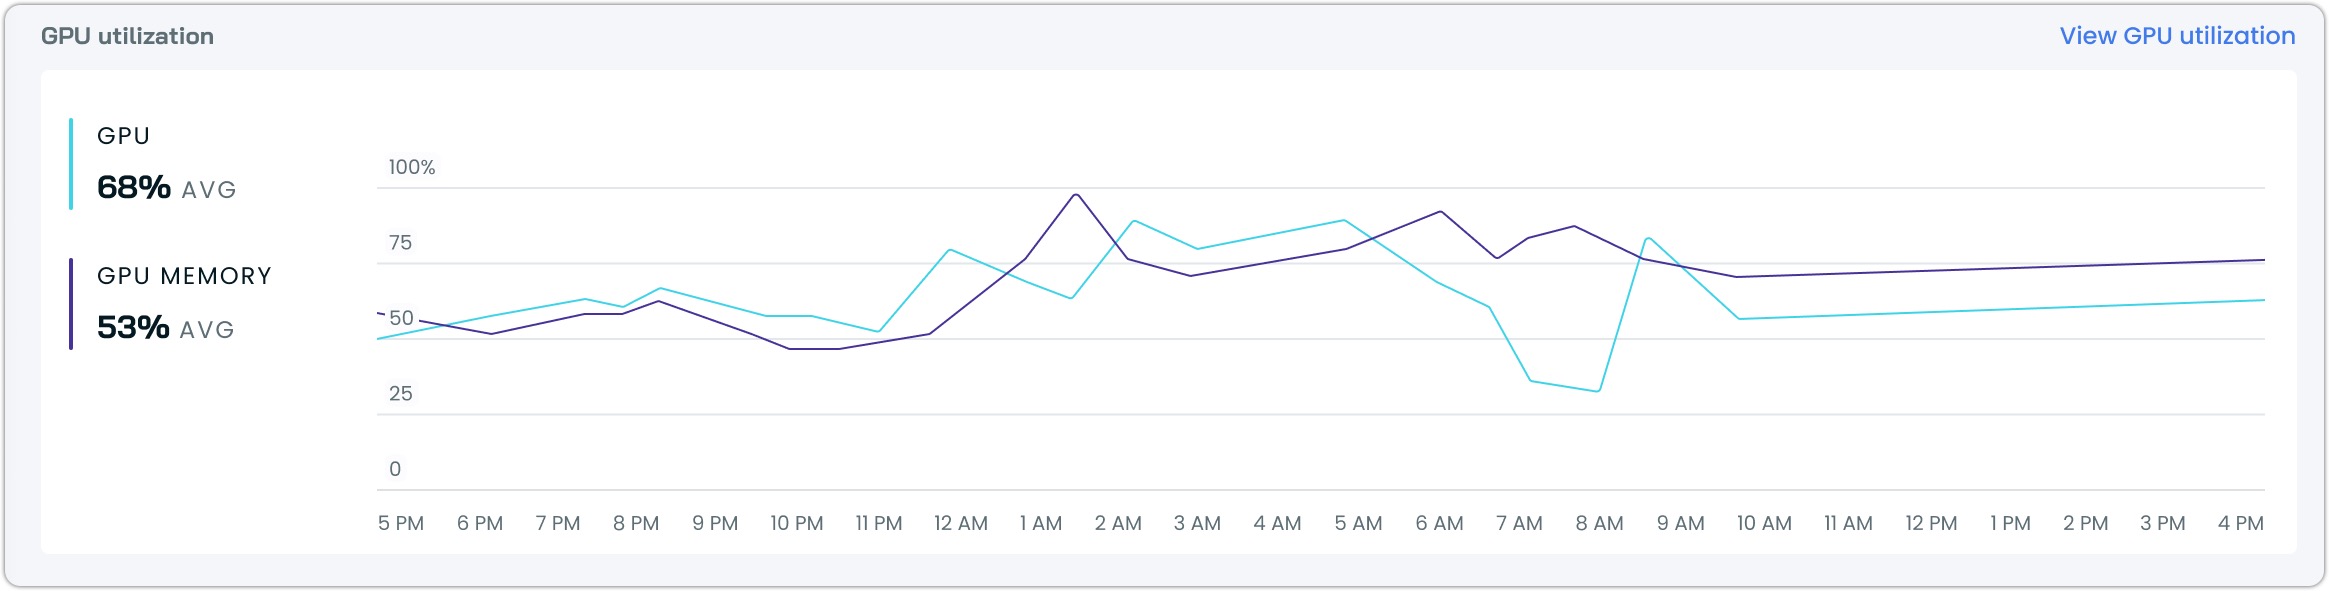
In addition to the above, you will find a GPU utilization graph in the dashboard, which highlights average GPU and GPU Memory utilization across your selected time window:
Workload-level metrics
When you select a specific workload from the workloads report, you'll see detailed GPU metrics organized into three tabs: utilization, memory waste, and cost waste. Each view provides different insights into how your workload uses its GPU resources
Utilization
The utilization view shows how effectively your workload uses its allocated GPU compute capacity. An interactive graph tracks the average GPU utilization over time, helping you identify patterns in resource usage.
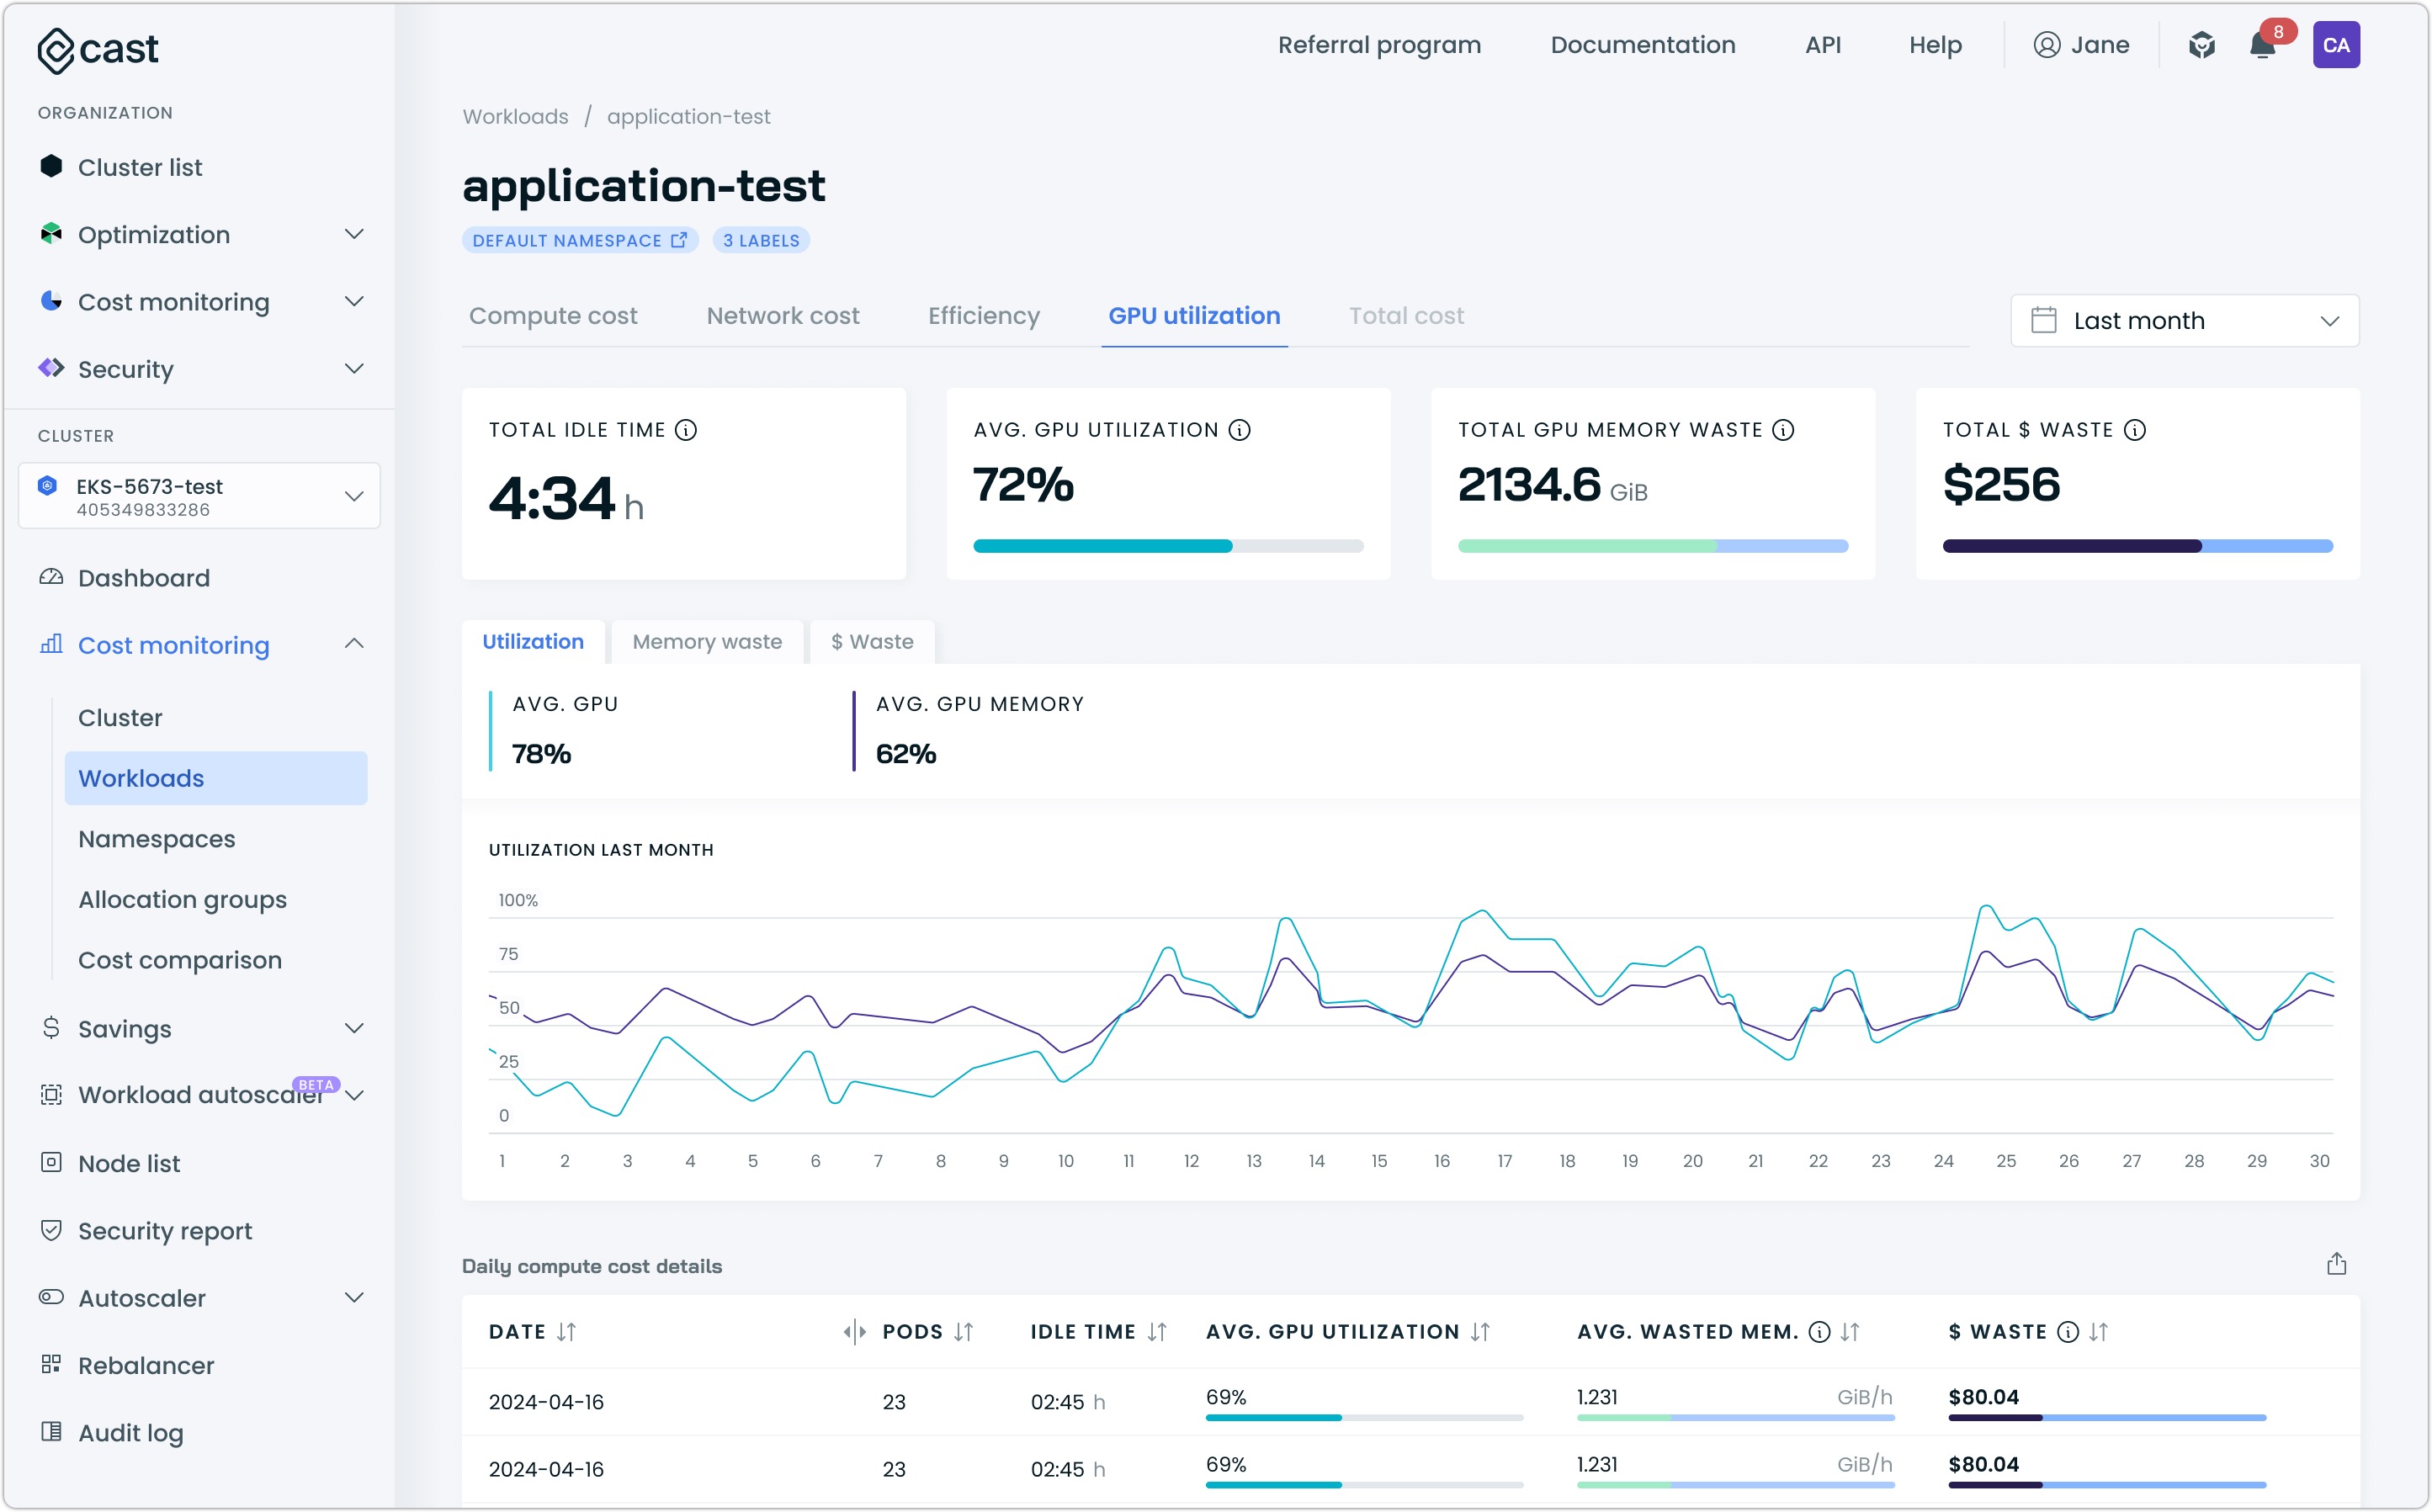
Utilization tab
Memory waste
Switch to the memory waste tab to understand how your workload manages GPU memory. The view breaks down available versus used memory and visualizes memory usage trends. This information helps identify if you're over-provisioning GPU memory, which is directly impacting your costs. The graph shows both used and available memory over time, making it easy to spot opportunities for optimization.
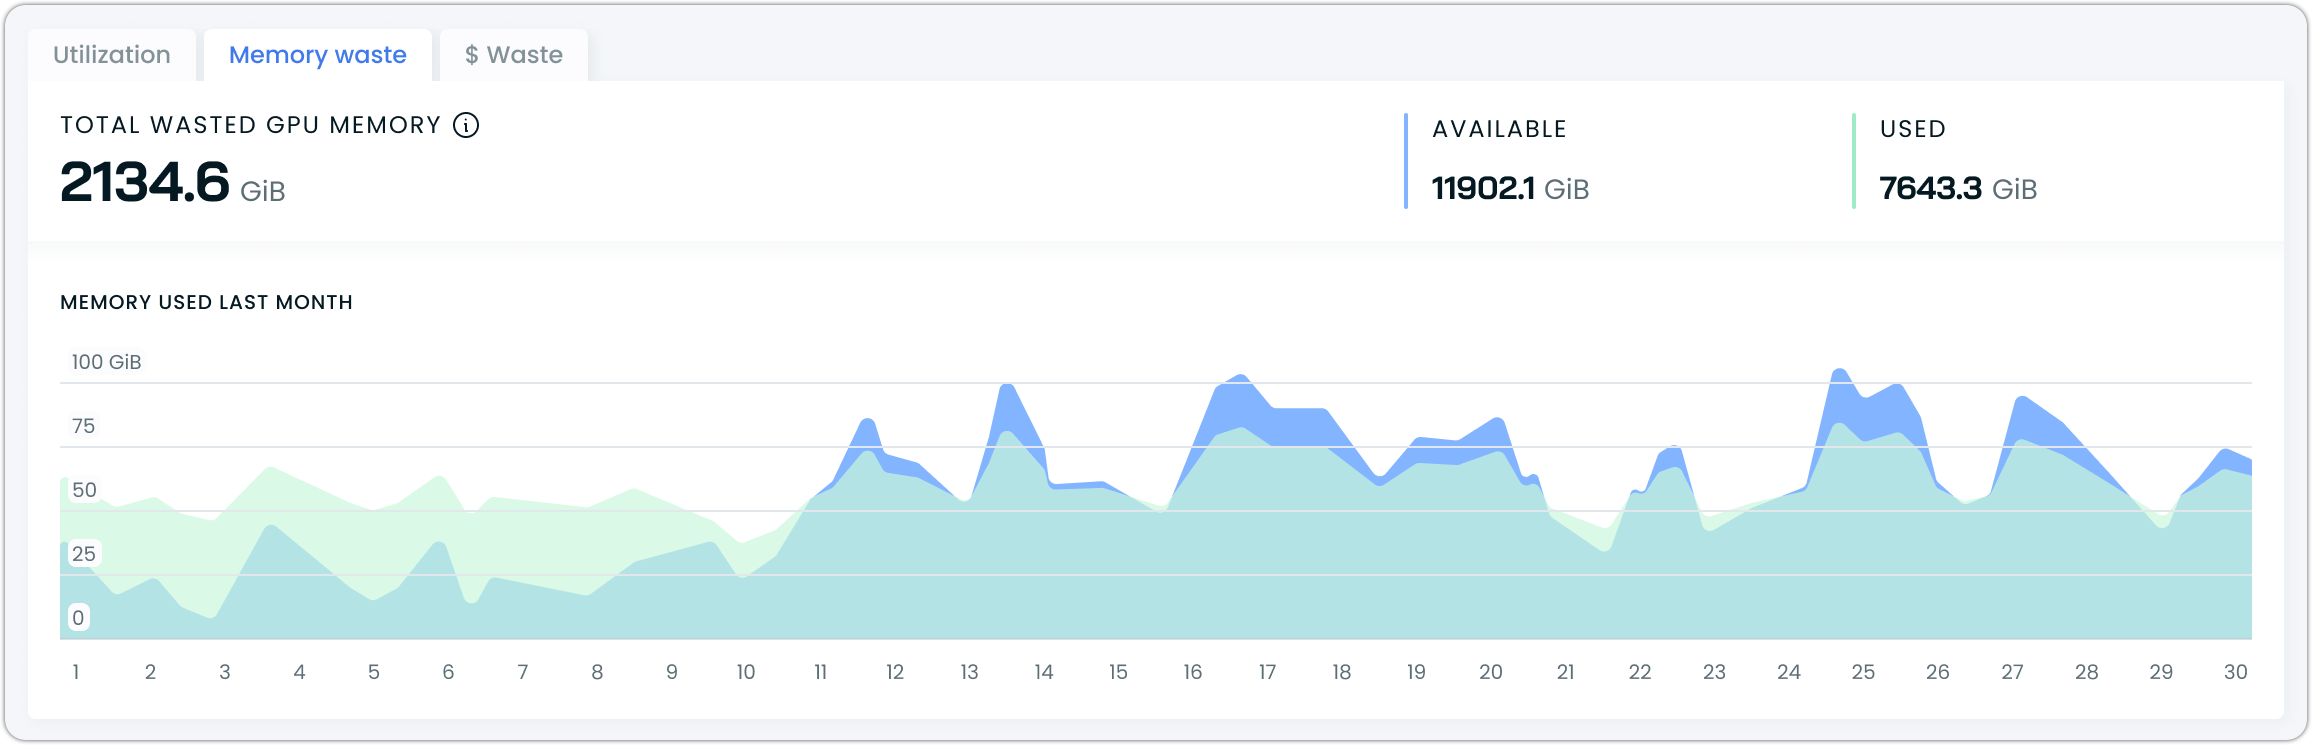
Memory waste tab
Cost waste
The cost waste tab translates your GPU usage into financial terms. It breaks down costs by instance lifecycle: on-demand, spot, and fallback instances, and shows how these costs accumulate over time.
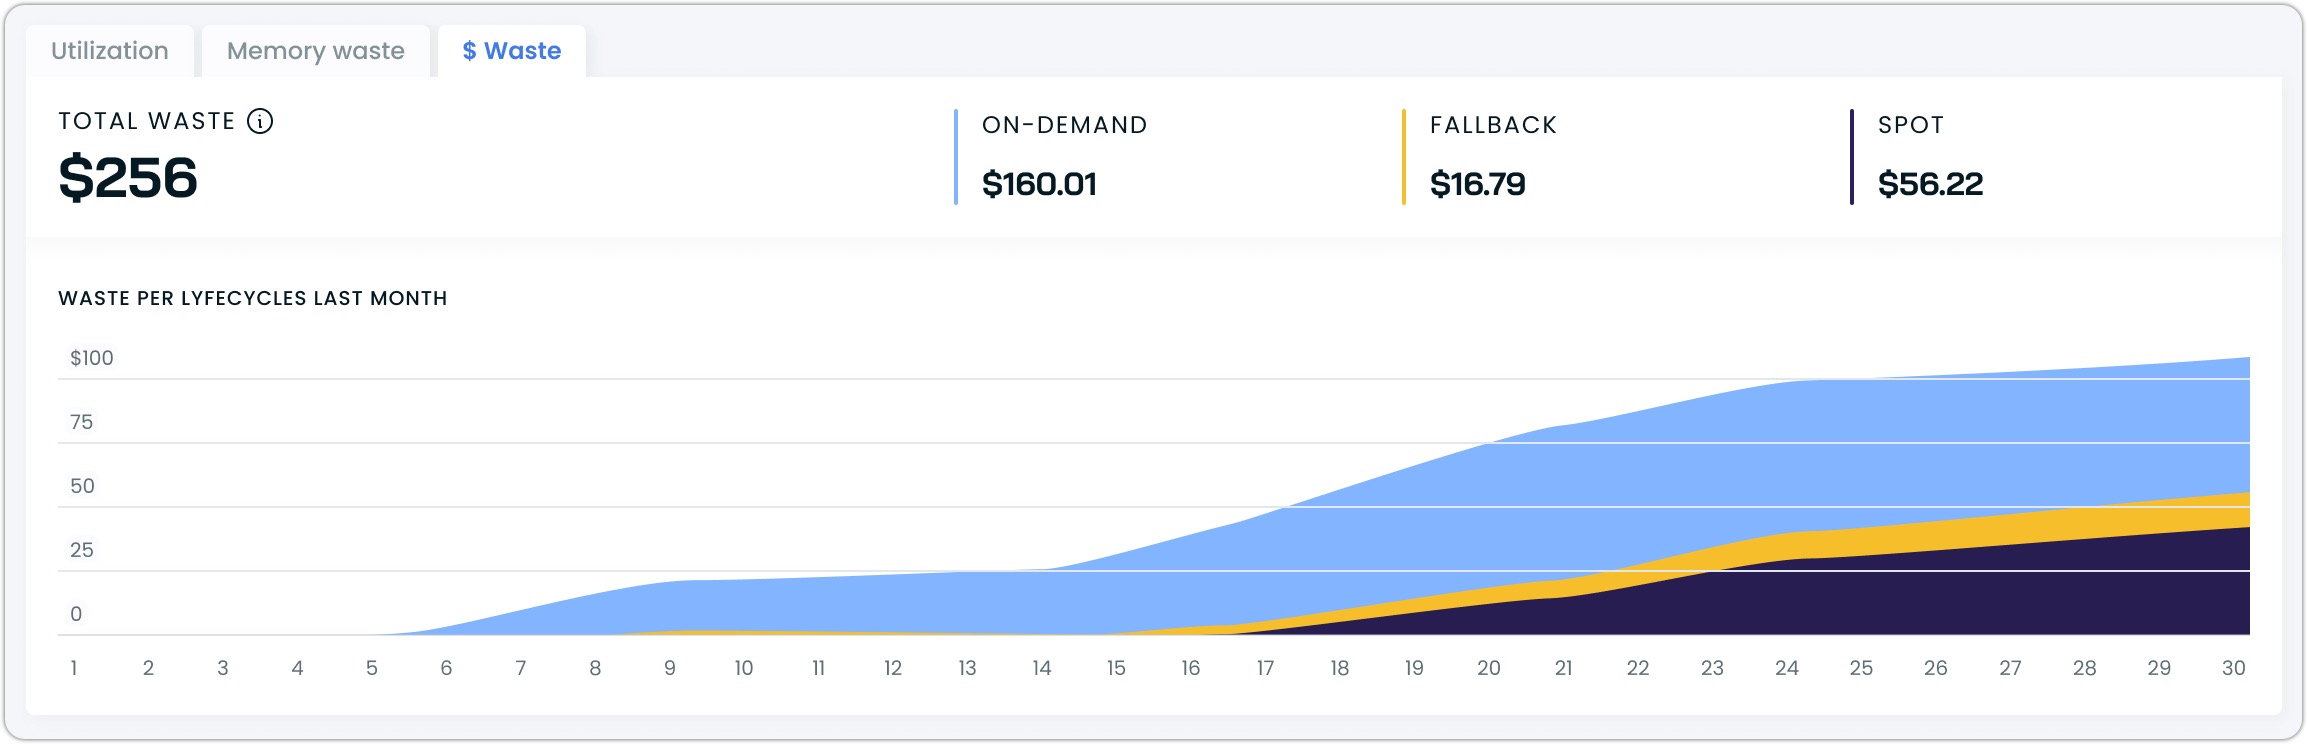
Cost waste tab
Updated 2 months ago