Cluster score
Overview
The Cast AI Cluster Score provides a comprehensive assessment of your Kubernetes cluster's optimization and efficiency. This tool analyzes multiple dimensions of your cluster configuration to deliver an actionable rating on a scale from 0 to 10.
Rather than focusing on a single aspect of performance, the Cluster Score evaluates how effectively your cluster balances resource allocation, workload efficiency, and cost optimization. It examines how well you're leveraging Cast AI's full suite of optimization features.
The score is calculated by analyzing several critical optimization areas:
- Resource provisioning: How efficiently your infrastructure resources are allocated and utilized
- Workload resource optimization: How accurately your resource requests match actual workload needs
- Rebalancing effectiveness: How proactively your cluster reallocates resources to maintain optimal performance
By tracking your Cluster Score over time, you can measure the impact of optimization efforts, identify opportunities for improvement, and benchmark your cluster against industry standards. Each component of the score provides targeted insights that help prioritize your optimization efforts where they'll deliver the greatest value.
Accessing the Cluster Score
You can view your Cluster Score in two ways:
-
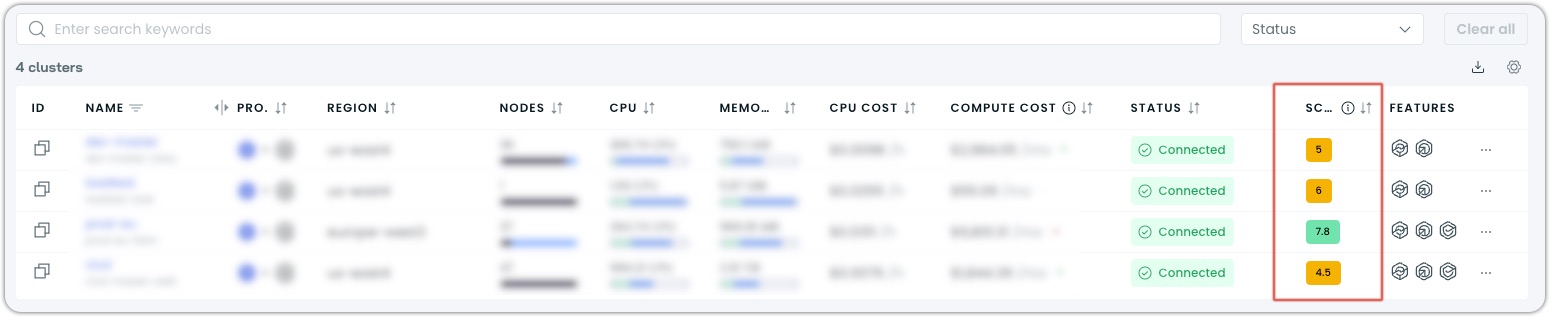
Cluster List View: The score appears next to each cluster in your organization's cluster list.
-
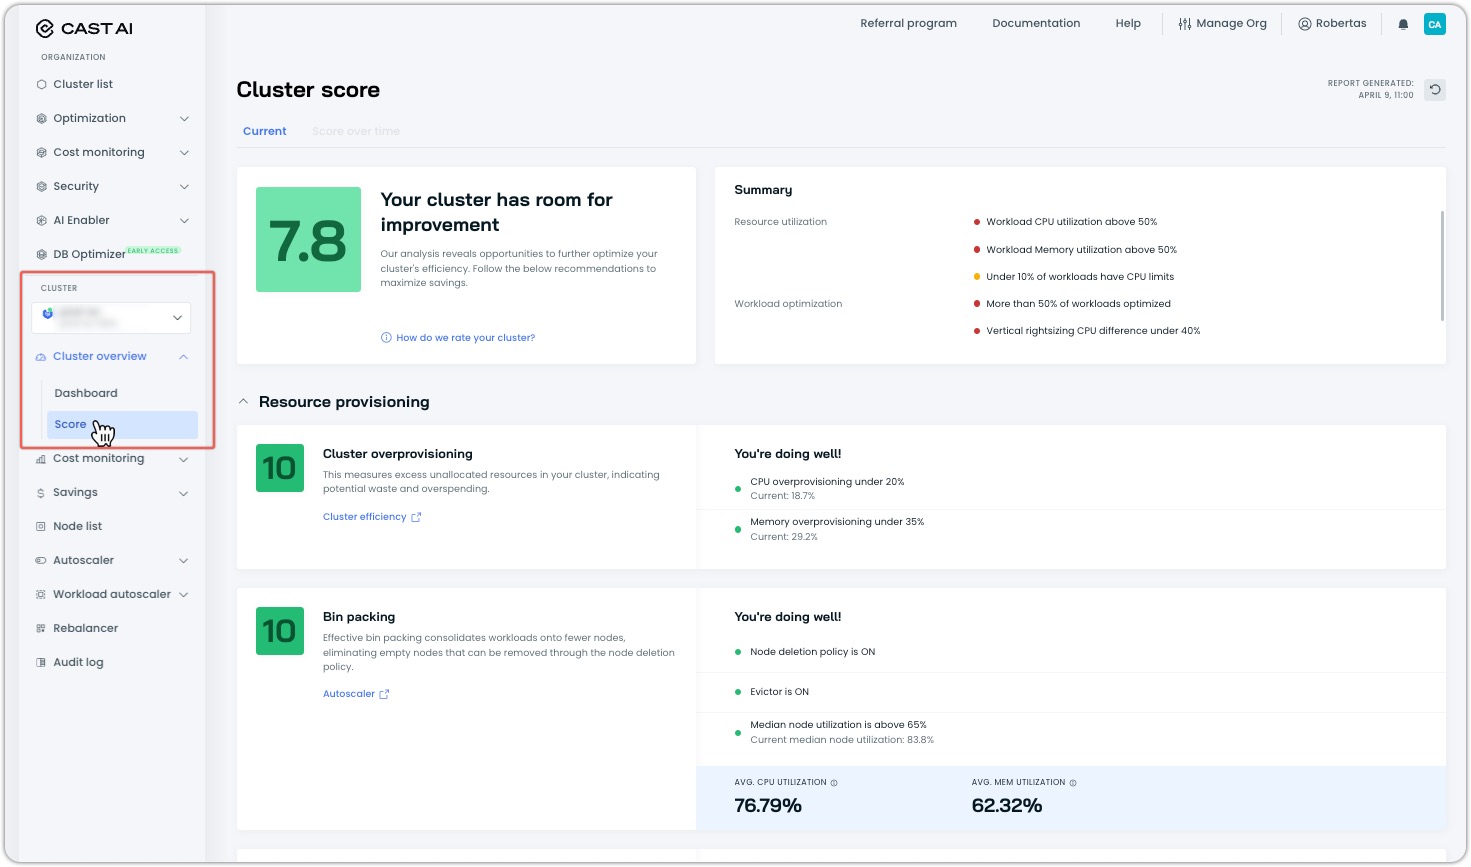
Cluster Detail View: Navigate to Cluster Overview → Score in the left sidebar menu.
Cluster Connection Phase Requirements
Note that the full Cluster Score is only available for clusters connected in Phase 2 (automated optimization). Clusters in Phase 1 (read-only) will display partial scores for some metrics but will not receive an overall score.
| Connection Phase | Score Availability |
|---|---|
| Phase 1 (Read-only) | Partial scores for overprovisioning and resource utilization only. |
| Phase 2 (Automation) | Full cluster score with all optimization categories. |
Score Calculation
The Cluster Score provides a dynamic assessment of your Kubernetes optimization that evolves as your cluster changes. This score is not static—it reflects ongoing improvements you make and changing workload patterns within your cluster.
-
Updates automatically every hour to capture recent changes in your cluster configuration and workload patterns without requiring manual intervention.
-
Can be manually refreshed anytime when you want immediate feedback after making changes. Simply click the refresh icon in the Cluster Score interface to see how your recent adjustments have affected your score.
-
Uses a 0-10 scale with one decimal place precision that provides enough granularity to track incremental improvements while remaining simple to understand.
-
Benchmarks your cluster against averages from all Cast AI customers, giving you context about where your optimization efforts stand compared to industry peers. This comparative analysis helps you understand if your score places you in the top percentile of all customers or if there's still significant room for improvement.
As you implement recommended optimizations, your score will typically improve over time, reflecting the increased efficiency of your Kubernetes cluster.
NoteThe score calculation does not factor in the complexity of your workloads and the specific challenges of your infrastructure. Therefore, the assessment is most relevant when the changes in score are compared against your own over time.
Optimization Categories
By following the recommendations below and regularly reviewing your Cluster Score, you can ensure your Kubernetes cluster operates at peak efficiency while minimizing costs.
Resource Provisioning
This category measures how efficiently your cluster's resources are allocated and managed.
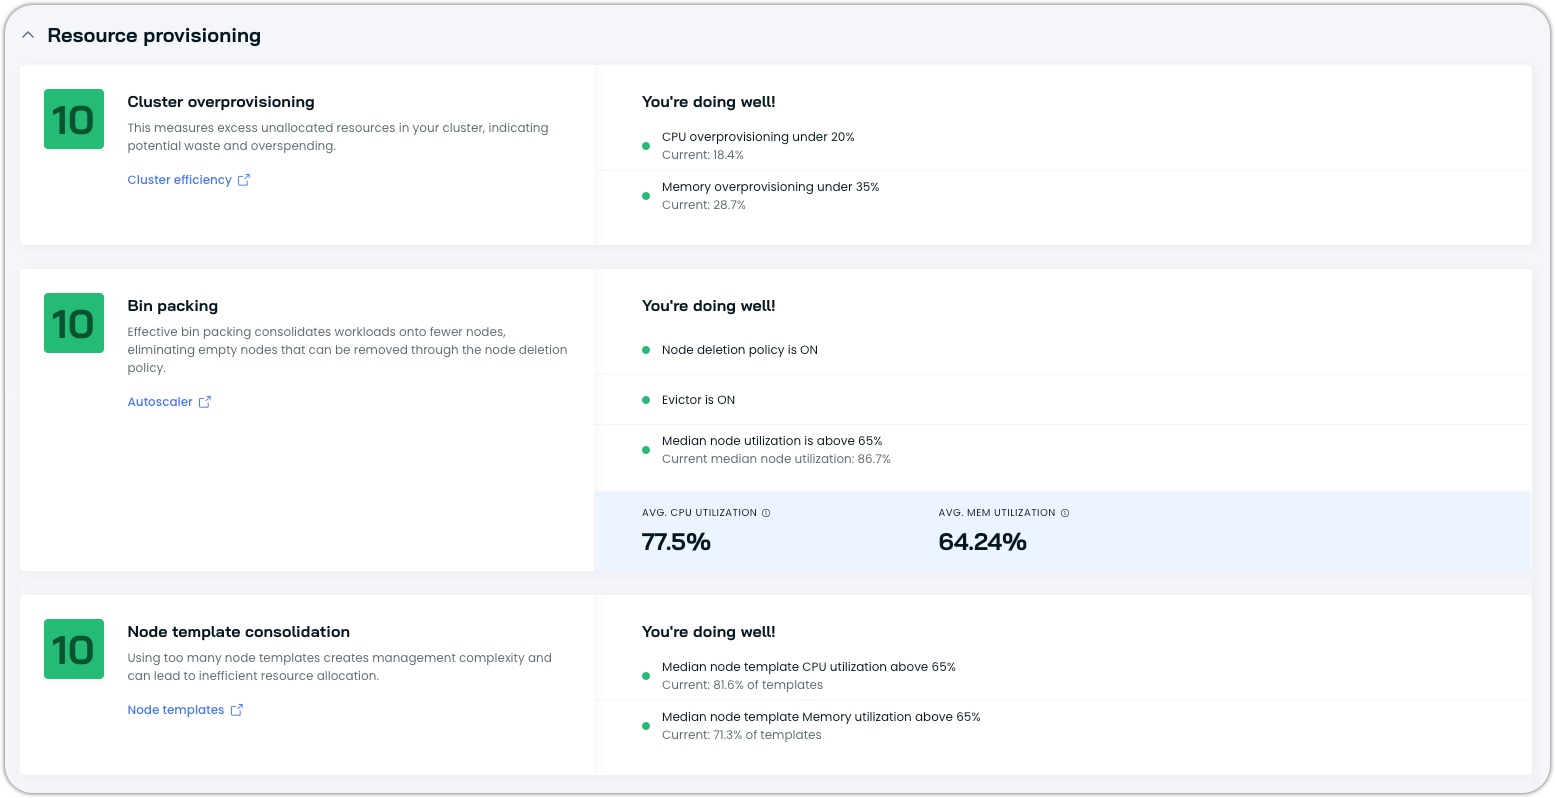
Cluster Overprovisioning
Evaluates unused allocated resources in your cluster.
| Score | Status | Description |
|---|---|---|
| 7-10 | Healthy | CPU overprovisioning is under 20%, and memory overprovisioning is under 35%. |
| 4-6 | Concerning | CPU or Memory overprovisioning slightly above target thresholds. |
| 0-3 | Poor | Significant overprovisioning indicates wasted resources. |
NoteThe score ranges that correspond with each status are approximate.
How to improve:
- Turn on the Unscheduled pods policy to match node sizes to workload requirements better
- Use the Evictor to consolidate pods and remove empty nodes
- Consider Rebalancer to replace overprovisioned nodes with right-sized ones
Bin Packing
Measures how effectively pods are consolidated onto fewer nodes.
| Score | Status | Description |
|---|---|---|
| 7-10 | Healthy | The node deletion policy is On, Evictor is On, and the median node utilization is above 65%. |
| 4-6 | Concerning | One or more bin packing features are not yet turned on, or median node utilization is low. |
| 0-3 | Poor | Bin packing features are disabled, leading to resource fragmentation and poor node utilization. |
How to improve:
- Enable the Node deletion policy to remove empty nodes
- Turn on the Evictor to consolidate workloads onto fewer nodes
- Configure the Evictor with appropriate settings for your workload patterns
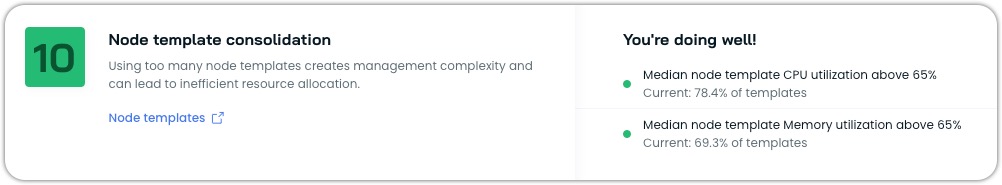
Node Template Consolidation
Assesses if you're using too many node templates, which can lead to management complexity and inefficient resource allocation.
| Score | Status | Description |
|---|---|---|
| 7-10 | Healthy | Using an optimal number of node templates with resource utilization above 65% across all templates. |
| 4-6 | Concerning | Slightly too many node templates based on moderate utilization. |
| 0-3 | Poor | Excessive node templates significant underutilization and fragmentation. |
How to improve:
- Consolidate similar node templates
- Use the default template for general-purpose workloads
- Create specialized templates only for workloads with specific requirements
Workload Resource Optimization
This category evaluates how well your workload resource requests match actual usage and how effectively you've configured resource management settings.
Resource Utilization
Measures if your workloads are requesting appropriate resources compared to their actual needs and how efficiently they are being used.
| Score | Status | Description |
|---|---|---|
| 7-10 | Healthy | Strong CPU and memory utilization rates, most workloads have resource requests properly configured, and minimal use of CPU limits. |
| 4-6 | Concerning | Moderate CPU and memory utilization and resource request/limit coverage. |
| 0-3 | Poor | Low CPU and memory utilization, indicating significant overprovisioning, many workloads missing resource requests, or excessive CPU limits restricting performance. |
How to improve:
- Increase resource utilization by right-sizing workload requests to match actual usage patterns
- Ensure workloads have explicit resource requests set
- Minimize CPU limits, targeting fewer than 10% of workloads with limits, to prevent throttling and improve performance
- Consider using the Workload Autoscaler to adjust resource requests based on actual usage automatically
Workload Optimization
Evaluates the usage of Cast AI's Workload Autoscaler to automatically right-size workload resources.
| Score | Status | Description |
|---|---|---|
| 7-10 | Healthy | Workload Autoscaler is enabled, and it optimizes most workloads. |
| 4-6 | Concerning | Workload Autoscaler is enabled, but most workloads are not being optimized. |
| 0-3 | Poor | Workload Autoscaler is disabled or optimizing very few workloads. |
How to improve:
- Turn on the Workload Autoscaler
- Configure appropriate scaling policies or use default ones supplied by Cast AI
- Ensure as many workloads are being optimized automatically as possible
Rebalancer
Assesses how effectively you're using Cast AI's Rebalancer to replace underperforming nodes.
| Score | Status | Description |
|---|---|---|
| 7-10 | Healthy | Regular rebalancing. |
| 4-6 | Concerning | Infrequent rebalancing. |
| 0-3 | Poor | No rebalancing was performed in the last 30 days. |
How to improve:
- Run rebalancing at least once every two weeks
- Configure scheduled rebalancing to automate it
Understanding Goal Tiers and Status Indicators
Each optimization area has two tiers of goals and three possible states indicated by colored dots:
| Color | Status | Description |
|---|---|---|
| 🔴 Red | Poor | The first-tier goal was not achieved. |
| 🟡 Yellow | Concerning | The first tier was achieved, but the second tier is yet to be achieved. |
| 🟢 Green | Healthy | Both first and second-tier goals were achieved. |
The text below each goal shows your current value relative to the target.