
Workloads
Learn how to use the Workloads report to analyze cluster costs, efficiency, workload grouping, and troubleshooting.
The Workloads report allows you to see your cluster costs broken down by workload. You can use this data to analyze compute expenses per workload or selected group of workloads, identify inefficiencies, and discover potential savings opportunities.
The Workloads report provides four different views:
- List of workloads with cost details per selected period,
- List of workloads with efficiency details,
- Individual workload cost details with daily history,
- Individual workload efficiency details with daily history.
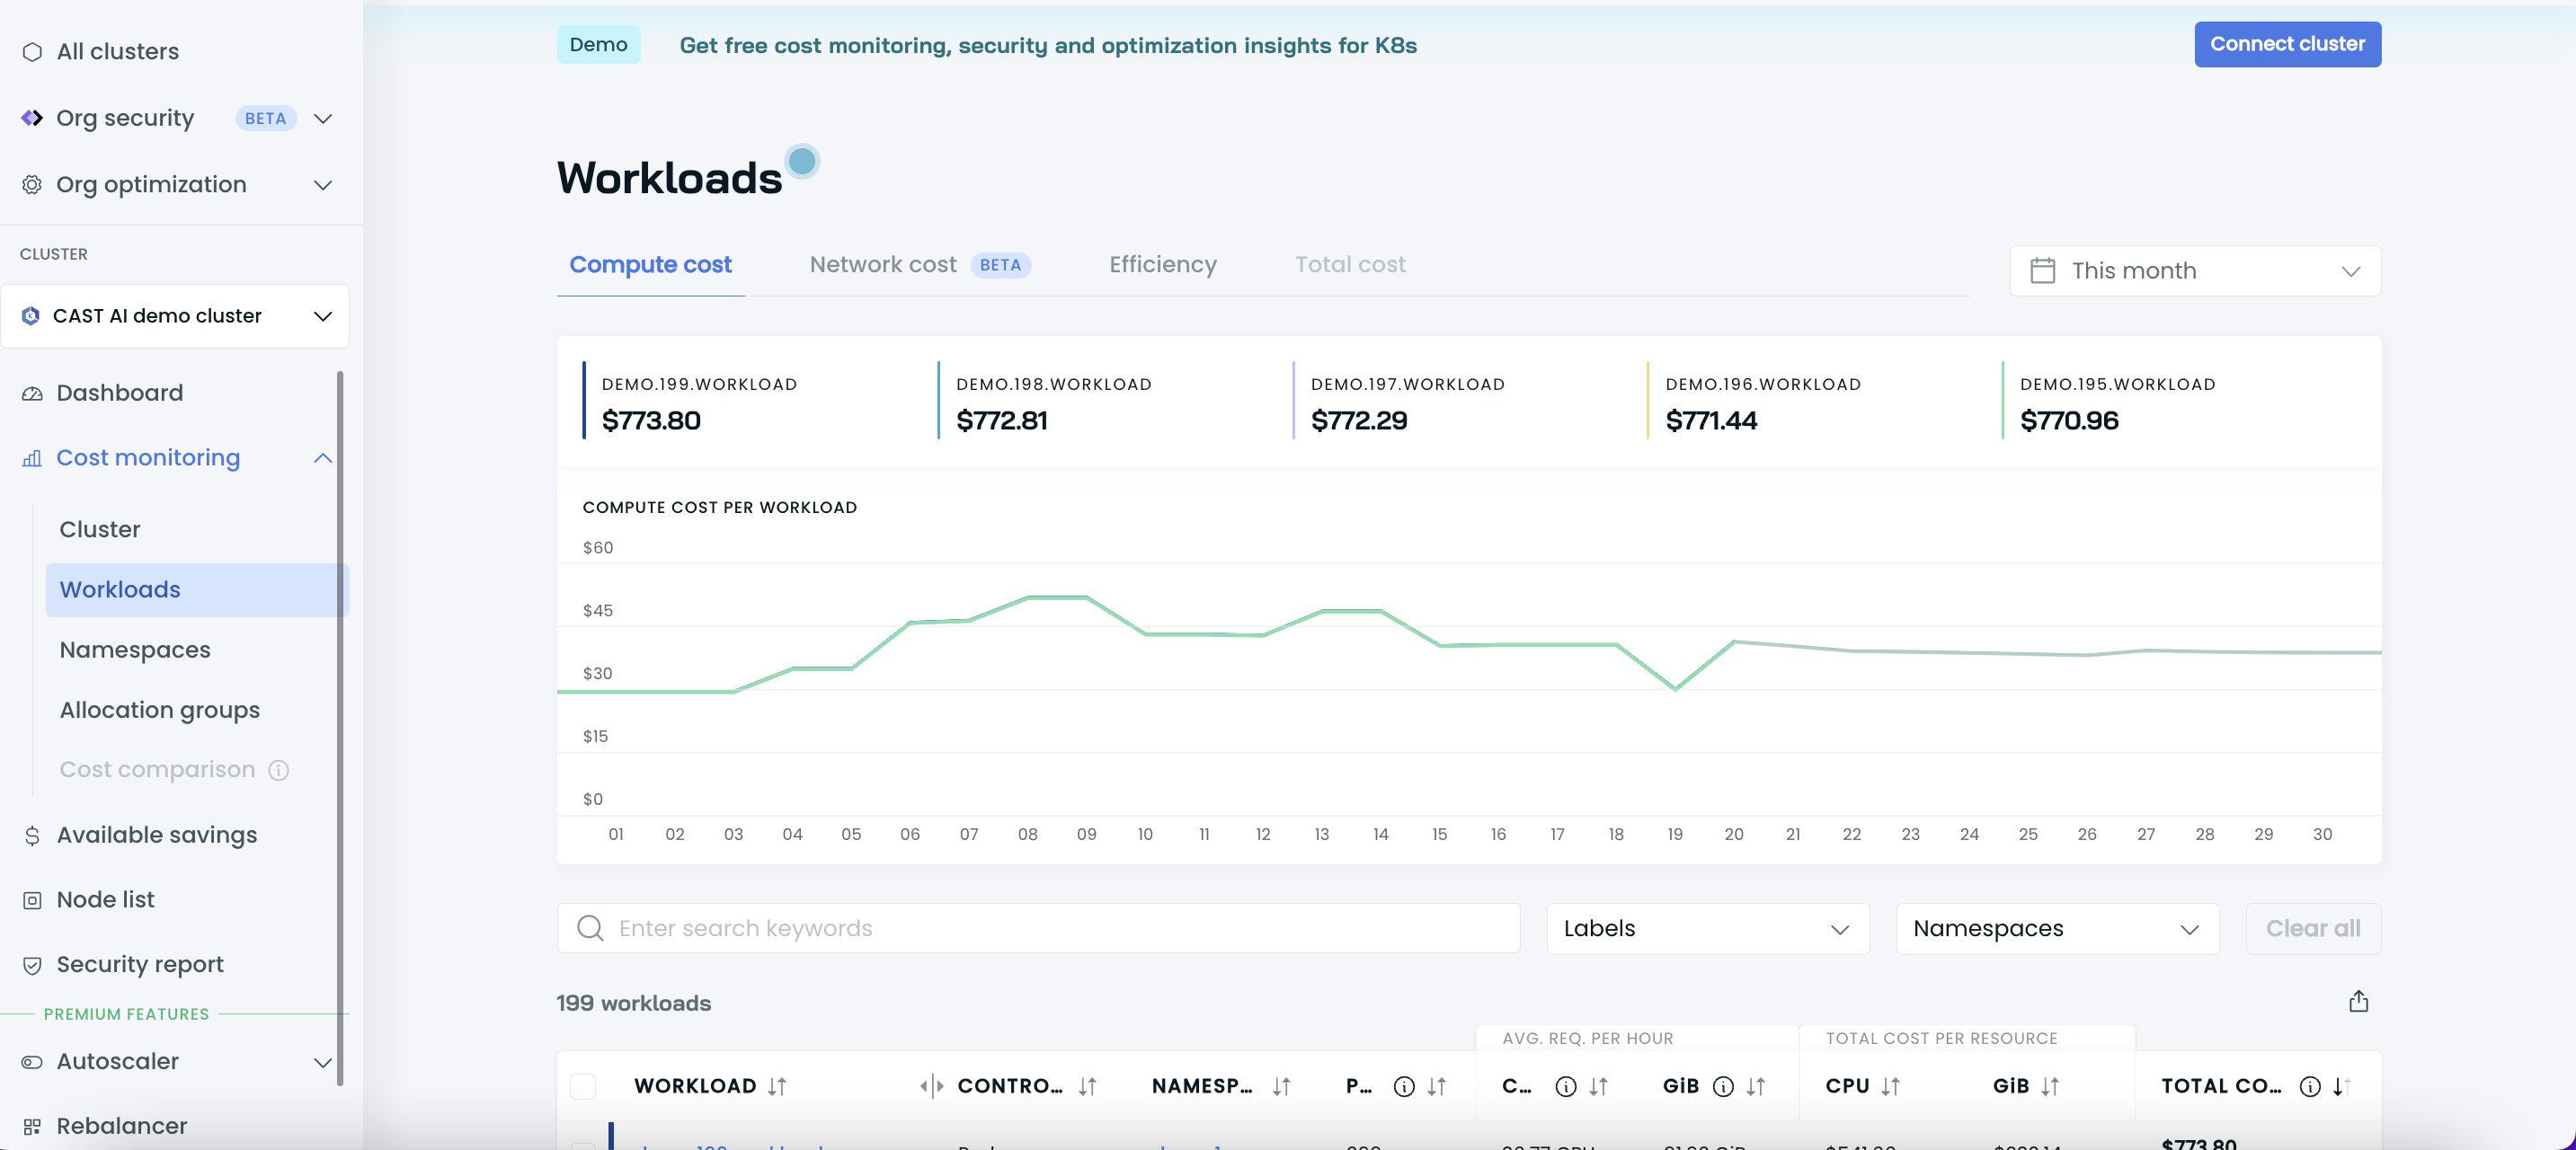
List of workloads with cost details per selected period
This is a list of all workloads in your cluster, together with their cost details shown within the period you chose.
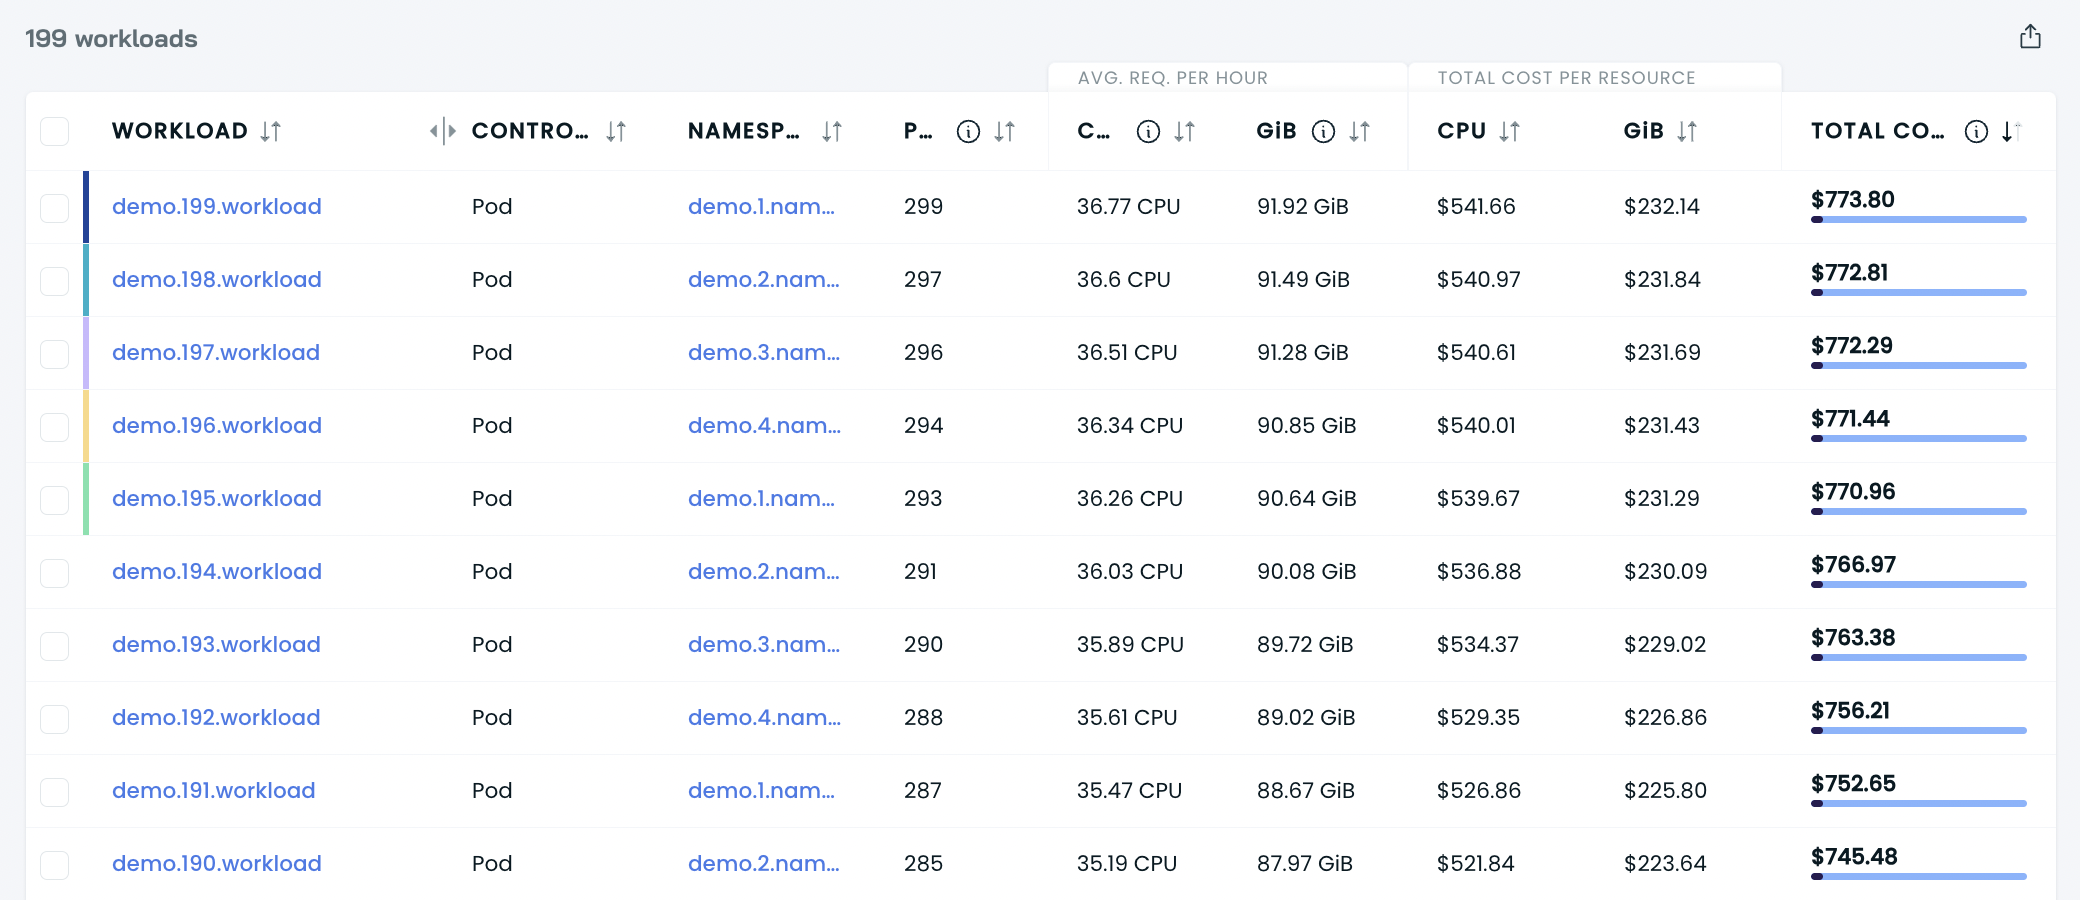
Each entry contains the following:
- workload name,
- workload controller type,
- namespace,
- average number of pods,
- average requested CPU per hour,
- average requested RAM per hour,
- total cost of CPU,
- total cost of RAM,
- the total cost of compute.
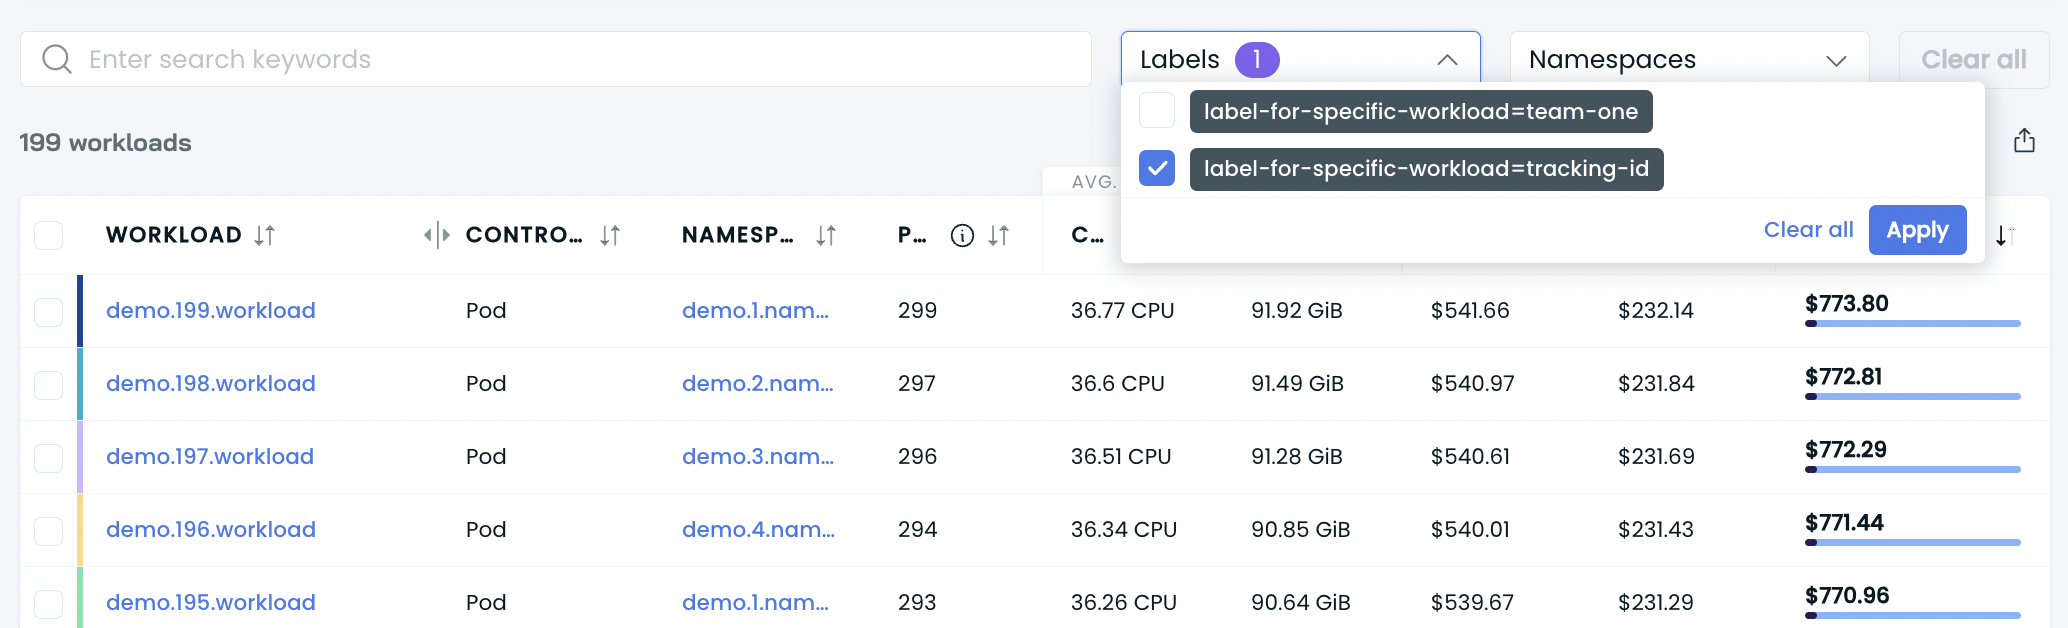
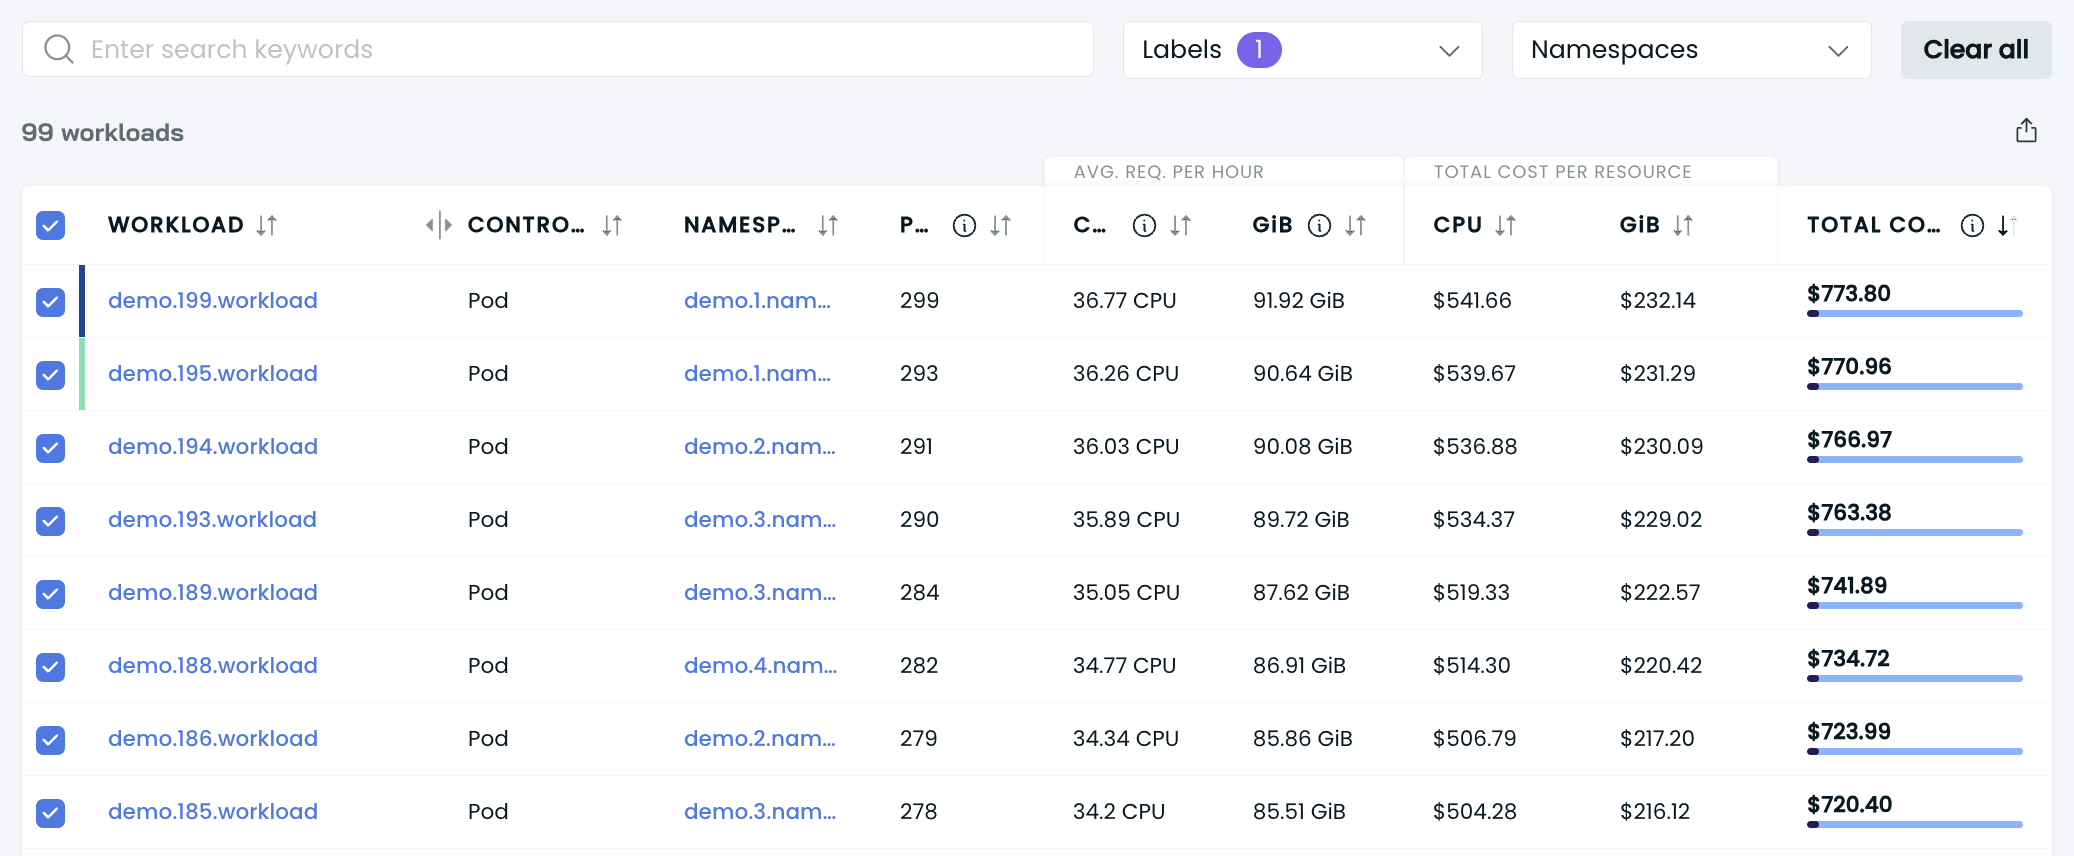
You can filter workloads by their labels and namespaces.
To see the total cost of multiple workloads, select the relevant workloads by ticking the box on the left side of the table. You’ll get the total cost data for this group of workloads at the bottom.
List of workloads with efficiency details
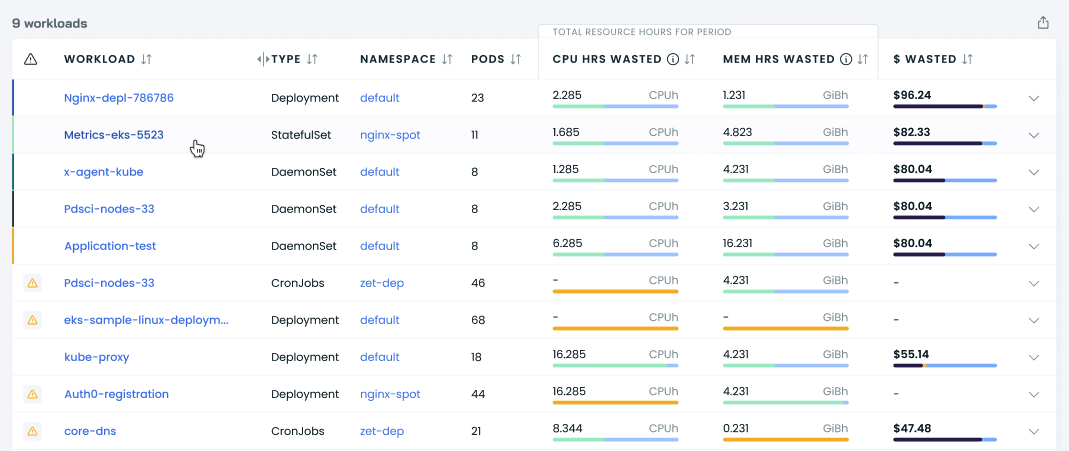
This is a list of all cluster workloads with their efficiency details per selected period.
Each entry contains the following:
- workload name,
- workload controller type,
- namespace,
- CPU hours wasted,
- memory hours wasted,
- $ wasted (the amount of money wasted, in US dollars).
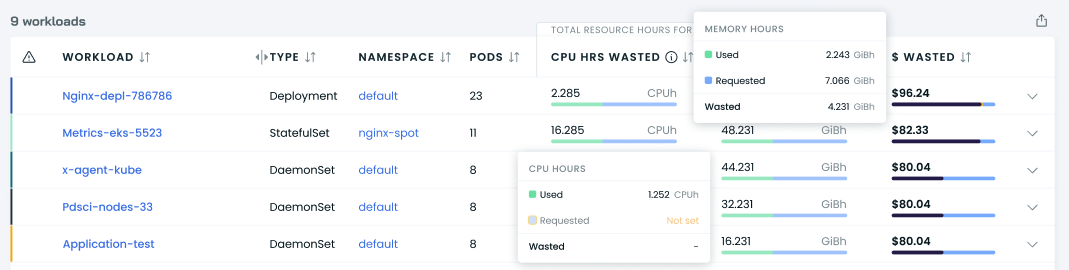
Each entry also contains the requested and used resource hours.
The metric we use here is resource hours, which corresponds to resources multiplied by hours of usage.
For example, if a workload with requests set to 2 CPUs runs for 48 hours during the selected period, its total requested CPU hours would be 96 CPU hours. If a workload's average CPU usage is 0.5 CPU during those 48 hours, its total usage is 24 CPU hours.
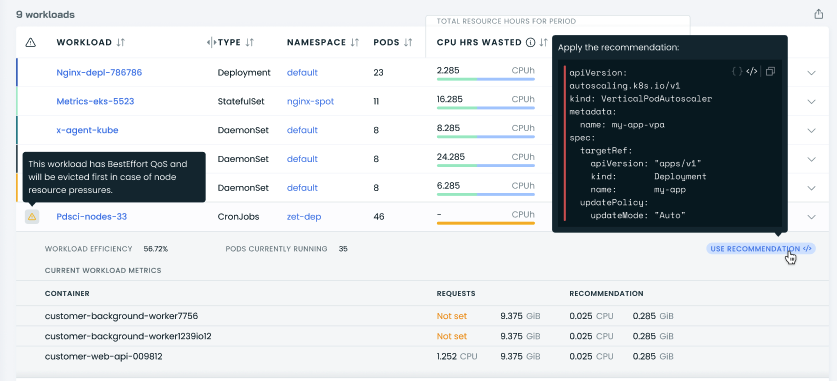
CAST AI managed mode customers can also use a quick recommendations patch that they can apply to their workload and change workload resource requests in line with our recommendations.
How do we calculate the wasted CPUs, RAM, and money?
To calculate the number of wasted CPU and RAM resources, we subtract the workload’s used resources from the total number of requested resources.
To follow the example above:
96 CPU hours - 24 CPU hours = 72 CPU hours
NoteFor better recommendations and information on efficiency, set the requests based on the workloads within your cluster.
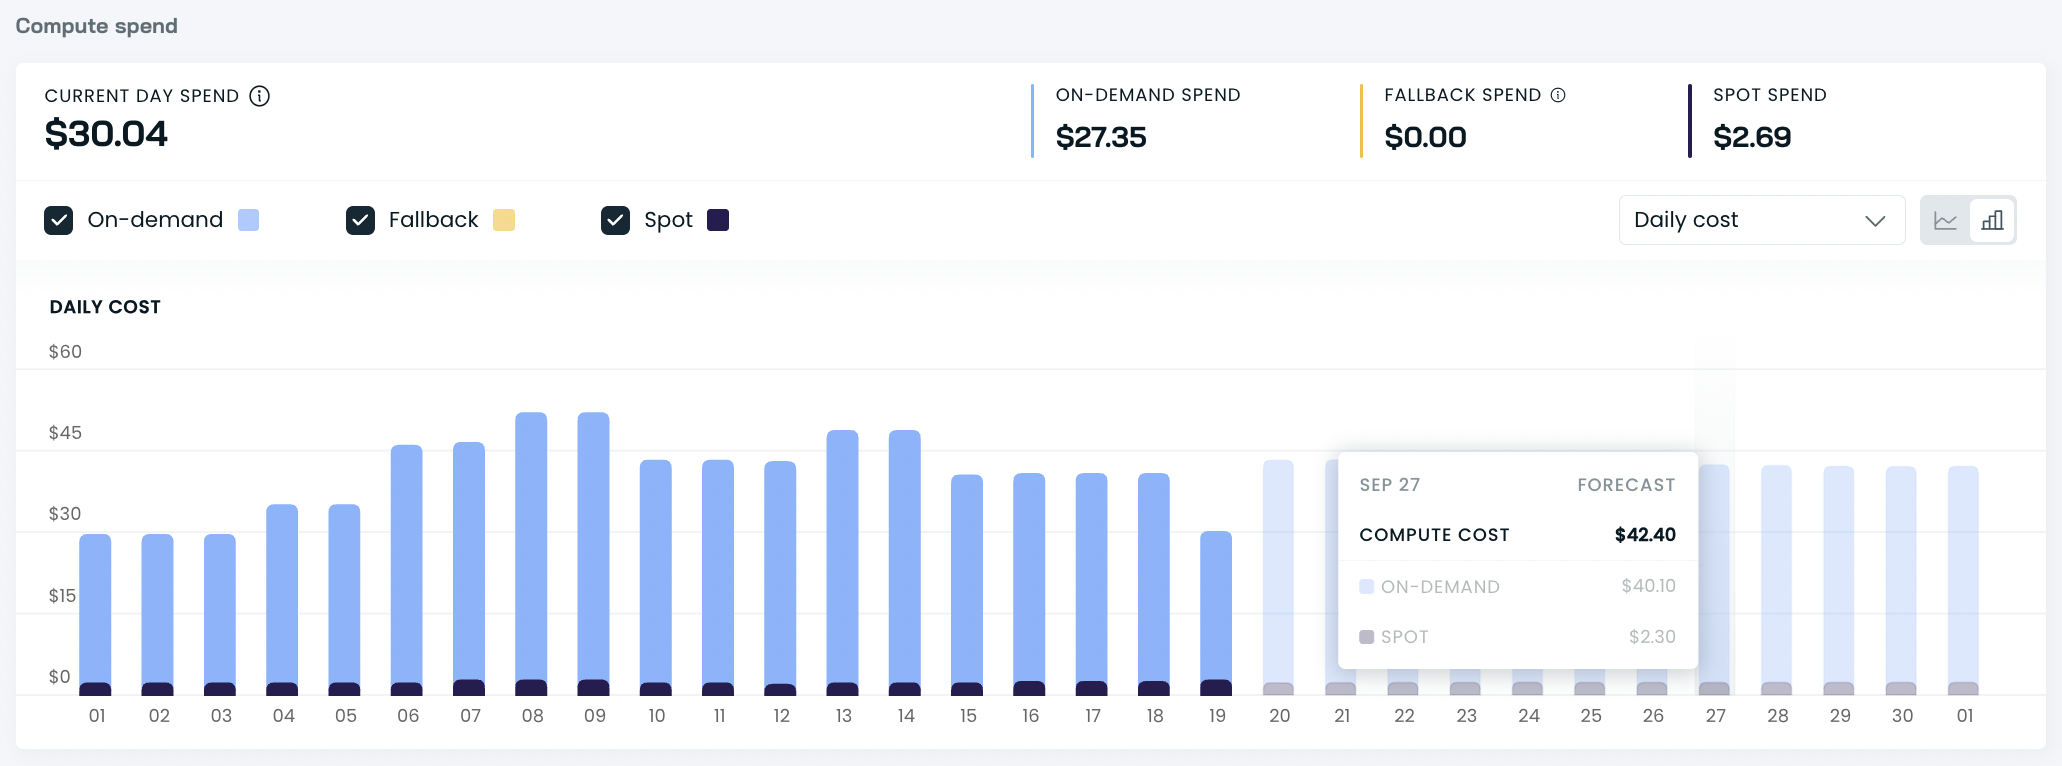
Individual workload cost details with daily history
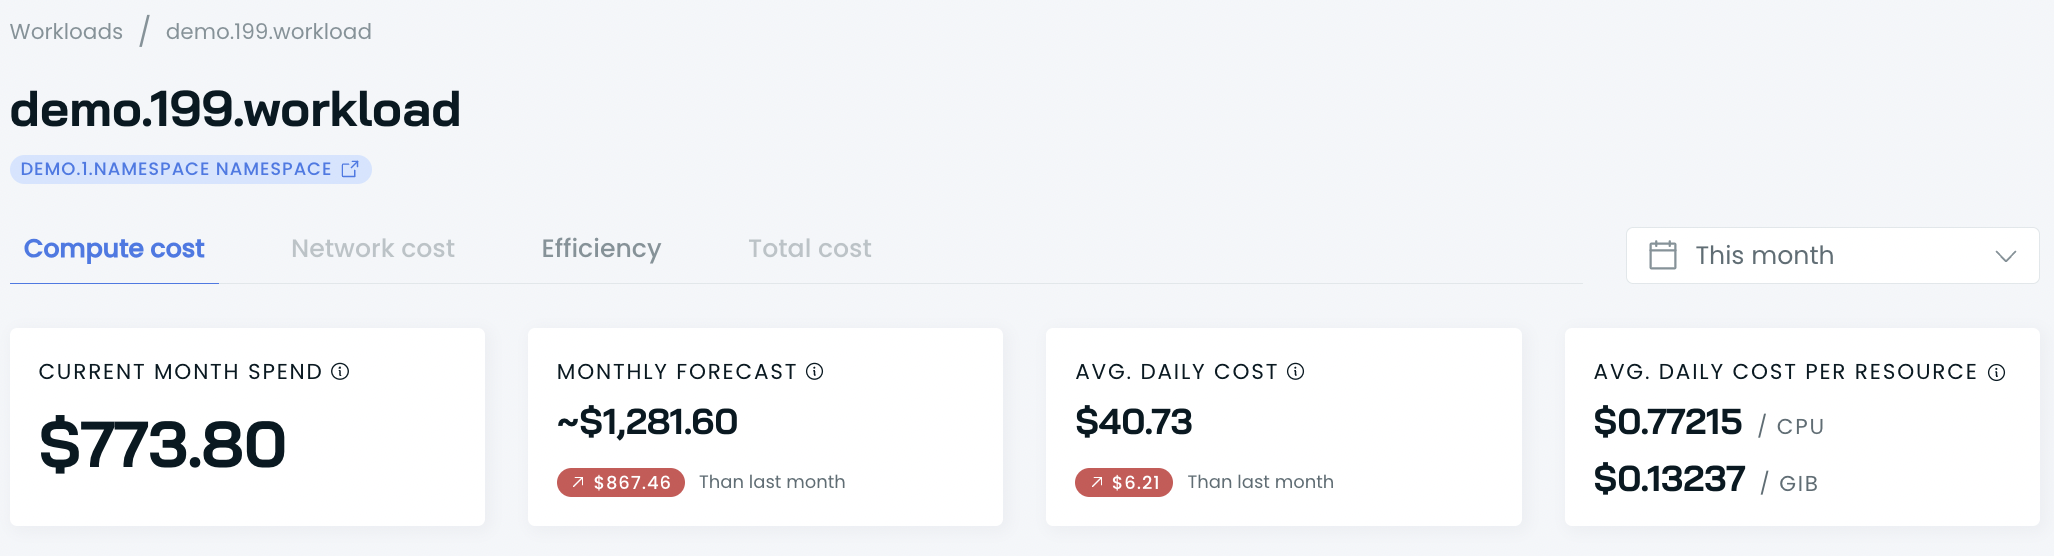
This report provides cost details and the history of a single workload within the selected period.
You get the following data:
- total spend,
- current month forecast,
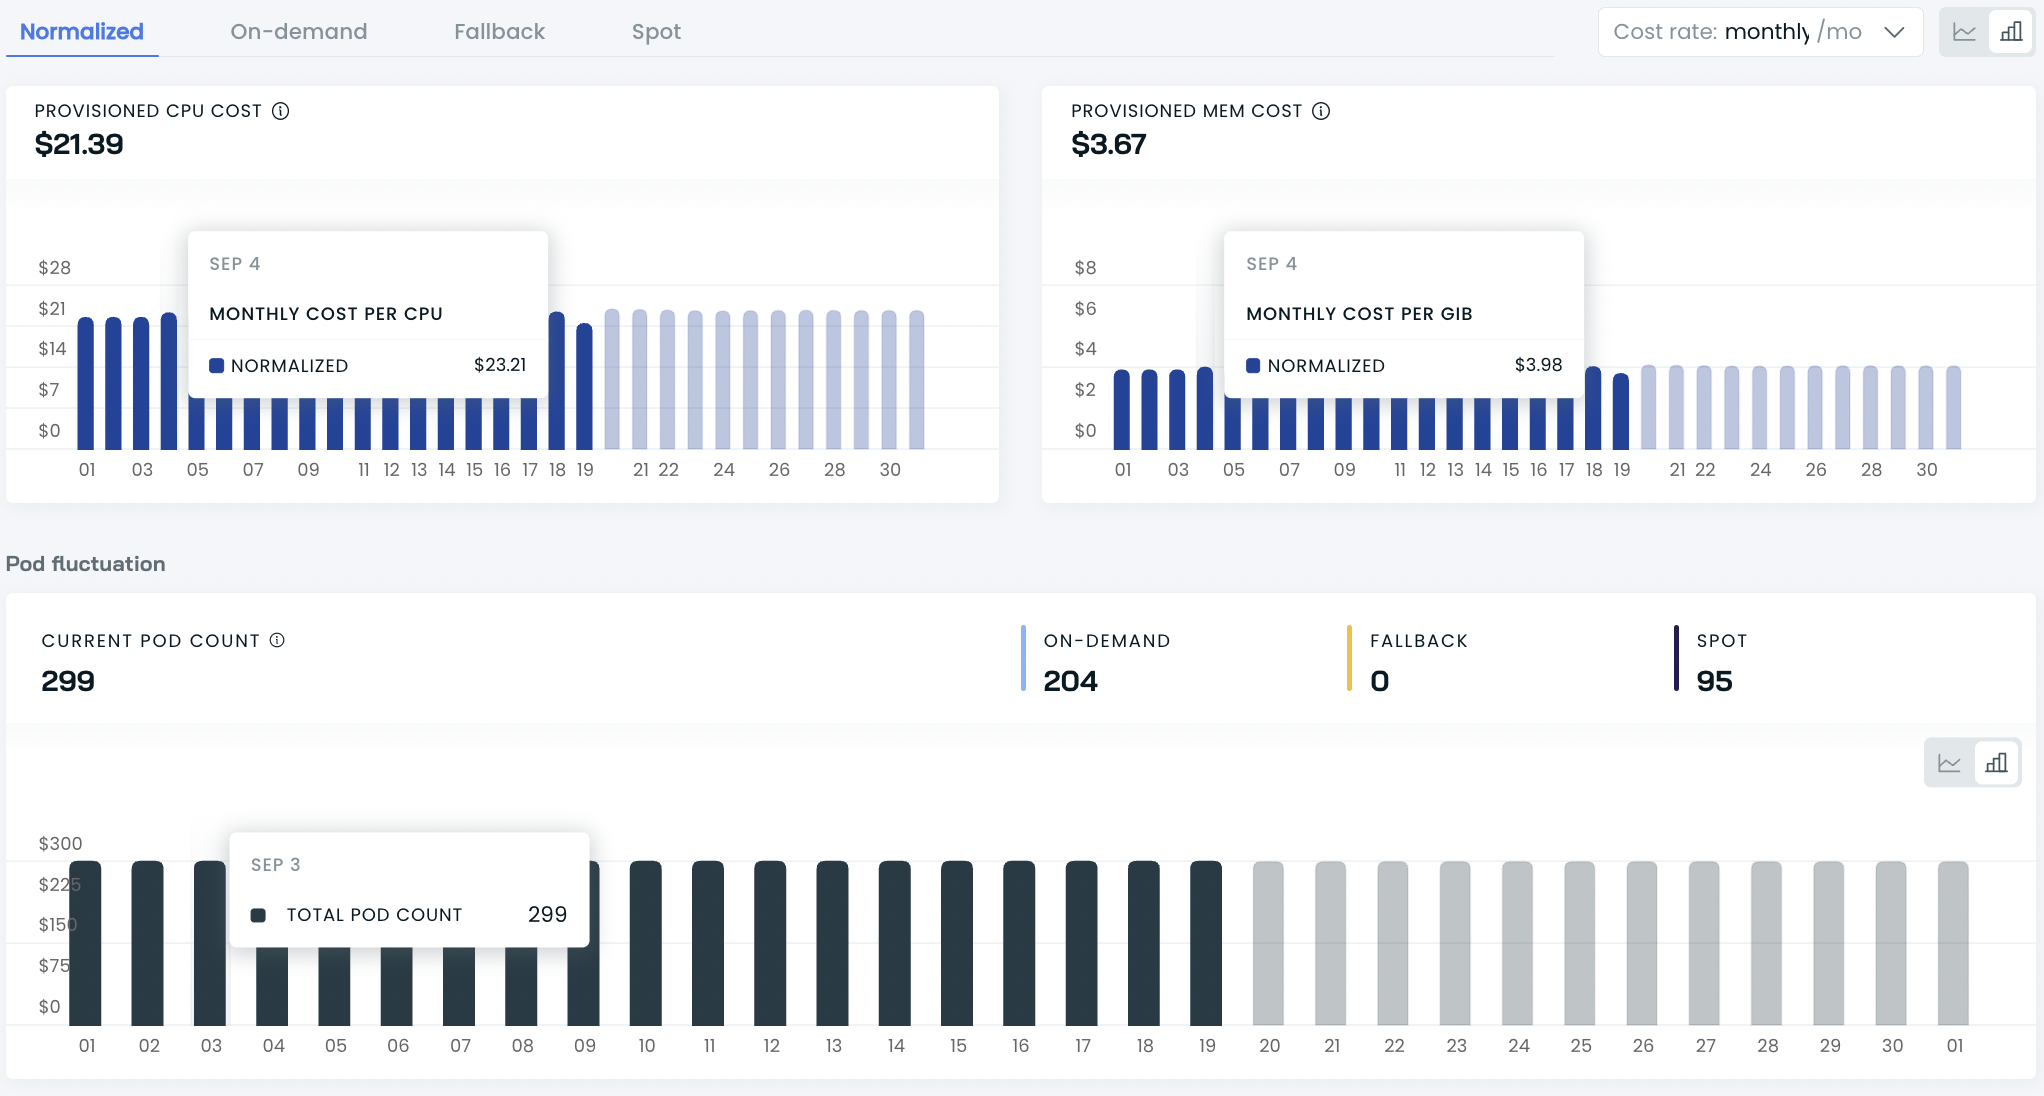
- average daily cost,
- average daily cost per resource (CPU and RAM).
Daily compute spend
You can also check the daily chart for compute spending per resource and per resource offering.
Daily cost history table
Daily cost history table with average pod count, cost per pod, amount of requested resources, cost per resource, and total cost.
Individual workload efficiency details with daily history
This report provides efficiency details for a single workload: both current and within the selected period.
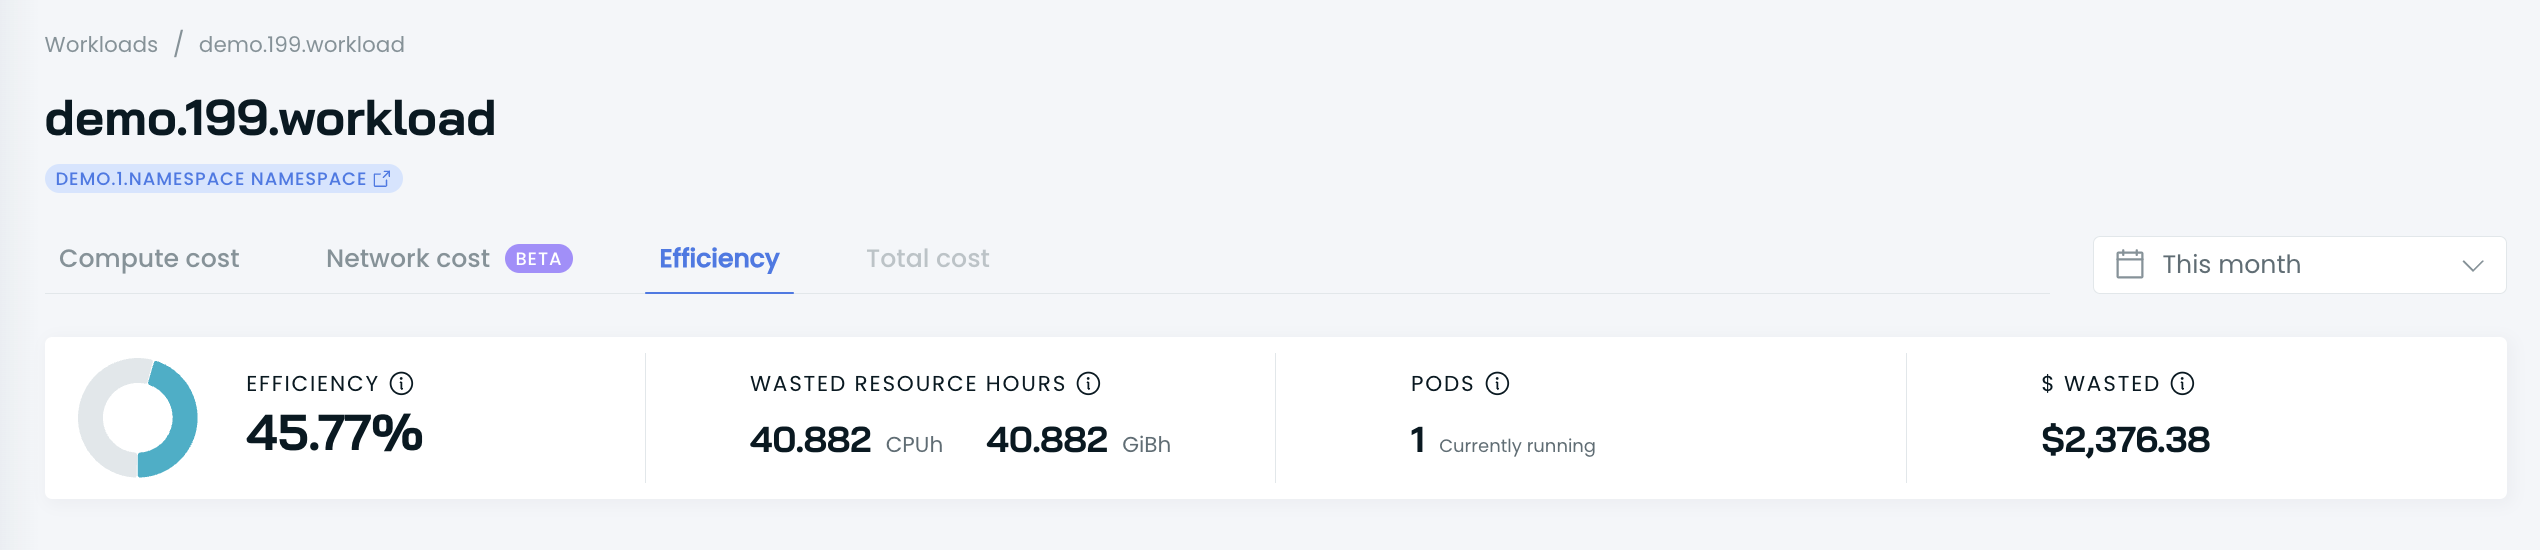
In the top section, the report provides efficiency details for a workload:
- Efficiency score in %
- Wasted resource hours both for CPU and memory
- $ wasted in US dollars
- Pod count that are currently running
Current workload efficiency
The current efficiency part provides current efficiency details per container:
-
resource requests,
-
resource usage,
-
rightsizing recommendation,
-
computed overall efficiency.
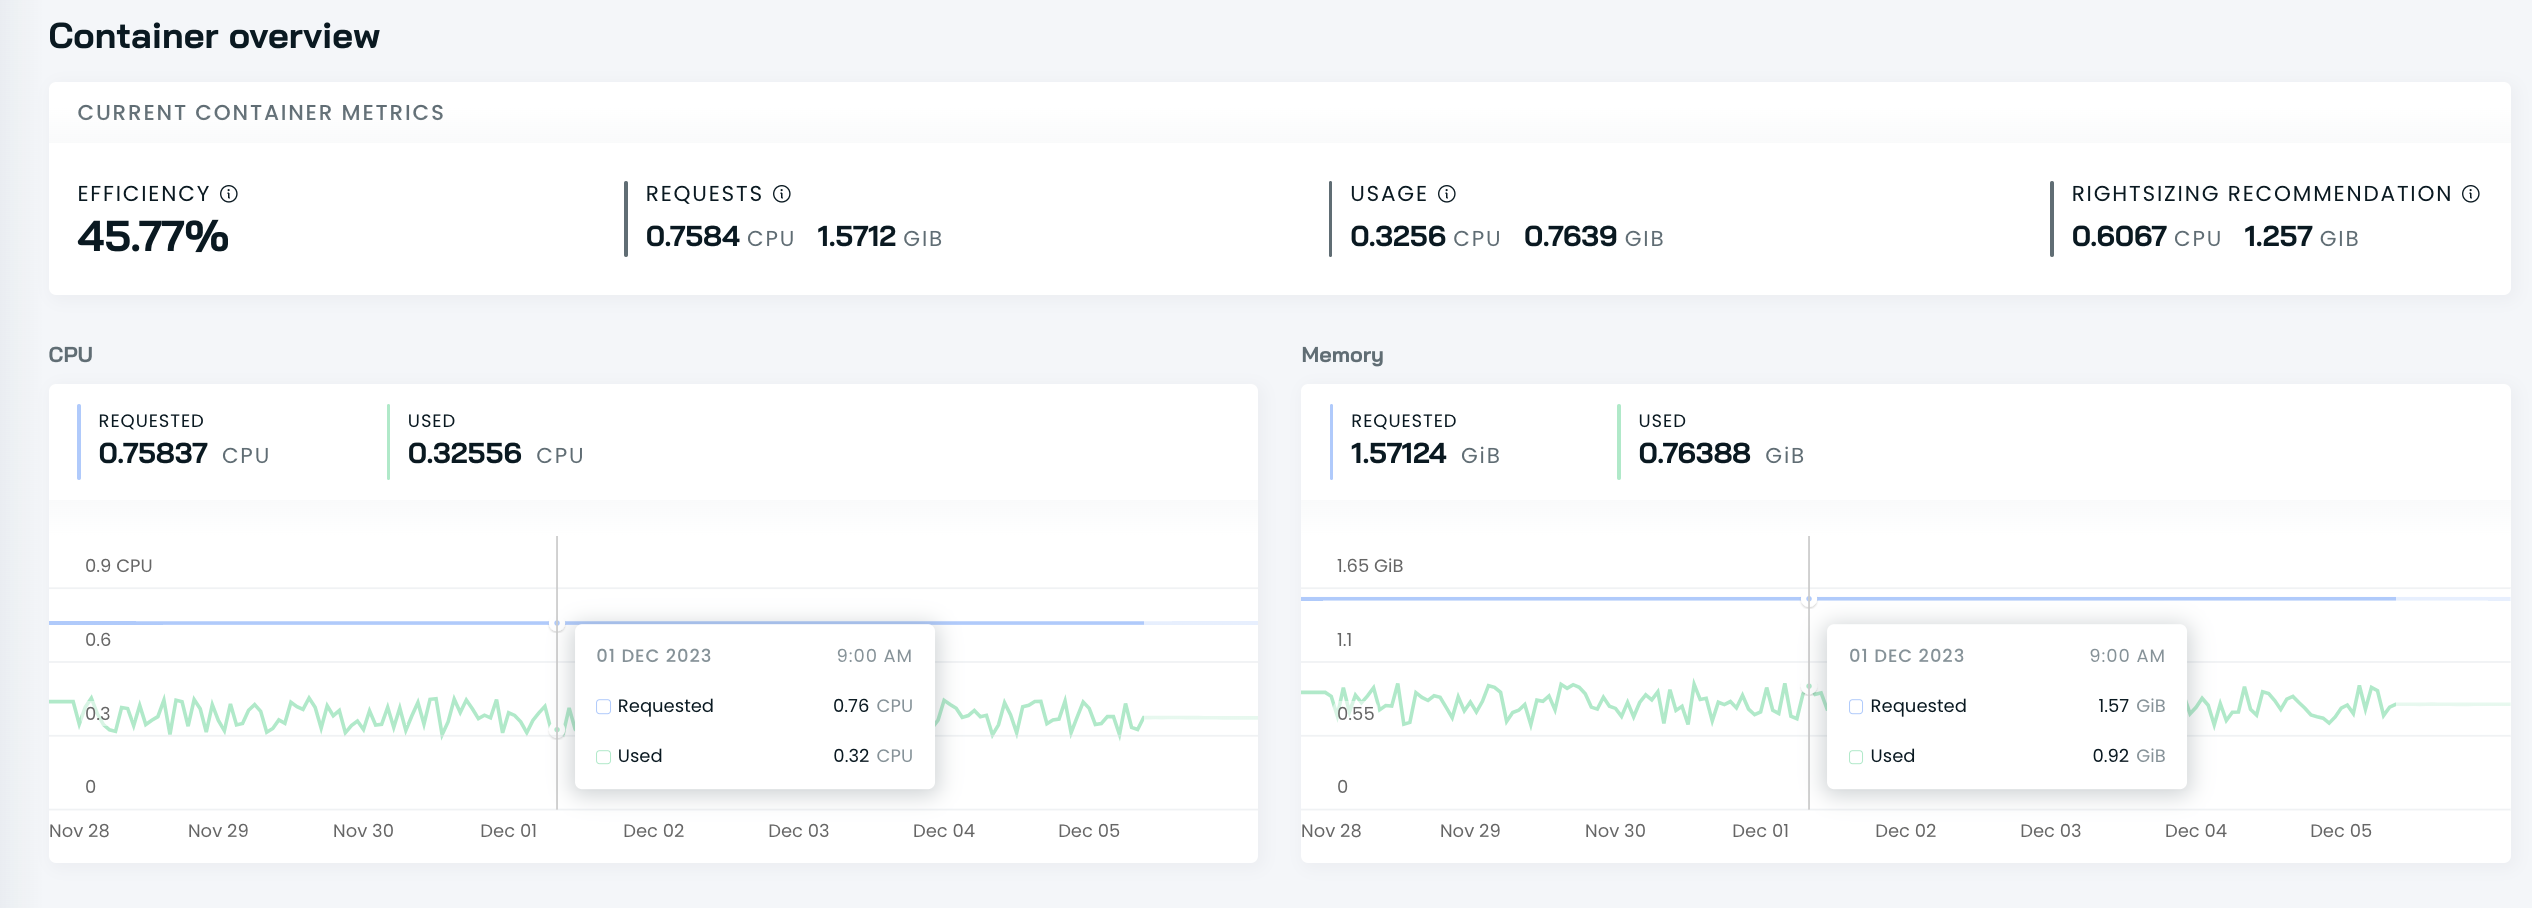
Computed efficiency is calculated by comparing resource requests against the recommended rightsized resource values. CPU is more expensive and has a larger impact on efficiency ratings. Learn more about CPU vs memory cost calculation.
For rightsizing recommendations, the Cost monitoring module analyzes the resource use of a container during the last 5 days and calculates the percentile value (95th percentile for CPU and 99th percentile for RAM).
NoteUsage metrics are based on metrics-server which in some rare cases could lead to incorrect CPU usage data due to Kernel bug. In case you experience such issue please consider upgrading metrics-server to v0.7.0 or above.
Workload grouping
Each line item in the workload report corresponds to a distinct workload running within the cluster. Typically, these workloads are represented by top-level Kubernetes objects, such as Deployments, DaemonSets, StatefulSets, etc.
CAST AI performs an analysis of all the pods and their associated controllers, identifying the top-level controller for each pod. It then aggregates all pods under their respective top-level controllers into a single entry in the workload report. This approach ensures a clear and organized representation of cluster workloads.
CAST AI supports default and well-known Kubernetes controllers. In instances where pods don't have an associated controller or if the controller is not recognized, it categorizes these pods under separate entries. This ensures comprehensive coverage and visibility of all Pods within the cluster, regardless of their controller status.
Issues with dynamic pods
In instances where clusters utilize unsupported controllers or frameworks that dynamically create pods for batch jobs or other operations, the default grouping mechanism will not work. This can lead to a significant number of separate entries in the workload report, each corresponding to an individual pod.
These short-lived pods will lack historical data and efficiency calculations, making it challenging to gauge their performance and cost impact accurately.
Add a label for custom workload grouping
To group pods into a single workload entry, add the workloads.cast.ai/custom-workload label to your pods. All pods sharing the same label value will be aggregated under a single workload row in the report.
This is the same label used by Workload Autoscaling for workload identification.
metadata:
  labels:
    workloads.cast.ai/custom-workload: "my-batch-job"
All pods with workloads.cast.ai/custom-workload: "my-batch-job" will appear as a single my-batch-job entry in the Workloads report.
Troubleshooting
Cannot access the Workloads Efficiency tab
It could be the case that the Cast AI agent cannot discover and poll metrics from the Metrics Server.
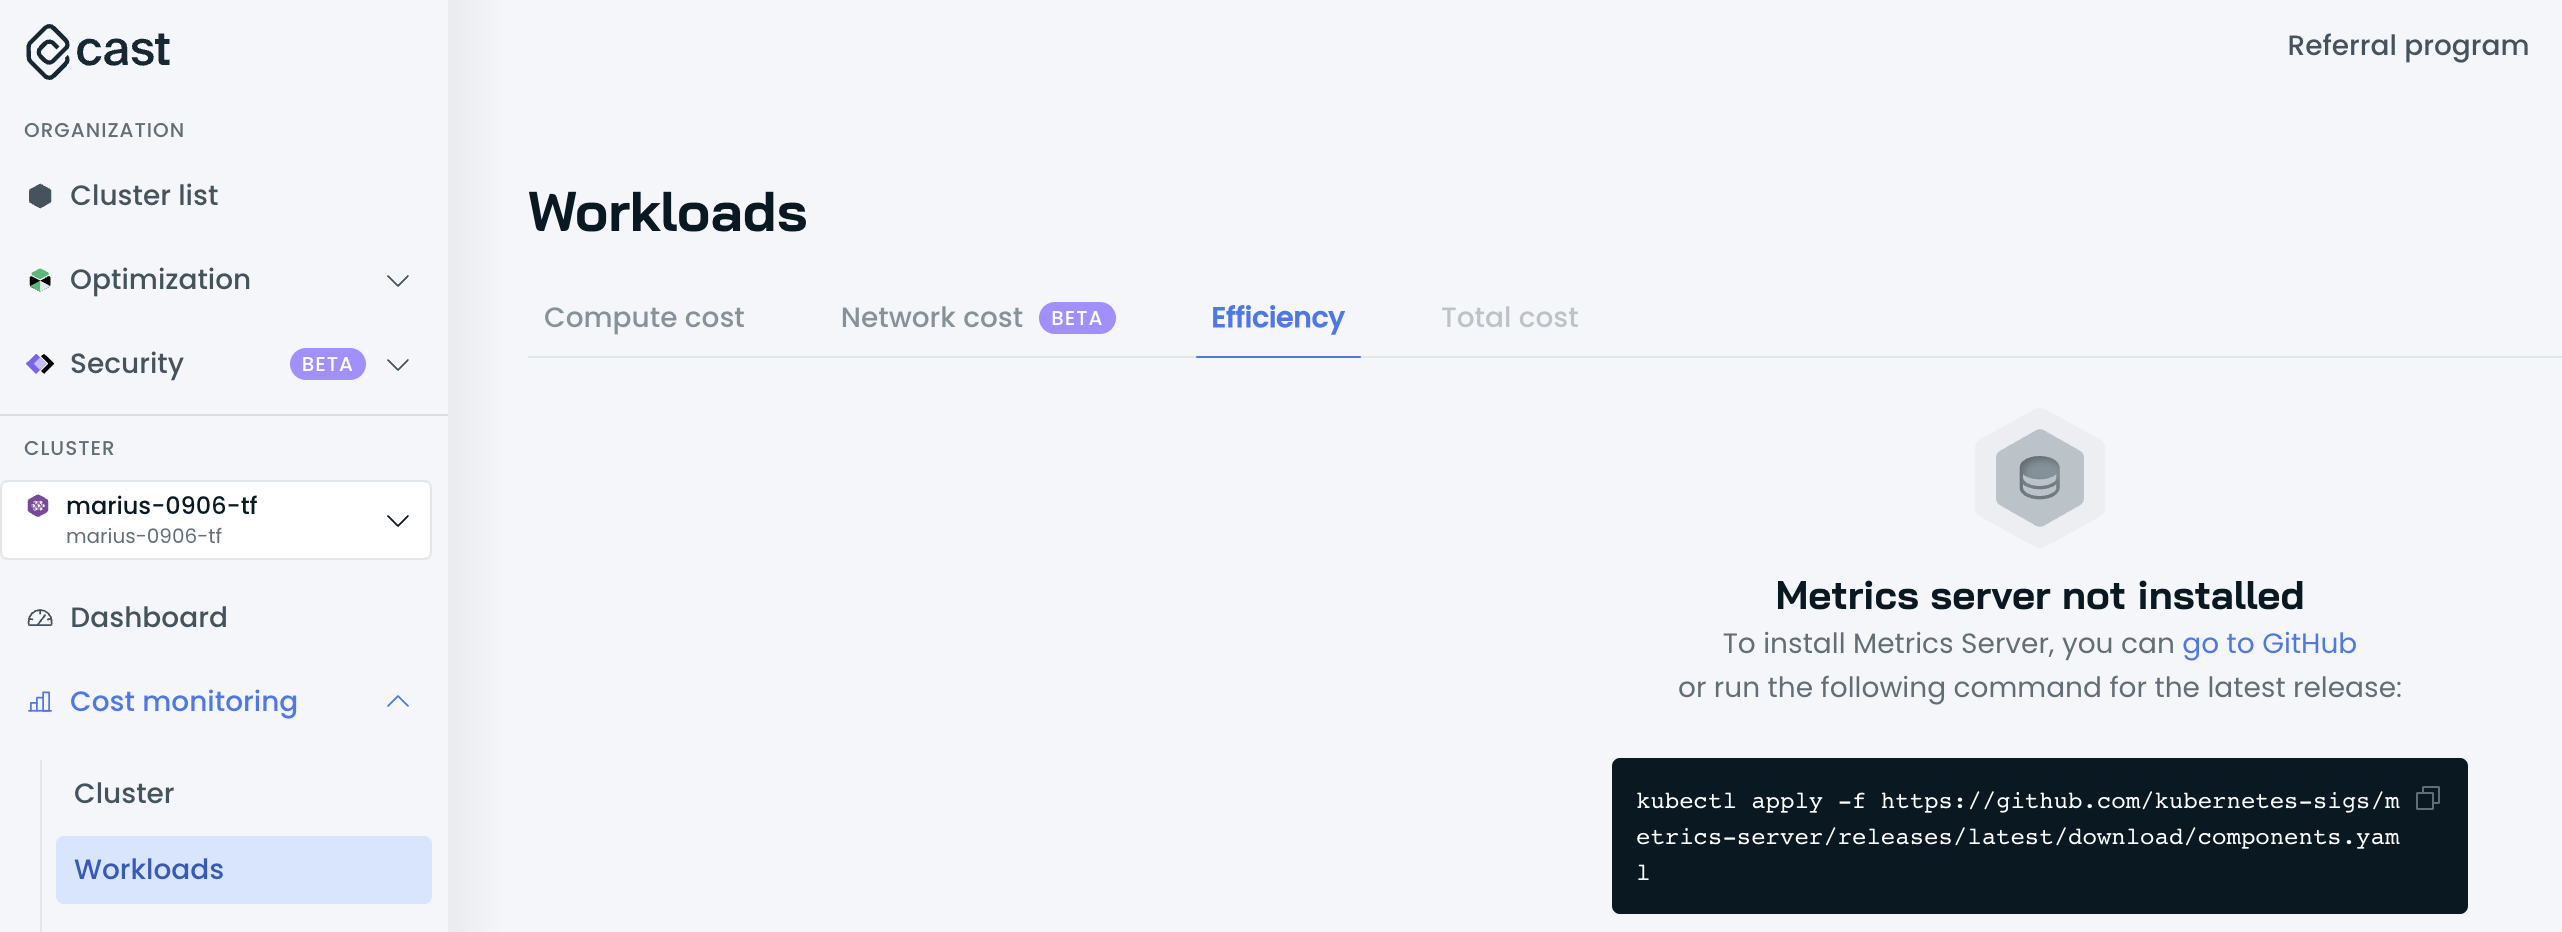
Validate whether the Metrics Server is running and is accessible by running the following commands:
kubectl get deploy,svc -n kube-system | egrep metrics-serverIf Metrics Server is installed, the output is similar to the following example:
deployment.extensions/metrics-server   1/1     1            1           3d4h
service/metrics-server   ClusterIP   198.51.100.0   <none>        443/TCP         3d4h
If the Metrics Server is not running, follow the installation process here.
If the Metrics Server is running, verify that the Metrics Server is returning data for all pods by issuing the following command:
kubectl get --raw “/apis/metrics.k8s.io/v1beta1/pods”The output should be similar to the one below:
{“kind”:”PodMetricsList”,”apiVersion”:”metrics.k8s.io/v1beta1”,”metadata”:{},
“items”:[
  {“metadata”:{“name”:”castai-agent-84d48f88c9-44tr8”,”namespace”:”castai-agent”,”creationTimestamp”:”2023-03-15T12:28:12Z”,”labels”:{“app.kubernetes.io/instance”:”castai-agent”,”app.kubernetes.io/name”:”castai-agent”,”pod-template-hash”:”84d48f88c9”}},”timestamp”:”2023-03-15T12:27:36Z”,”window”:”27s”,”containers”:[{“name”:”agent”,”usage”:{“cpu”:”5619204n”,”memory”:”75820Ki”}}]}
]}
If no output or erroneous output is returned, review the configurations of your Metrics Server and/or reinstall it.
If those checks passed, look for any unavailable APIs with the following command:
kubectl get apiservicesAll API services must show True in the available column. Any that show False will need to be repaired if it's still in use by one of your workloads. If it is not still in use, the API service can be deleted.
If everything looks good, but you still cannot access the Workloads Efficiency tab, please contact our support.
Updated 6 days ago