
egressd (deprecated)
Deprecation NoticeThe
egressdcomponent is being phased out. Network traffic monitoring functionality has been integrated into thekvisoragent. For the latest network flow monitoring capabilities, please use kvisor instead. See the kvisor documentation for installation and configuration instructions, specifically the Network traffic monitoring section.
egressd is a Kubernetes-aware network traffic monitoring tool. It's open source, and you can find it on GitHub.
How it works
- A DaemonSet pod starts on each node.
- Conntrack entries are fetched for pods running on each node at a configured interval (5 seconds by default).
- If Cilium is used, contract records are fetched from eBPF maps located at host /sys/fs/bpf, which Cilium created.
- If you use the Linux Netfilter Conntrack module, then Netlink is used to get these records.
- Records are reduced by source IP, destination IP, and protocol.
- Kubernetes context is added, including source and destination pods, nodes, node zones, and IPs.
- The exporter can export logs to HTTP or Prometheus.
Installation
Add the Cast AI Helm charts repository.
helm repo add castai-helm <https://castai.github.io/helm-charts>
helm repo update\
Standalone
egressd is a standalone service that you can run without needing to communicate with the Cast AI platform. In this case, you will be able to get traffic insights written to any Prometheus-compatible TSDB by providing an exporter config, i.e.:
exporter:
  config: |
    exportInterval: 15s
    sinks:
      prom_sink:
        prom_remote_write:
          url: "<http://egressd-victoria:8428/api/v1/write>"
          headers:
            My-Optional-Header: my-header-value
See the docs for the actual url depending on your metrics component:
And then just install it using the following:
helm upgrade -i castai-egressd castai-helm/egressd -n castai-agent -f values.yamlAlternatively, you can just install a demo with preconfigured Grafana and Prometheus metrics:
curl -fsSL <https://raw.githubusercontent.com/castai/egressd/master/demo.sh> | bashOtherwise, if you want to get insights not only about traffic but also costs, you should additionally provide clusterID and apiKey.
helm upgrade -i castai-egressd castai-helm/egressd -n castai-agent \\
--set castai.clusterID=\<cluster_id> \\
--set castai.apiKey=\<api_key> \\
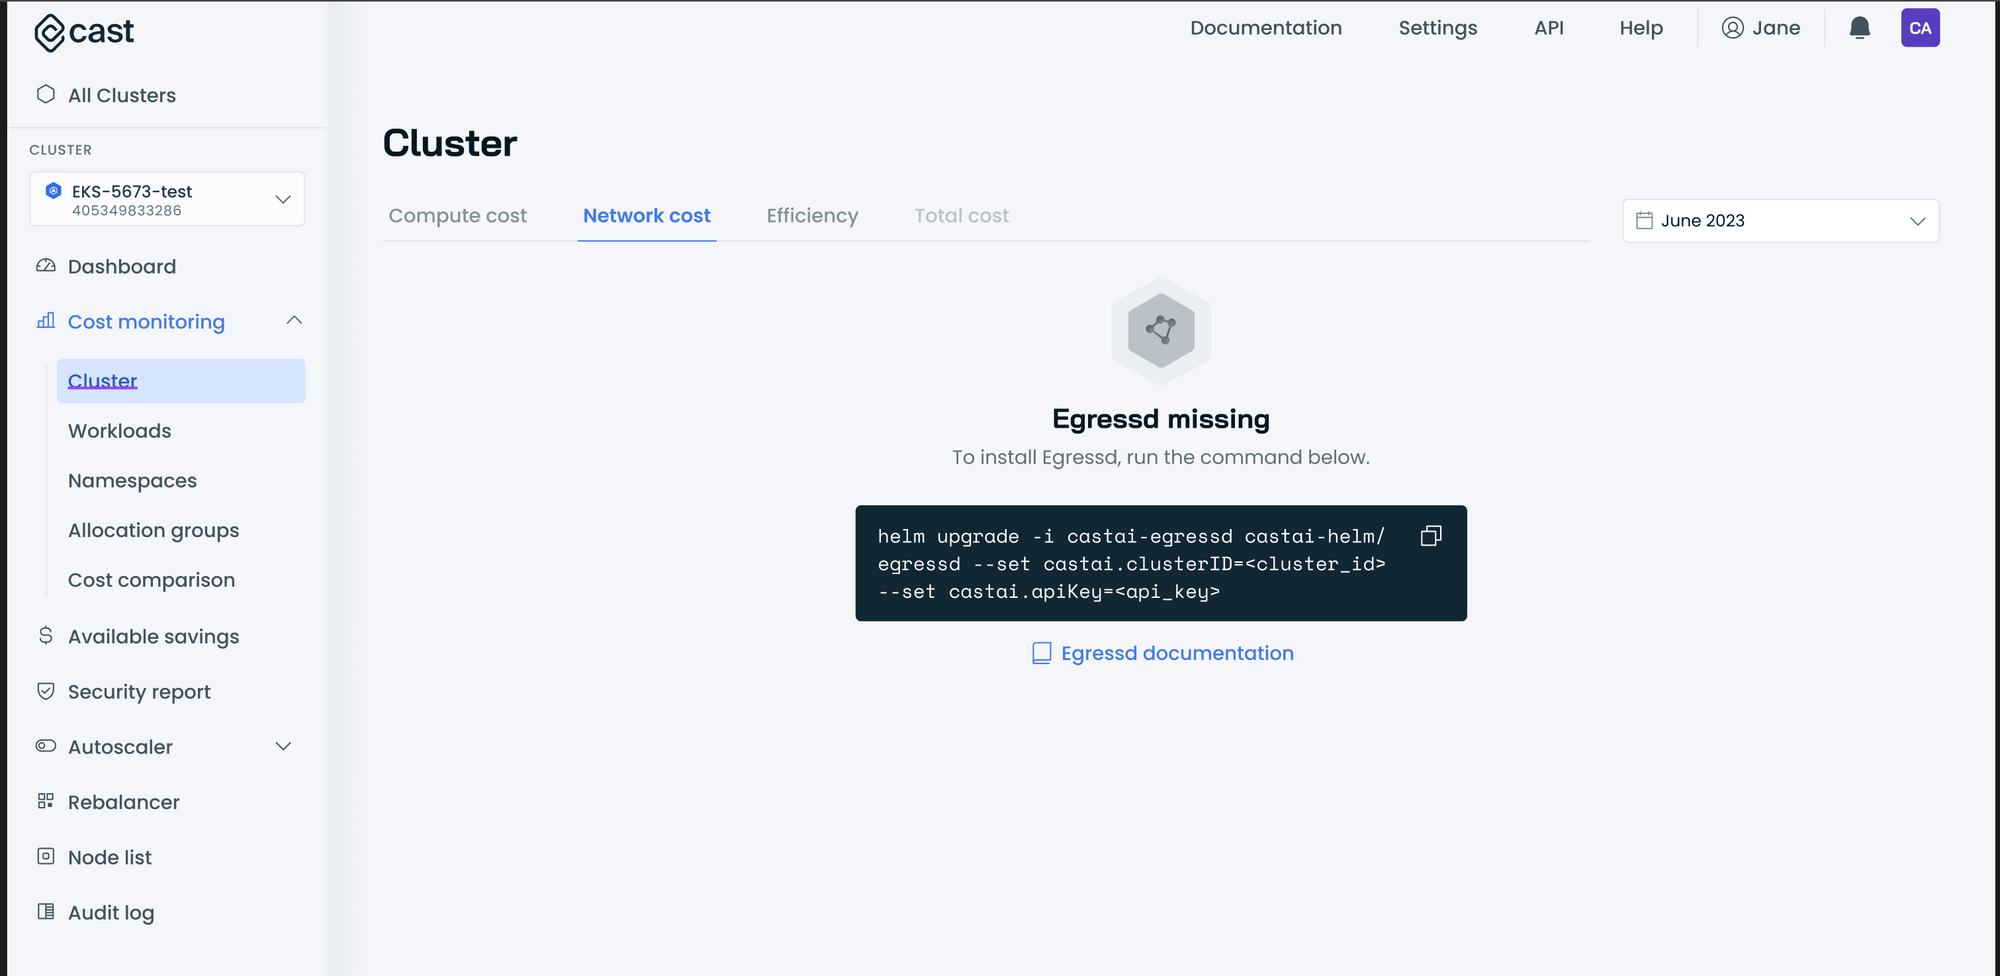
--set castai.apiURL=\<api_url>Or just follow the instructions on the Cast AI dashboard → Cost monitoring → Network cost tab.
Read more about it here: Network cost
Configuring features
You can change any of the supported config values described in the egressd Helm chart.
Likely, the two most interesting configurations you can change are:
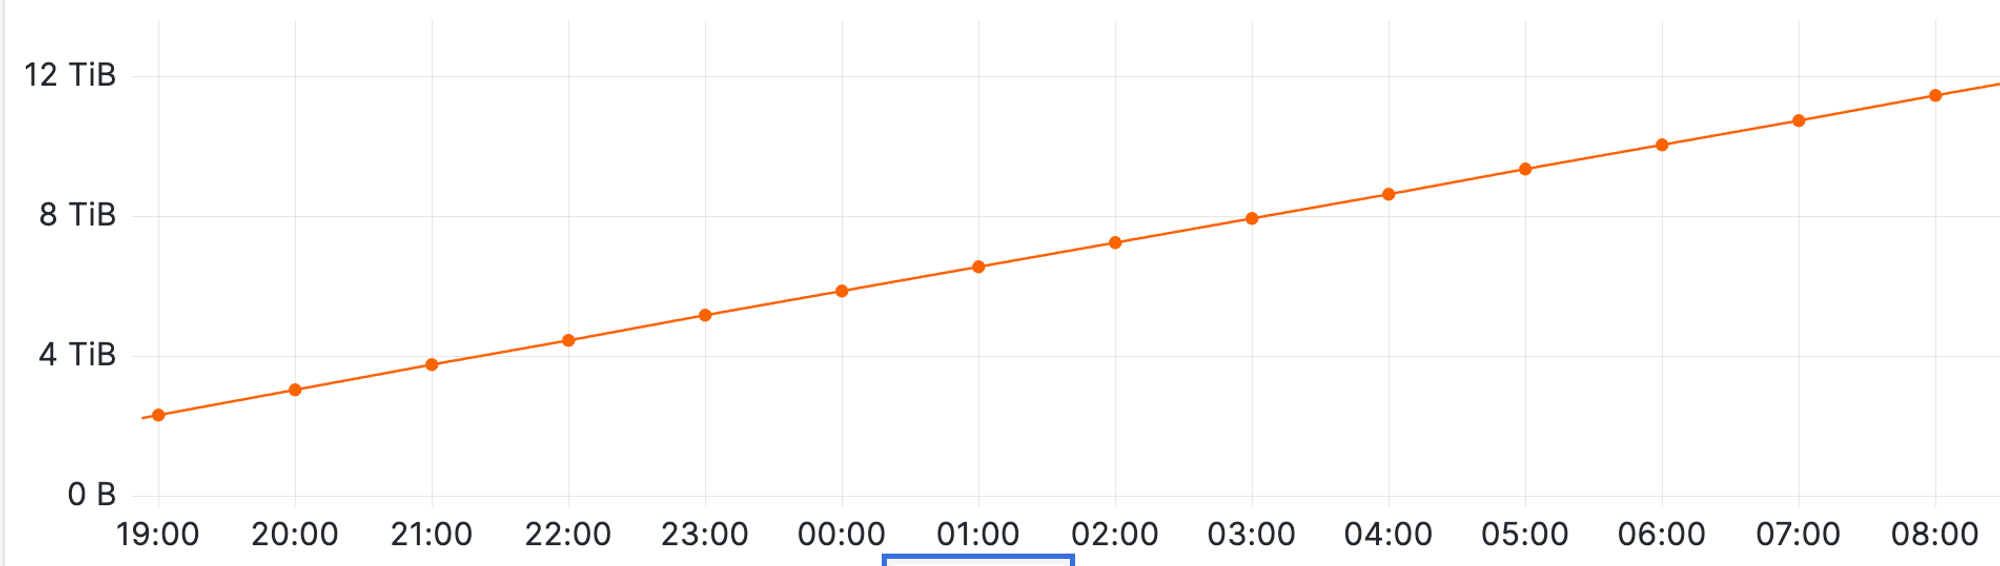
collector.extraArgs.group-public-ips- Group public IP destinations as 0.0.0.0. So by changing this flag, you can group all public traffic to the same 0.0.0.0 destination IP or track those public IPs separately. Note: when tracking public IPs separately, it could increase the number of metrics significantly if your cluster is sending a lot of public requests.collector.extraArgs.send-traffic-delta- Send the traffic delta between reads of the conntrack entry. When this option is false, then the traffic counter is sent by default.
For example, here is what traffic metrics look like when this option is false. We can see a constantly growing number (cumulative), which shows us how much data was transmitted at a specific time point:
Here is what metrics look like when this option is true, which means that we store only metrics about how much data was transferred since the last metrics scrape:
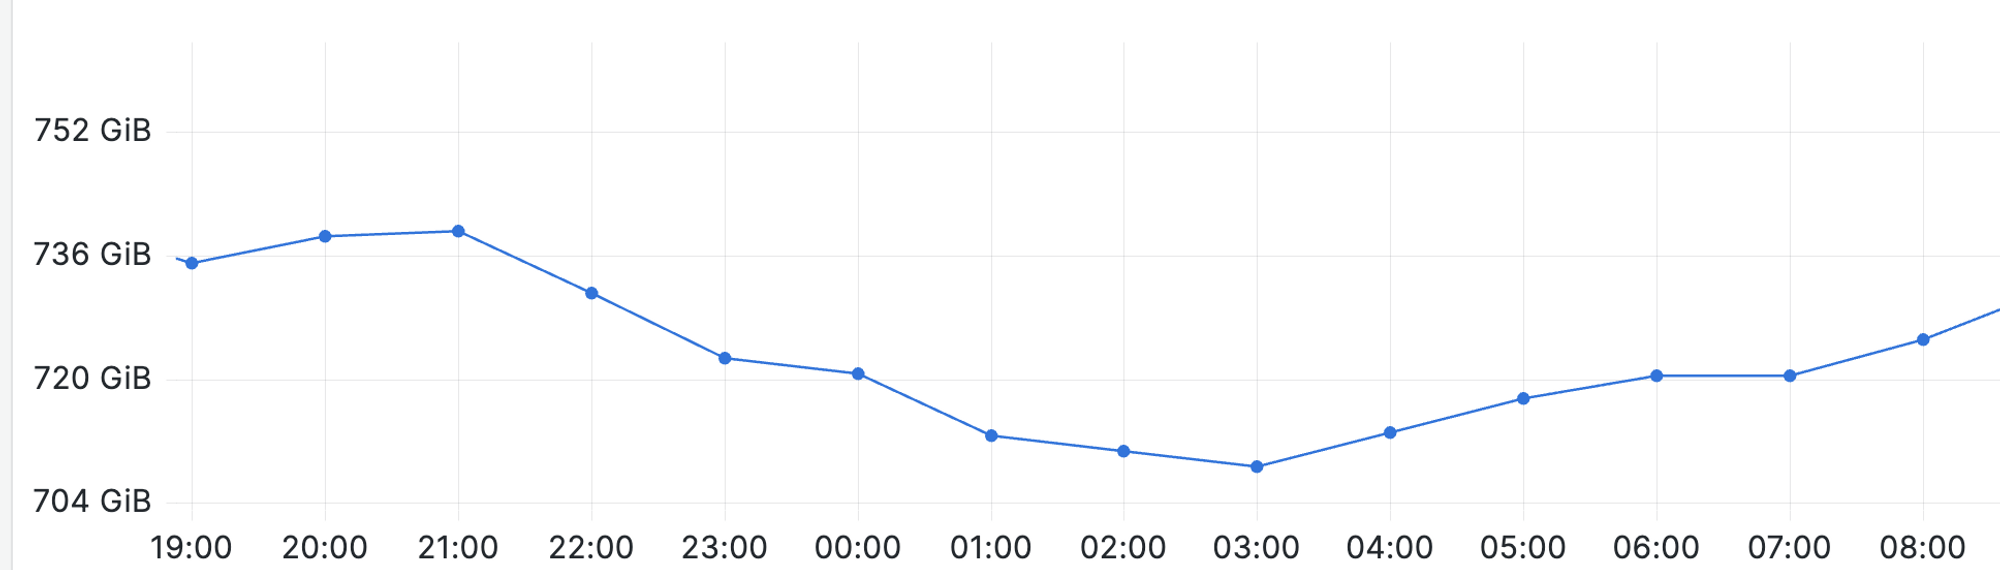
Note: If you want to use the Cast AI dashboard, you should always set this flag to true.