
Cost comparison
Quickly grasp how efficient your cluster is becoming over time.
Cost comparison is a powerful tool designed to help you understand and visualize the savings achieved through Cast AI optimizations. Comparing two periods provides insights into your cluster's efficiency improvements over time, factoring in both cluster autoscaler and Workload Autoscaler contributions to resource utilization and bringing your cluster costs down.
Access cost comparison
To access the cost comparison, do the following:
- Log in to the Cast AI console and select the cluster you wish to analyze from the Cluster list.
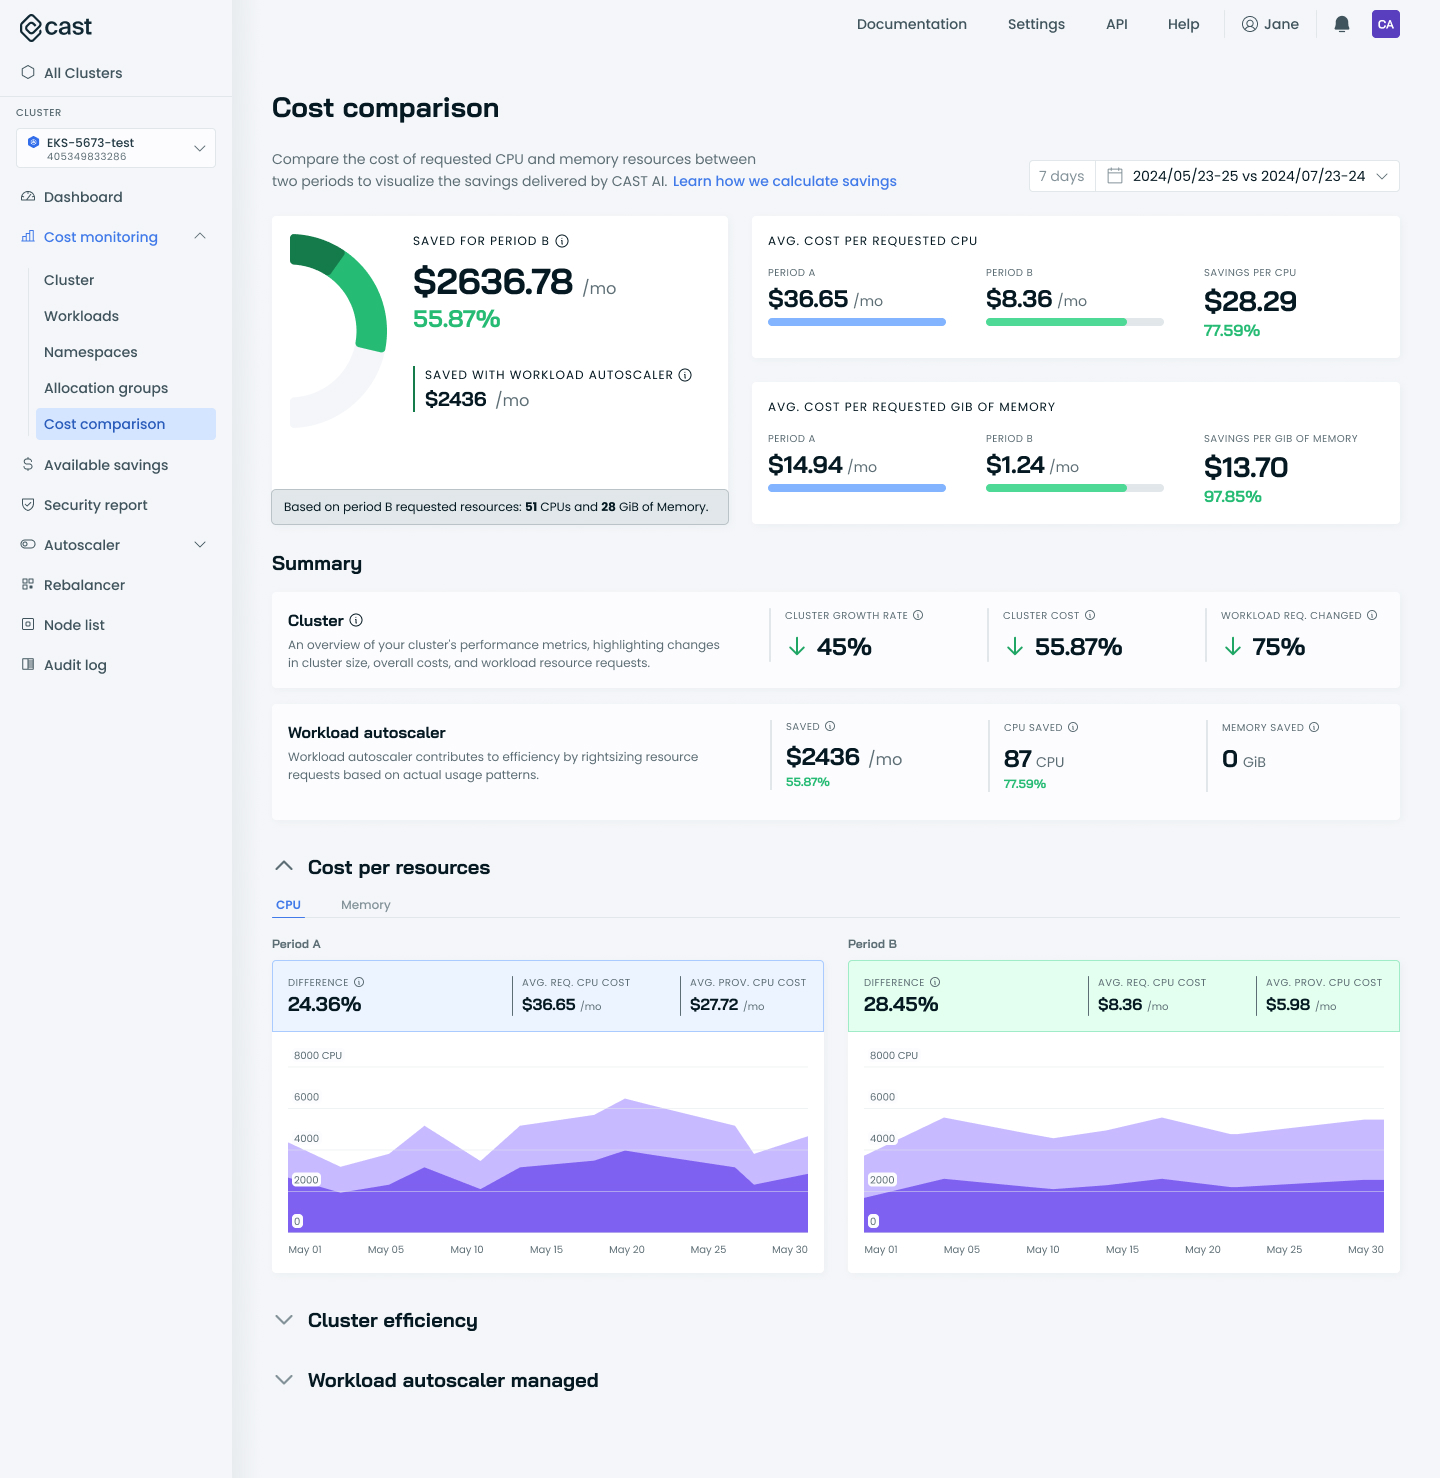
- Navigate to Cost Monitoring > Cost comparison using the sidebar (as shown in the image above).
Data availability requirements
Cost comparison requires at least 14 days of cluster data to generate the first report. If your cluster was recently connected to Cast AI, the feature will be unavailable until sufficient data has been collected.
This waiting period ensures we have enough data to provide accurate period-to-period comparisons and meaningful insights into your optimization results.
Select periods for comparison
You can use the date picker at the top right of the page to specify which two periods of time you wish to compare.
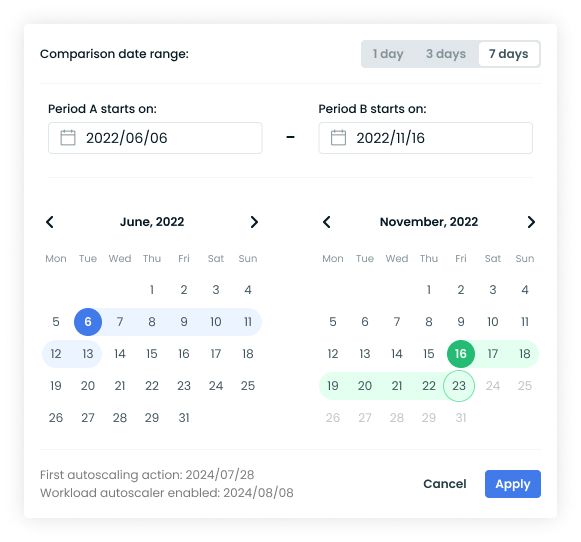
- Select the comparison date range (1 day, 3 days, 7 days, or custom)
- Choose start dates for Period A and Period B.
NoteTypically, Period A represents the baseline (before or early optimization), while Period B represents the comparison period (after optimization). But the tool can be used to compare any two periods required for your use case.
- Click Apply to generate the report.
NoteFor best, most consistent results when using the cost comparison function, make sure to:
- Compare similar time frames (e.g., weekdays to weekdays) for more accurate results.
- Use longer comparison periods (e.g., 7 days) for more stable, representative data.
- Consider external factors (e.g., application changes or traffic spikes) when interpreting results.
NoteThe maximum allowed time frame for comparison is 30 days.
Feature breakdown
Savings overview and breakdown by resource
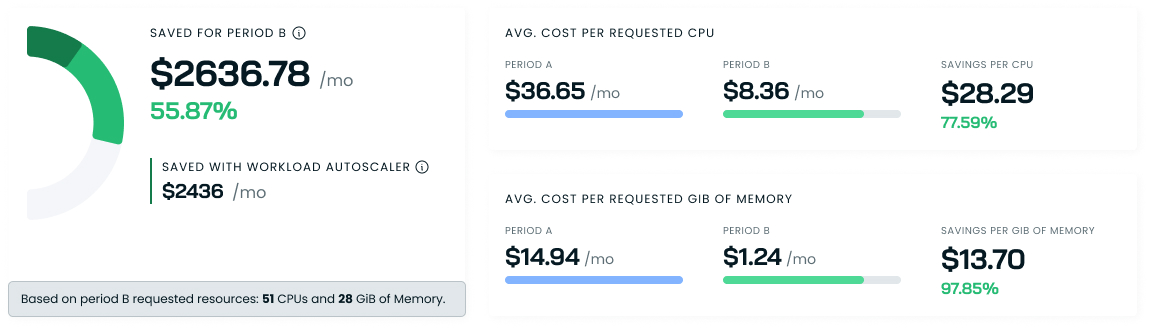
At the top of the cost comparison page, you'll find:
- Saved for Period B: The amount saved during Period B is displayed as a dollar value along with a percentage representing this amount compared to Period A, i.e., a figure of 55.87% in the screenshot below would mean that the savings produced a 55.87% reduction in cost for Period B.
- Saved with Workload Autoscaler: Savings achieved specifically through Cast AI's Workload Autoscaler. Cast AI Workload Autoscaler rightsizes resource requests, resulting in much less resource waste and costs associated with unutilized resources.
- A quick glance at the average cost per resource and associated savings. The Cost per resource comparison section provides a more detailed breakdown of this data.
Cluster summary
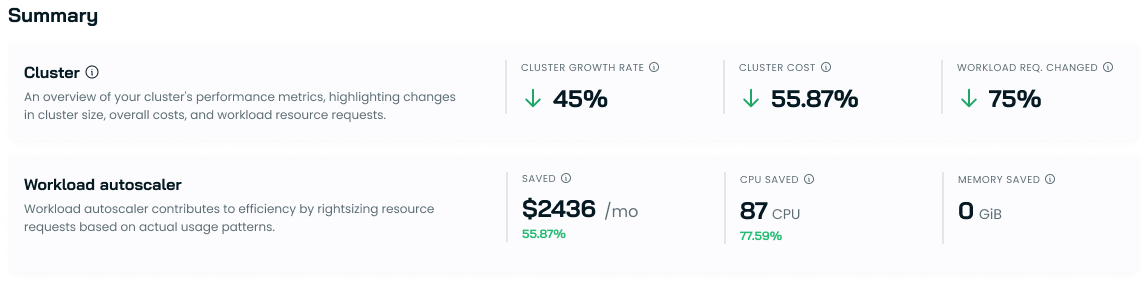
This section provides an overview of your cluster's performance metrics and the impact of CAST AI's optimizations.
Cluster metrics
- Cluster growth rate: Shows the percentage change in cluster size (regarding resources) between periods. A decrease might indicate successful downsizing without compromising performance.
- Cluster cost: Represents the overall cost reduction. A 55.87% decrease demonstrates significant savings achieved through optimization.
- Workload req. changed: Indicates how much workload resource requests have been adjusted. A 75% reduction suggests substantial rightsizing of application resource requests.
Workload Autoscaler impact
- Saved: The total monthly cost savings ($2436) attributed to the Workload Autoscaler having successfully adjusted resource requests, with the percentage (55.87%) showing its contribution to overall savings.
- CPU saved: Quantifies the reduction in CPU resources (87 CPUs) and its percentage (77.59%) relative to the original CPU allocation.
- Memory saved: Shows memory savings. In this case, 0 GiB indicates that memory optimization opportunities remain untapped.
These metrics show how Cast AI has optimized your cluster, balancing performance needs with cost efficiency. Use this summary to quickly gauge the effectiveness of the optimization efforts and identify areas for potential further improvements.
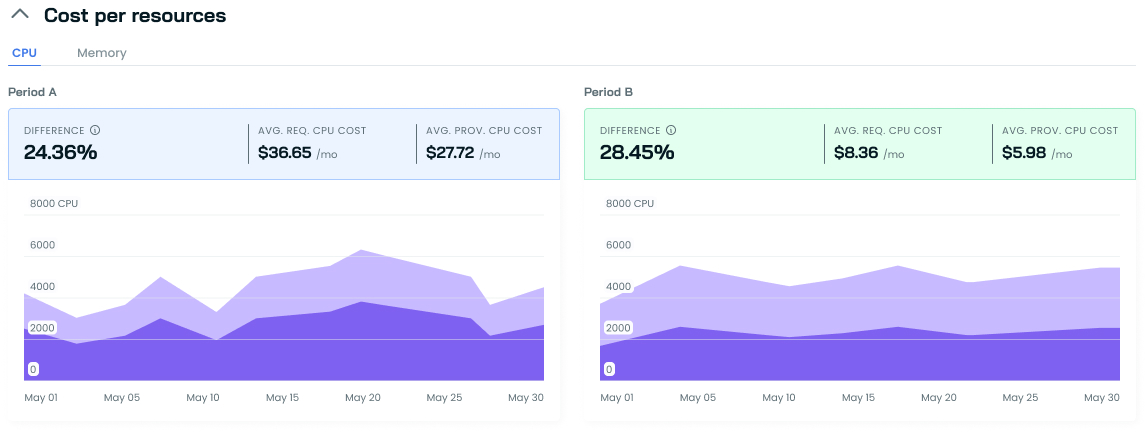
Cost per resource comparison
This section unveils the efficiency gains in cluster resource utilization over time. Comparing costs per requested and provisioned CPU or GiB of Memory across two periods illustrates the tangible impact of optimization efforts.
- Difference: The percentage difference between the average requested CPU/Memory cost and the average provisioned CPU/Memory cost.
This data provides concrete evidence of cost savings and improved resource allocation. It is a powerful tool for justifying optimization investments and identifying areas for further refinement.
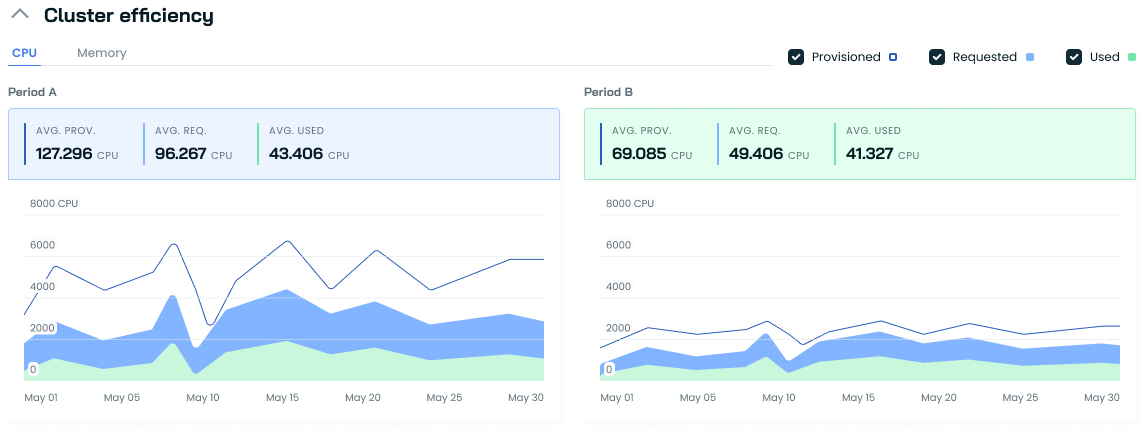
Cluster efficiency
The Cluster efficiency section provides a clear visual narrative of your Kubernetes resource optimization journey. Comparing two time periods shows the impact of Cast AI's optimization efforts on your cluster's resource utilization.
In Period A, the example below shows the wide gaps between provisioned, requested, and used resources. These indicate significant over-provisioning and inefficient resource requests, translating to wasted spending.
Period B tells a different story. The converging lines for provisioned, requested, and used resources showcase a more optimized state. This tighter alignment signifies better resource utilization, more accurate capacity planning, and, ultimately, cost savings without sacrificing performance.
The goal in Kubernetes is to have these lines match as closely as possible. As you can see in Period B, this ideal state is much closer to being realized. This improvement reduces costs and enhances overall cluster efficiency.
Use this to track your optimization progress over time and identify any remaining opportunities for fine-tuning your resource allocation strategies.
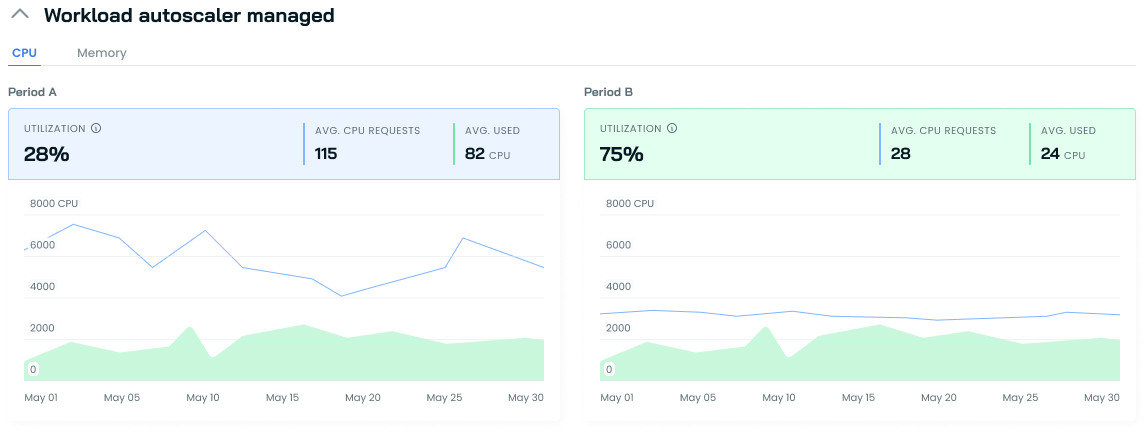
Workload autoscaling impact
The Workload Autoscaler-dedicated section complements the Cluster efficiency view by focusing specifically on the resources managed by Cast AI's Workload Autoscaler.
This visualization shows how the Autoscaler dramatically improves resource utilization. In Period A, with 28% utilization, resources were significantly over-provisioned. Period B demonstrates a marked improvement, reaching 75% utilization. This higher percentage indicates that resource requests are now better adjusted to match actual usage, reflecting more effective resource allocation.
The stark reduction in average CPU requests, coupled with the narrower gap between requested and used resources, illustrates the Workload Autoscaler's effectiveness in optimizing your Kubernetes environment.
Understanding the calculations
To ensure transparency, we want to explain how costs and savings are calculated in our cost comparison tool.
Input values
For each period, we collect the following data for both CPU and Memory:
| Metric | Description |
|---|---|
| Avg. provisioned {resource} | Average amount of resources provisioned |
| Avg. cost per provisioned {resource} | Average cost per unit of provisioned resources |
| Avg. requested {resource} | Average amount of resources requested by workloads |
| Avg. cost per requested {resource} | Average cost per unit of requested resources |
| Avg. used {resource} | Average amount of resources actually used |
| Avg. cost per used {resource} | Average cost per unit of used resources |
| {resource} requested by workloads managed by Workload Autoscaler | |
| {resource} used by workloads managed by Workload Autoscaler |
Resource costs
For Periods A and B, we then perform the following calculations:
| Metric | Calculation |
|---|---|
| Cost per requested CPU | Avg. requested CPU x Avg. cost per requested CPU |
| Cost per requested Memory | Avg. requested Memory x Avg. cost per requested Memory |
| Metric | Calculation |
|---|---|
| Total cluster costs | (Avg. cost per provisioned CPU x Avg. provisioned CPU) + (Avg. cost per provisioned Memory x Avg. provisioned Memory) |
| Metric | Calculation |
|---|---|
| CPU Utilization percentage | (Avg. used CPU / Avg. requested CPU) x 100 |
| Memory Utilization percentage | (Avg. used Memory / Avg. requested Memory) x 100 |
By comparing these calculated values between Period A and Period B, we determine the savings and efficiency improvements achieved through Cast AI's optimizations. This approach allows for a clear understanding of resource utilization and cost changes over time.
Cost savings
To provide a comprehensive view of cost optimization, we calculate various savings metrics and growth rates. Here's how these calculations are performed:
| Metric | Calculation | Insight |
|---|---|---|
| Saved provisioned resources | Period A avg. provisioned {resource} - Period B avg. provisioned {resource} | Shows reduction in overall resource allocation |
| Saved requested resources | Period A avg. requested {resource} - Period B avg. requested {resource} | Indicates improved resource request efficiency |
| Savings for provisioned {resource} costs | Period A avg. cost per provisioned {resource} - Period B avg. cost per provisioned {resource} | Reflects cost reduction per unit of provisioned resources |
| Savings per requested costs | Period A avg. cost per requested {resource} - Period B avg. cost per requested {resource} | Demonstrates cost efficiency in resource requests |
| Total savings per requested resources | Sum of Saved money per requested resources (CPU + Memory) | Aggregates total cost savings from optimized requests |
| Total Savings per provisioned resources | Sum of Saved money per provisioned resources (CPU + Memory) | Shows overall cost reduction in resource provisioning |
| Workload Autoscaler savings | (Period B Workload Autoscaler CPU requests x Savings per requested CPU costs) + (Period B Workload Autoscaler Memory requests x Savings per requested Memory costs) | Quantifies savings specifically from Workload Autoscaler optimizations |
| Saved per used {resource} | Period A avg. cost per used {resource - Period B avg. cost per used {resource} | Indicates improved cost efficiency in actual resource usage |
| Saved money per requested {resource} | Savings per requested {resource} costs x Period B avg. requested {resource} | Translates request optimizations into financial savings |
| Saved money per provisioned resources | Savings for provisioned {resource} costs x Period B avg. provisioned {resource} | Shows financial impact of more efficient resource provisioning |
These calculations allow us to quantify the savings achieved through optimization across various dimensions:
- Resource provisioning and requests: We measure how much less we're allocating and requesting, showing improved efficiency.
- Costs associated with provisioned and requested resources: This demonstrates the financial impact of our optimizations on both the supply and demand sides of resource management.
- Efficiency gains in resource usage: By looking at costs per used resource, we can see how we're getting more value out of what we actually use.
- Financial impact of optimizations: We translate technical improvements into dollar values, making the benefits clear and tangible.
By comparing these metrics between periods, we demonstrate the concrete benefits of Cast AI's optimization strategies. The Workload Autoscaler savings highlight how intelligent workload management contributes to overall cost reduction.
Cluster growth and Workload Autoscaler impact
To assess the effectiveness of our optimizations and understand how the cluster is evolving, we perform several growth-related calculations:
| Metric | Calculation | Insight |
|---|---|---|
| Growth rate of cluster costs | (Period B total cluster costs - Period A total cluster costs) / Period A total cluster costs | Shows percentage change in overall cluster costs |
| Growth rate of cluster | (Period B Avg. provisioned resources - Period A avg. provisioned resources) / Period A avg. provisioned resources | Indicates how the cluster size has changed in terms of provisioned resources |
| Change in workload requests | (Period B workload requests - Period A workload requests) / Period A workload requests | Reflects the change in resource demand from workloads |
| Workload Autoscaler saved CPU | Period A workload CPU requests - Period B workload CPU requests | Quantifies CPU savings achieved by the Workload Autoscaler |
| Workload Autoscaler saved Memory | Period A workload requests Memory - Period B workload Memory requests | Quantifies Memory savings achieved by the Workload Autoscaler |
| Workload Autoscaler savings | (Period A avg. cost per requested CPU - Period B cost per requested CPU) x Period B workload CPU requests + (Period A avg. cost per requested Memory - Period B cost per requested Memory) x Period B workload Memory requests | Calculates total cost savings from Workload Autoscaler optimizations |
By analyzing these growth metrics alongside the savings calculations, you get a comprehensive view of how Cast AI is optimizing your cluster over time, balancing resource allocation with cost efficiency.
Troubleshooting discrepancies
When conducting cost comparisons between different periods in Cast AI, it's crucial to ensure that the data you're comparing accurately reflects similar conditions. Discrepancies, such as unusually high savings percentages (e.g., 5000%), can occur due to misaligned periods or unusual initial configurations. Here are some common scenarios to watch for:
Interpreting unusually high savings percentages
- Issue: Extremely high savings percentages (e.g., over 1000%) usually indicate that the initial costs were disproportionately high due to over-provisioning or idle resources. If the cluster in Period A was over-provisioned, meaning a large number of resources (like CPUs or memory) were allocated but not utilized, it could lead to hyper-inflated costs in that period.
- Example: An empty cluster with a large number of provisioned CPUs will show very high costs for those unused resources. This skews savings when compared to a period where resources are right-sized or better utilized.
- Solution: Ensure that the baseline (Period A) reflects a real, active state of the cluster. If the cluster was largely empty or over-provisioned in the baseline, it may be misleading to compare this with a fully utilized period.
Cluster growth or shrinking between periods
- Issue: If your cluster significantly changed in size between the two periods (e.g., resources were added or removed, or the cluster was scaled up or down), this will affect cost comparisons.
- Solution: Be mindful of such changes. If your cluster was empty or partially operational in Period A and fully loaded in Period B, your savings comparison may appear exaggerated. In these cases, adjust the comparison periods to reflect more suitable scenarios.
Updated 2 months ago