
Metrics
Learn how to scrape Cast AI metrics and visualize them in Grafana.
Cluster metrics integration
Cast AI delivers detailed metrics on your cluster utilization so that you can better understand your cloud infrastructure and ultimately reduce its cost. All metrics are scrapable, so you can scrape the data using Prometheus API and visualize it in Grafana or another tool of your choice.
As a result, you can draw on the cluster utilization and cost stats and include them effortlessly in your team’s wider cloud monitoring and reporting efforts.
This guide outlines the metrics available in Cast AI and describes the process of exporting them to Prometheus and Grafana step by step.
How to visualize Cast AI metrics in Prometheus and Grafana
Why use Cast AI with Prometheus and Grafana
The combination of Prometheus and Grafana has become a common choice for DevOps and CloudOps teams, and this is for a reason.
The first provides a powerful querying language and gathers rich metrics, while the latter transforms these into meaningful visualizations. Both Prometheus and Grafana are compatible with most data source types.
How to connect Cast AI with Prometheus and Grafana
1. Create your Cast AI API key
Enter your cluster in the Cast AI platform, click the API tab in the top menu, and generate a one-time token.
You must specify your key name and choose between read-only or full access. Then, copy and paste it into the respective place in the above code and execute.
You can also use this key to access the Cast AI API in tools like Swagger UI.
2. Call the Cast AI API
Open your Prometheus scraper config in your favorite tool and add scraping for Cast AI metrics. Our API provides separate endpoints for scraping the cluster, node, workload, and allocation group-level metrics. Here is an example of how to configure scraping all of them:
NoteReplace
$CASTAI_API_URLwith your regional API endpoint (for example,api.cast.aifor US). See API access for the full list of regional endpoints.
scrape_configs:
 - job_name: 'castai_cluster_metrics'
   scrape_interval: 15s
   scheme: https
   static_configs:
     - targets: ['$CASTAI_API_URL']
   metrics_path: '/v1/metrics/prom'
   authorization:
     type: 'Token'
     credentials: '{apiKey}'
 - job_name: 'castai_node_template_metrics'
   scrape_interval: 1m
   scheme: https
   static_configs:
     - targets: ['$CASTAI_API_URL']
   metrics_path: '/v1/metrics/nodes'
   authorization:
     type: 'Token'
     credentials: '{apiKey}'
 - job_name: 'castai_workload_metrics'
   scrape_interval: 15s
   scheme: https
   static_configs:
     - targets: ['$CASTAI_API_URL']
   metrics_path: 'v1/metrics/workloads'
   authorization:
     type: 'Token'
     credentials: '{apiKey}'
 - job_name: 'castai_allocation_group_metrics'
   scrape_interval: 15s
   scheme: https
   static_configs:
     - targets: ['$CASTAI_API_URL']
   metrics_path: 'v1/metrics/allocation-groups'
   authorization:
     type: 'Token'
     credentials: '{apiKey}'
 - job_name: 'castai_workload_network_metrics'
   scrape_interval: 15s
   scheme: https
   static_configs:
     - targets: ['$CASTAI_API_URL']
   metrics_path: 'v1/metrics/workload-network'
   authorization:
     type: 'Token'
     credentials: '{apiKey}'
Please replace {apiKey} with the token created in step 1.
To limit the amount of returned data, the Node, Workload, Allocation group, and Workload network metric endpoints support filtering by clusterID(see API reference).
3. Specify your data source in Grafana
Open Grafana, head to the Configuration tab, and click on Data Sources.
When you select the Add data source option, you’ll see a list of all supported data sources. From here, choose Prometheus and insert all required details, including HTTP, Auth, and more.

After you specify your data source, you can go to Explore, select your data source by name, and start typing the metric name for auto-completion.


4. Create a dashboard in Grafana
Click on the Dashboards tab in Grafana’s main menu and select the Browse option. That’s where you’ll see the button to start a new dashboard. Give it a meaningful name and set the main options.
For more information, refer to Grafana’s documentation or check this list of best practices for creating dashboards.
You can also start by importing the Example dashboard JSON provided below.
5. Add and format your metrics
Now, it’s time to start populating your dashboard with data.
Add a new panel and scroll down to its bottom to ensure that the data source is set to Prometheus. Then, start typing the name of the required metric in the metric browser box, and it will appear on the screen.
Common metrics include the requested vs. provisioned CPUs and memory, and the monthly cost of your cluster. You can also expand the metrics presented in your dashboard by importing data from JSON files.
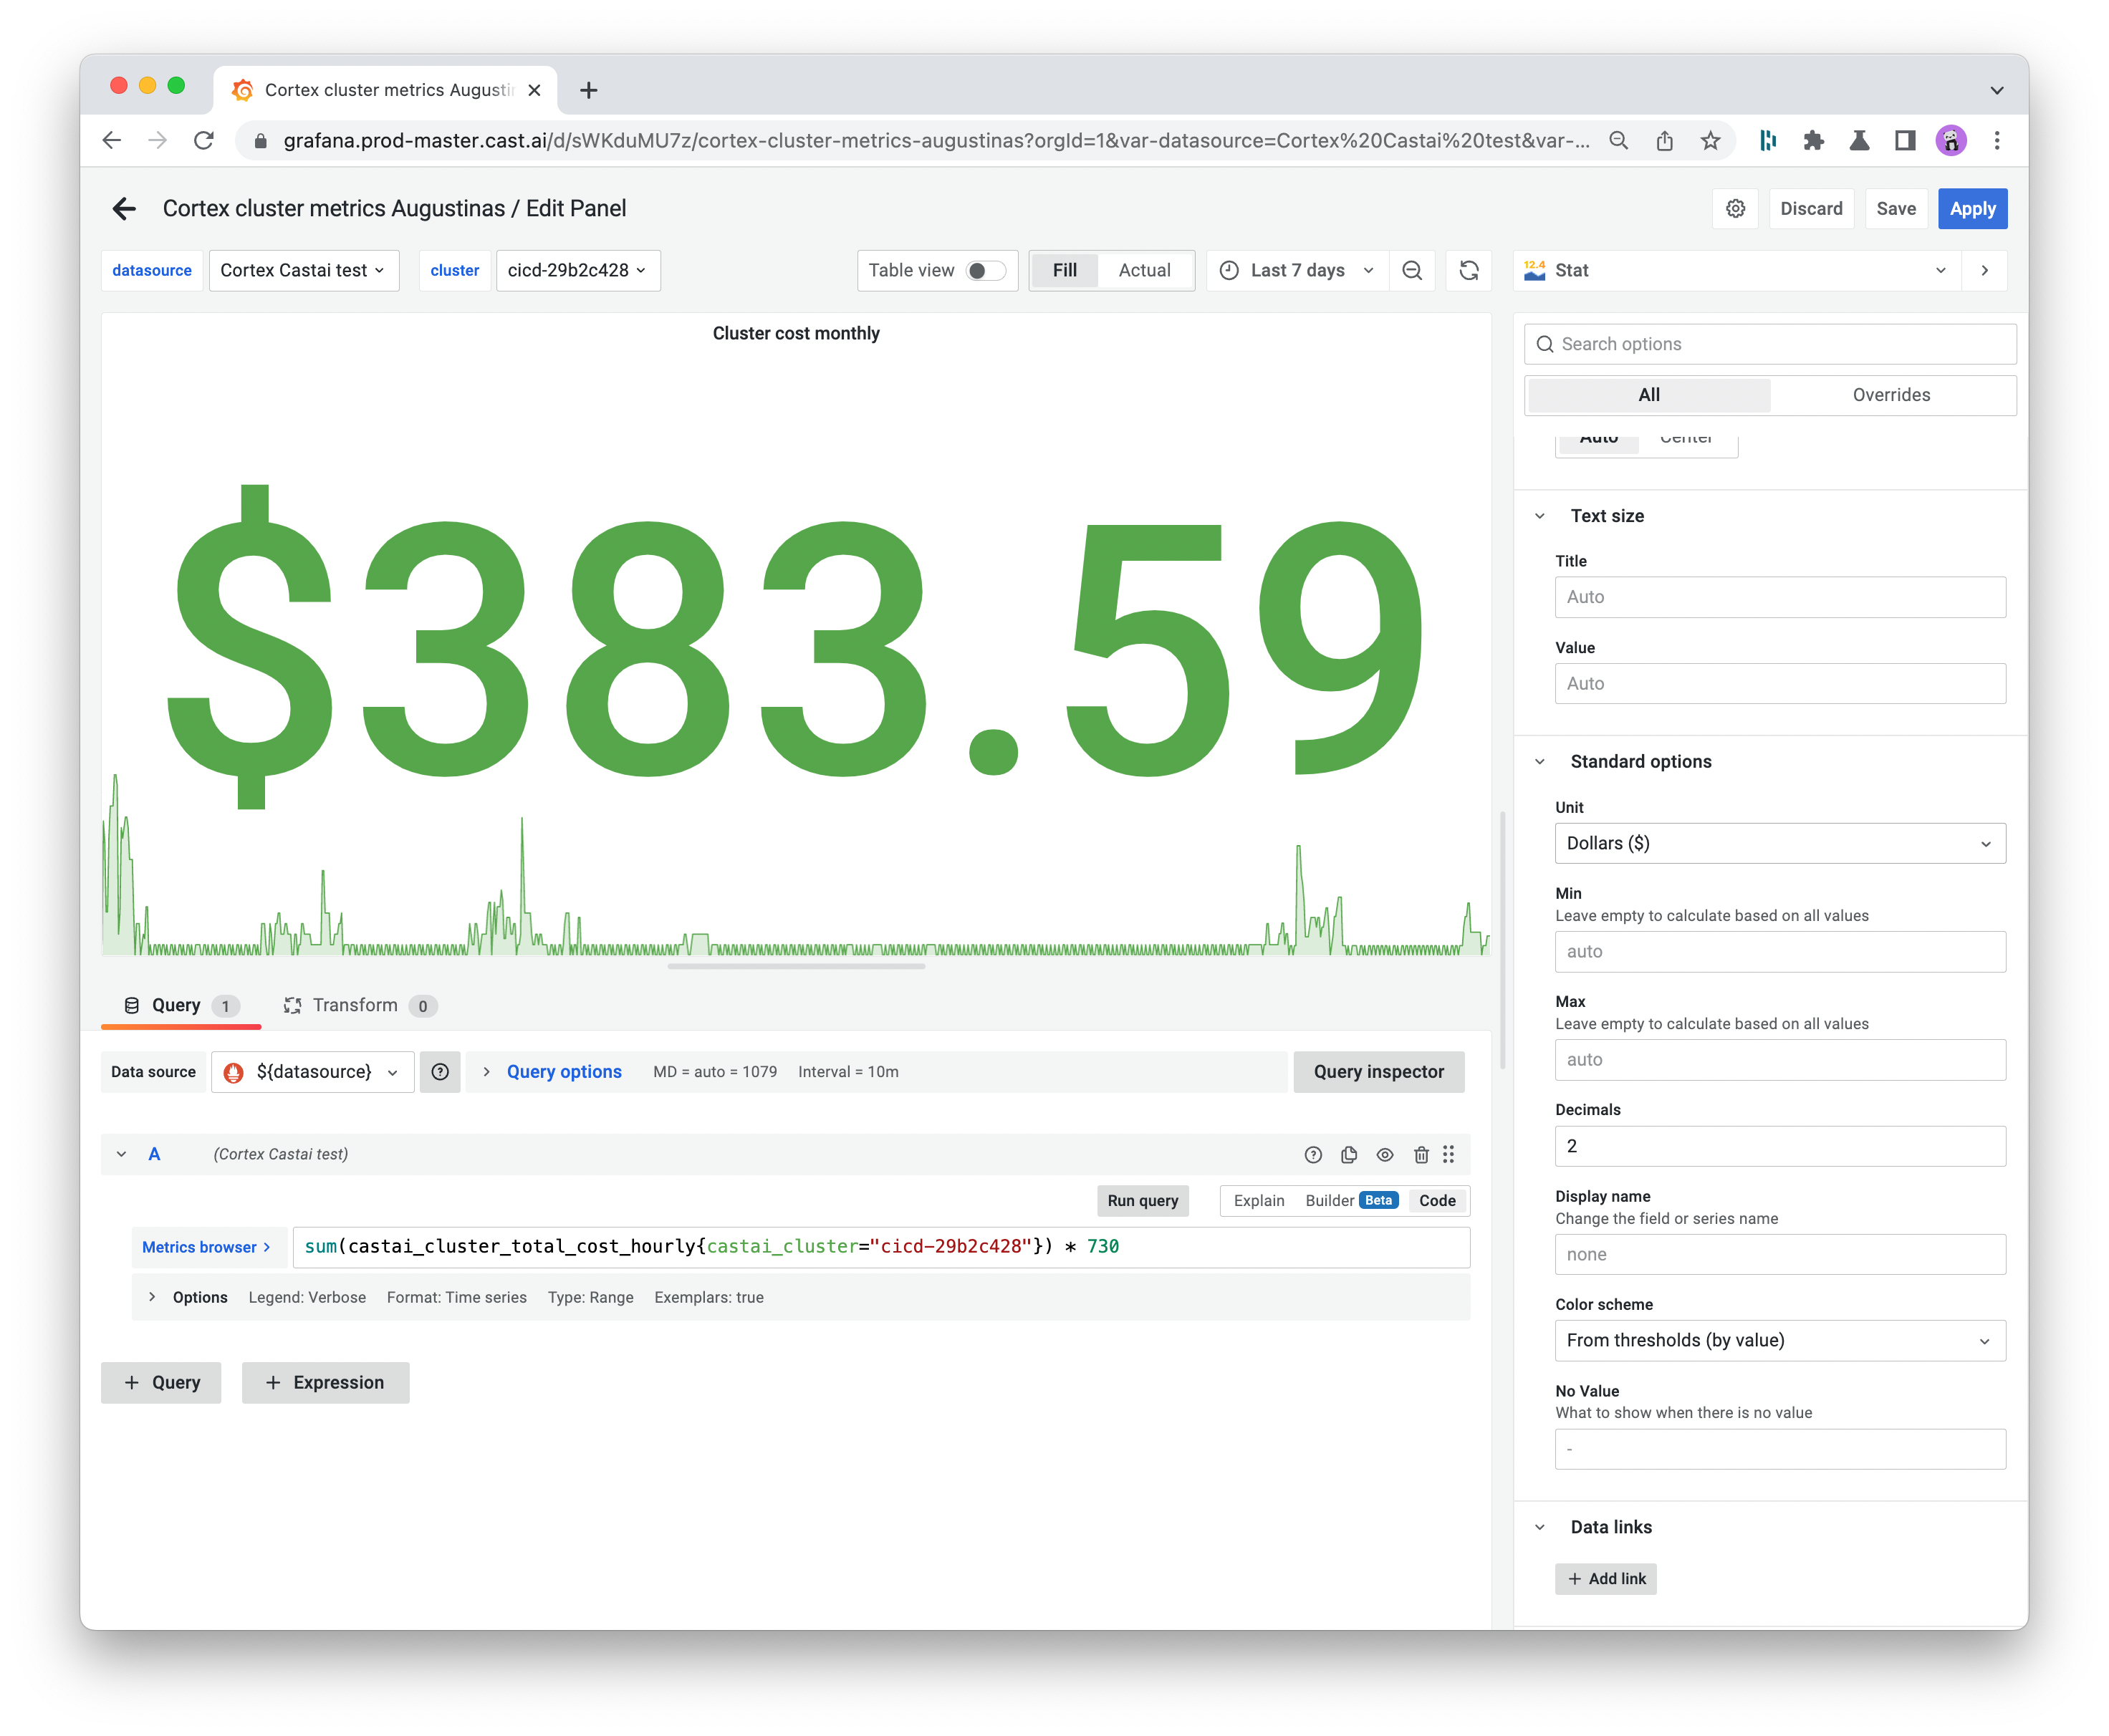
Use the panel on the right to specify your stat title, legend, visualization styles, and other values to help you ensure the report makes the most sense to your team.
You can then expand your dashboard with additional features, including annotations and alerts.
Example Grafana dashboard
Here’s an example dashboard displaying Cast AI data.
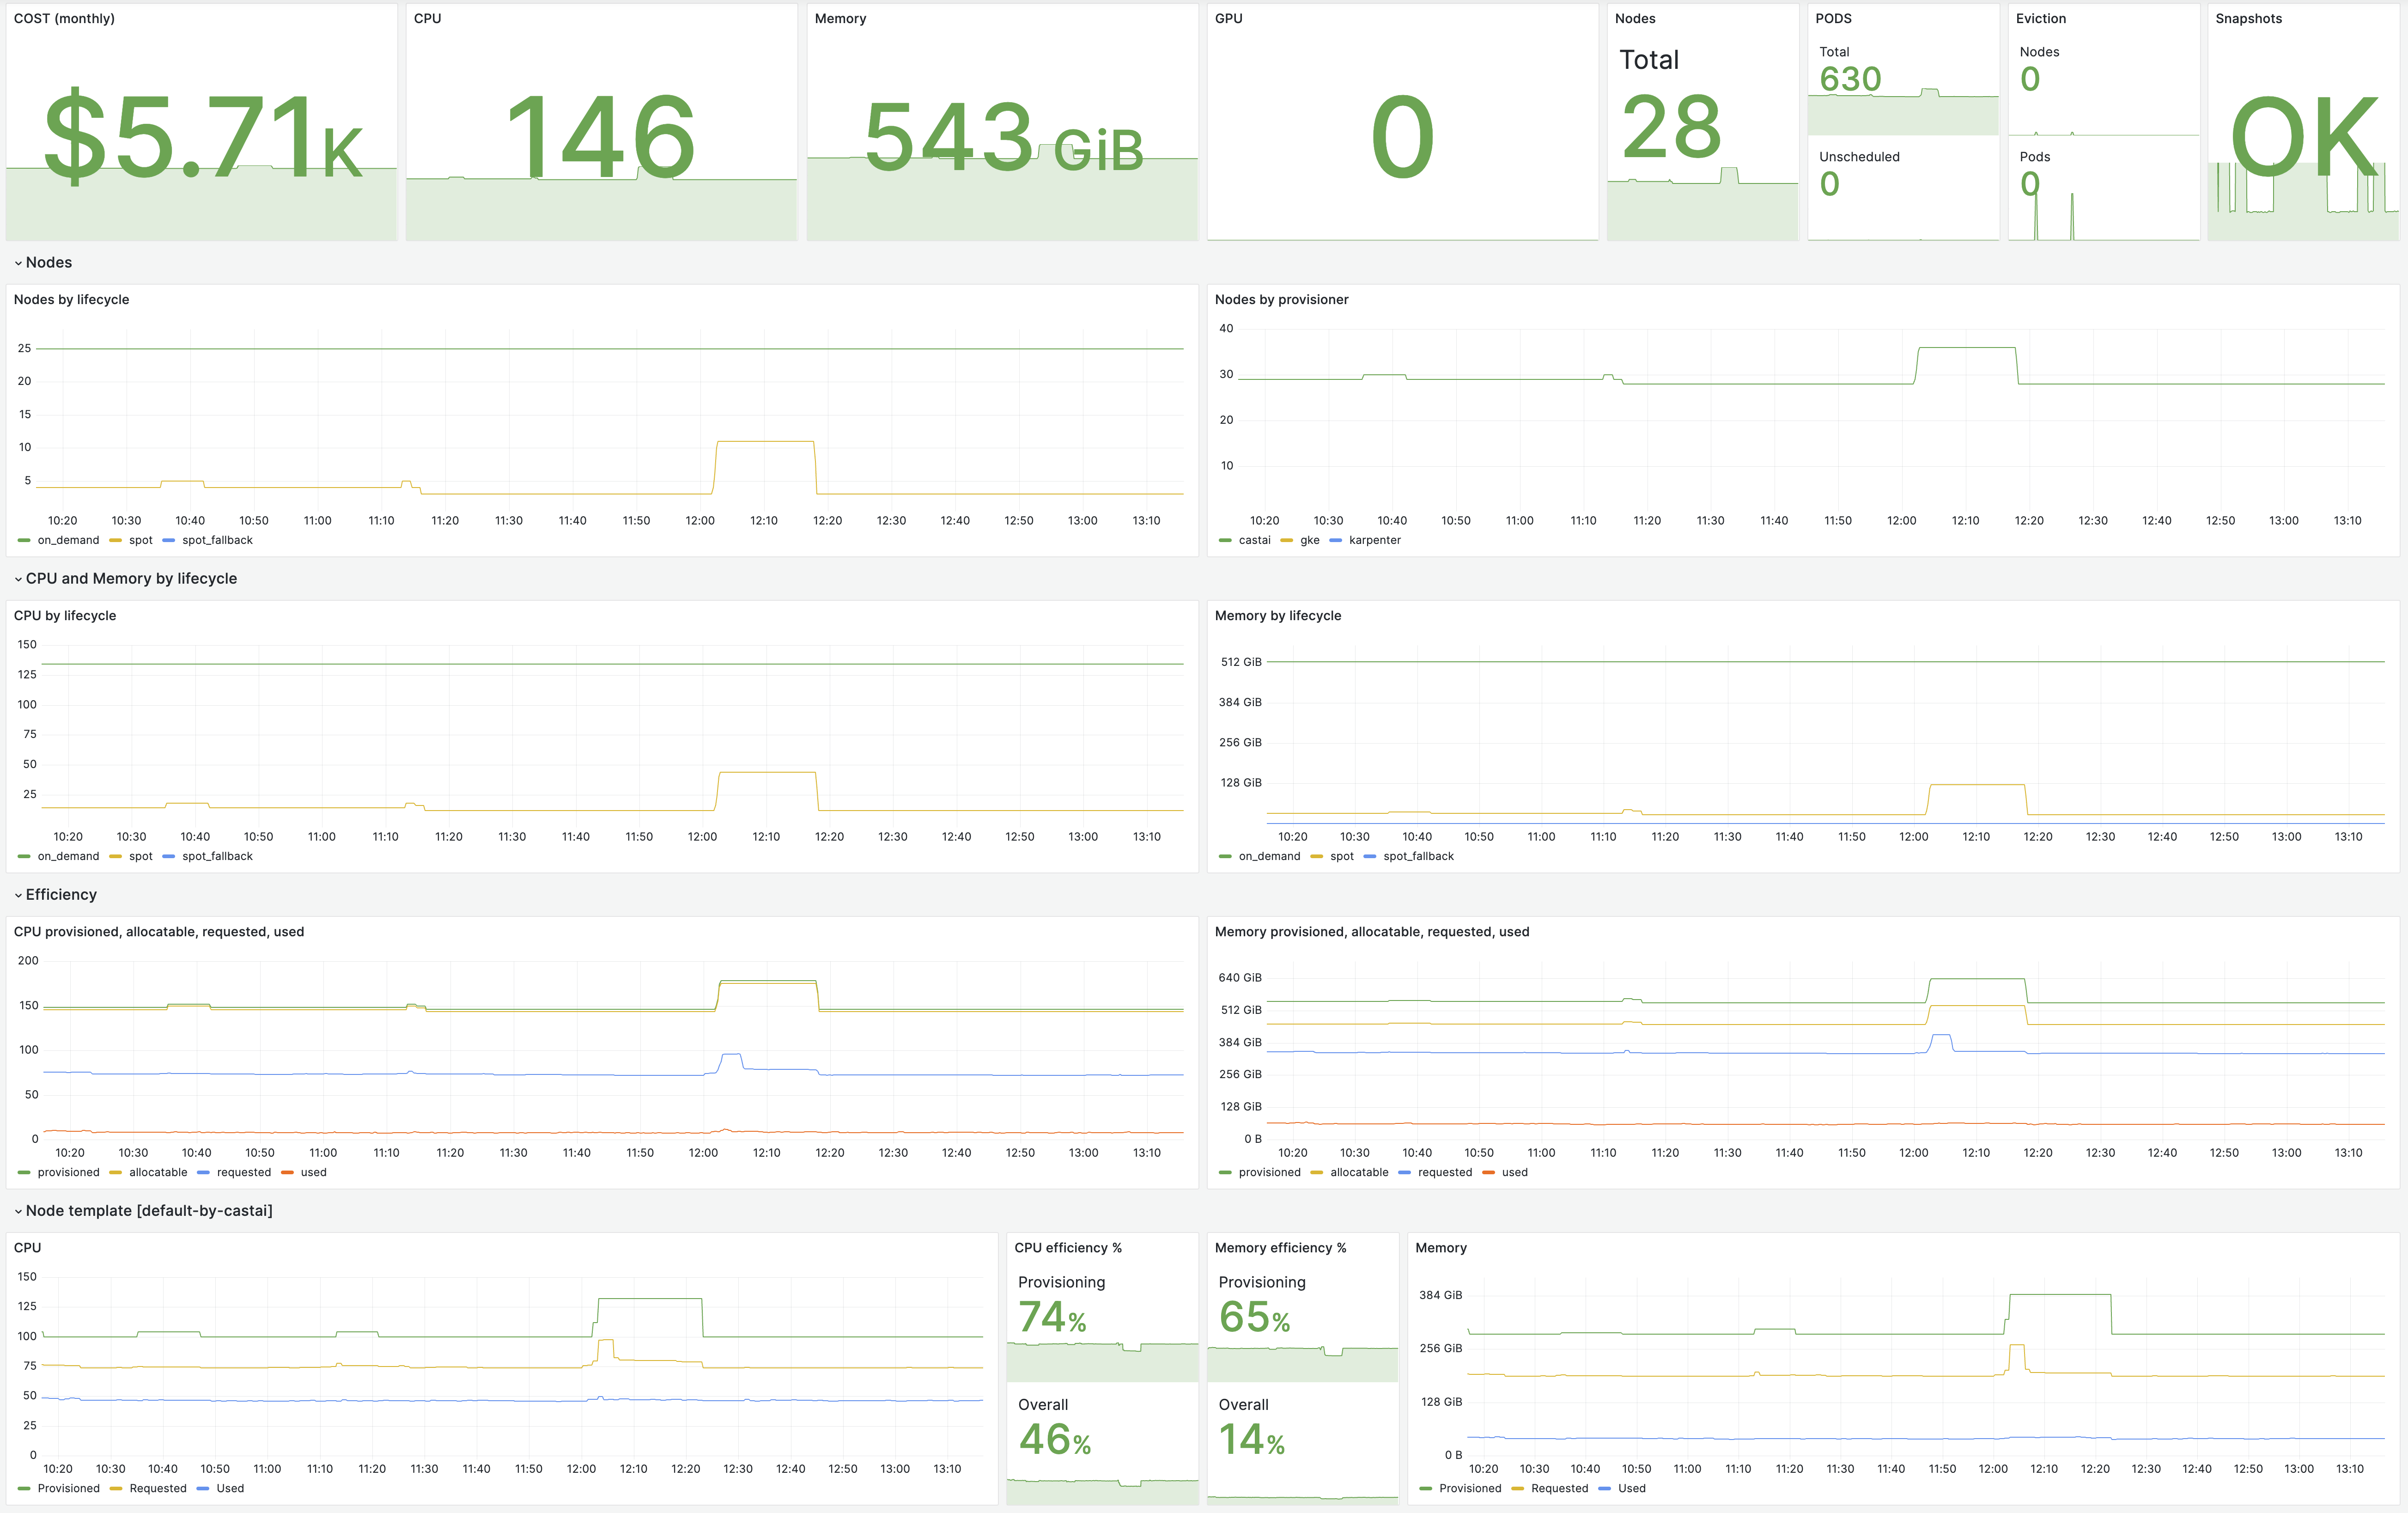
You can get the code here.
Cast AI metrics
NoteLabel
cast_node_typeis deprecated, so instead of it, please usecastai_node_lifecycle.
| Name | Type | Description | Action |
|---|---|---|---|
castai_autoscaler_agent_snapshots_received_total | Counter | The Cast AI Autoscaler agent snapshots received total. | Check if the Agent is running in the cluster. |
castai_autoscaler_agent_snapshots_processed_total | Counter | The Cast AI Autoscaler agent snapshots processed total. | Contact CAST AI support. |
castai_cluster_total_cost_hourly | Gauge | Cluster total hourly cost. | |
castai_cluster_compute_cost_hourly | Gauge | Cluster compute cost. Has a lifecycle dimension which can be summed up to a total cost: [on_demand, spot_fallback, spot]. | |
castai_cluster_total_cost_per_cpu_hourly | Gauge | Normalized cost per CPU. | |
castai_cluster_compute_cost_per_cpu_hourly | Gauge | Normalized cost per CPU. Has a lifecycle dimension, similar to castai_cluster_compute_cost_hourly. | |
castai_cluster_allocatable_cpu_cores | Gauge | Cluster allocatable CPU cores. | |
castai_cluster_allocatable_memory_bytes | Gauge | Cluster allocatable memory. | |
castai_cluster_provisioned_cpu_cores | Gauge | Cluster provisioned CPU cores. | |
castai_cluster_provisioned_memory_bytes | Gauge | Cluster provisioner memory. | |
castai_cluster_requests_cpu_cores | Gauge | Cluster requested CPU cores. | |
castai_cluster_used_cpu_cores | Gauge | Cluster used CPU cores. | |
castai_cluster_used_memory_bytes | Gauge | Cluster used memory. | |
castai_cluster_requests_memory_bytes | Gauge | Cluster requested memory. | |
castai_cluster_node_count | Gauge | Cluster nodes count. | |
castai_cluster_pods_count | Gauge | Cluster pods count. | |
castai_cluster_unschedulable_pods_count | Gauge | Cluster unschedulable pods count. | |
castai_evictor_node_target_count | Gauge | Cast AI Evictor targeted nodes count. | |
castai_evictor_pod_target_count | Gauge | Cast AI Evictor targeted pods count. | |
castai_cluster_provisioned_storage_bytes | Gauge | Cluster-provisioned storage. Currently available only for GCP. | |
castai_cluster_requests_storage_bytes | Gauge | Cluster requested storage. Currently available only for GCP. | |
castai_cluster_storage_cost_hourly | Gauge | Cluster storage hourly cost. Currently available only for GCP. |
Query examples
Cost per cluster:
sum(castai_cluster_total_cost_hourly{}) by (castai_cluster)Compute the cost of Spot Instances of a specific cluster:
castai_cluster_compute_cost_hourly{castai_cluster="$cluster", lifecycle="spot"}Received snapshots count:
sum(increase(castai_autoscaler_agent_snapshots_received_total{castai_cluster="$cluster"}[5m]))Alert on missing snapshots:
absent_over_time(castai_autoscaler_agent_snapshots_received_total{castai_cluster="$cluster"}[5m])Total cluster cost over the last 7 days:
sum_over_time(castai_cluster_total_cost_hourly{castai_cluster="$cluster"}[7d:1m]) / 60Get castai_node_lifecycle(on_demand, spot, spot_fallback) of running nodes in the cluster:
sum(castai_cluster_node_count{castai_cluster="$cluster"}) by (castai_node_lifecycle)Get CPU cores provisioned for spot_fallback nodes:
castai_cluster_provisioned_cpu_cores{castai_node_lifecycle="spot_fallback"}
NoteReplace
$clusterwith existingcastai_clusterlabel value.
Node metrics
Node metrics have common labels: cluster_id, node_id, node_name, node_template, managed_by
| Name | Type | Description | Note |
|---|---|---|---|
| castai_node_spot_interruption | Gauge | Nodes that have been interrupted over the last 60 seconds | will have managed_by="castai" label only when Cast AI manages the node, otherwise, this label will be absent |
| castai_node_requested_cpu_cores | Gauge | Requested CPU cores by node | Has a lifecycle dimension: [on_demand, spot_fallback, spot] |
| castai_node_requested_ram_bytes | Gauge | Requested RAM bytes by node | Has a lifecycle dimension |
| castai_node_provisioned_cpu_cores | Gauge | Provisioned CPU cores by node | Has a lifecycle dimension |
| castai_node_provisioned_ram_bytes | Gauge | Provisioned RAM bytes by node | Has a lifecycle dimension |
| castai_node_used_cpu_cores | Gauge | Utilized CPU cores by node | Has a lifecycle dimension |
| castai_node_used_ram_bytes | Gauge | Utilized RAM bytes by node | Has a lifecycle dimension |
| castai_node_cost_cpu_hourly | Gauge | Hourly cost of CPU by node | Has a lifecycle dimension |
| castai_node_cost_ram_gib_hourly | Gauge | Hourly cost of RAM by node | Has a lifecycle dimension |
| castai_node_overprovisioned_cpu_percent | Gauge | The overprovisioned percentage of CPU by node | Has a lifecycle dimension |
| castai_node_overprovisioned_ram_percent | Gauge | Overprovisioned percent of RAM by node | Has a lifecycle dimension |
Possible managed_by values are: castai, karpenter, eks, gke, aks, kops, openshift
Query example
Get average on_demand CPU overprovisioned% % per node provider:
avg(castai_node_overprovisioned_cpu_percent{lifecycle="on_demand"}) by (managed_by)Get CPU cores provisioned for the default Cast AI node template and aggregated by lifecycle:
sum(castai_node_provisioned_cpu_cores{node_template="default-by-castai"}) by (lifecycle)Get a count of node spot interruptions aggregated by node templates:
sum(castai_node_spot_interruption{}) by (node_template)Workload metrics
By default, when using the v1/metrics/workloads endpoint, it returns common labels such as cluster_id, namespace, workload_name, workload_type. However, you can also specify additional labels to be returned by setting workload labels in the additionalLabels query parameter.
NoteThere is a special
workload_optimization_enabledlabel, which can be specified in theadditionalLabelsquery parameter. This will return a label indicating whether optimization is enabled for a particular workload.
| Name | Type | Description | Note |
|---|---|---|---|
| castai_workload_cost_hourly | Gauge | Workload cost per hour | Has a lifecycle dimension: [on_demand, spot_fallback, spot] |
| castai_workload_pod_count | Gauge | Number of pods | Has a lifecycle dimension: [on_demand, spot_fallback, spot] |
| castai_workload_requested_cpu_cores | Gauge | Requested CPU cores | Has a lifecycle dimension: [on_demand, spot_fallback, spot] |
| castai_workload_requested_memory_bytes | Gauge | Requested memory bytes | Has a lifecycle dimension: [on_demand, spot_fallback, spot] |
| castai_workload_persistent_volume_cost_hourly | Gauge | Workload persistent volume cost per hour | |
| castai_workload_requested_persistent_volume_bytes | Gauge | Workload requested persistent volume bytes |
Query example
Get workload costs running on spot instances for a specific cluster:
castai_workload_cost_hourly{cluster_id="$clusterId", lifecycle="spot"}Get average workload costs running on on_demand instances over 1h aggregated by namespace for specific cluster:
sum(avg_over_time(castai_workload_cost_hourly{cluster_id="$clusterId", lifecycle="on_demand"}[1h])) by (namespace)Allocation group metrics
| Name | Type | Description | Note |
|---|---|---|---|
| castai_allocation_group_compute_cost_hourly | Gauge | Compute the cost per hour | Has a lifecycle dimension: [on_demand, spot_fallback, spot] |
| castai_allocation_group_cpu_cost_hourly | Gauge | CPU cost per hour | Has a lifecycle dimension: [on_demand, spot_fallback, spot] |
| castai_allocation_group_memory_cost_hourly | Gauge | Memory cost per hour | Has a lifecycle dimension: [on_demand, spot_fallback, spot] |
| castai_allocation_group_requested_cpu_cores | Gauge | Requested CPU cores | Has a lifecycle dimension: [on_demand, spot_fallback, spot] |
| castai_allocation_group_requested_memory_bytes | Gauge | Requested memory bytes | Has a lifecycle dimension: [on_demand, spot_fallback, spot] |
Workload network metrics
| Name | Type | Description | Note |
|---|---|---|---|
| castai_workload_network_bytes | Gauge | Workload network bytes | |
| castai_workload_to_workload_traffic_bytes | Gauge | Workload to workload traffic bytes |
Updated 15 days ago