
Organizational cluster cost report
The organization-level cost report provides a centralized view of costs and resource utilization across all your Kubernetes clusters, giving you critical insights into your cloud infrastructure spending. This report combines data from all clusters connected to Cast AI in your organization, helping you understand total expenses, track provisioned resources, and identify opportunities for optimization.
Finding your way around the report
You'll find the organization-level cost report in the Cast AI console under Cost monitoring. The report interface offers two distinct analysis paths through dedicated tabs at the top of the screen:
- The Compute cost tab shows spending across clusters and resources, breaking down expenses by CPU, memory, storage, and instance types.
- The Efficiency tab reveals how effectively resources are being used, highlighting areas where you might be over-provisioning or could optimize further.
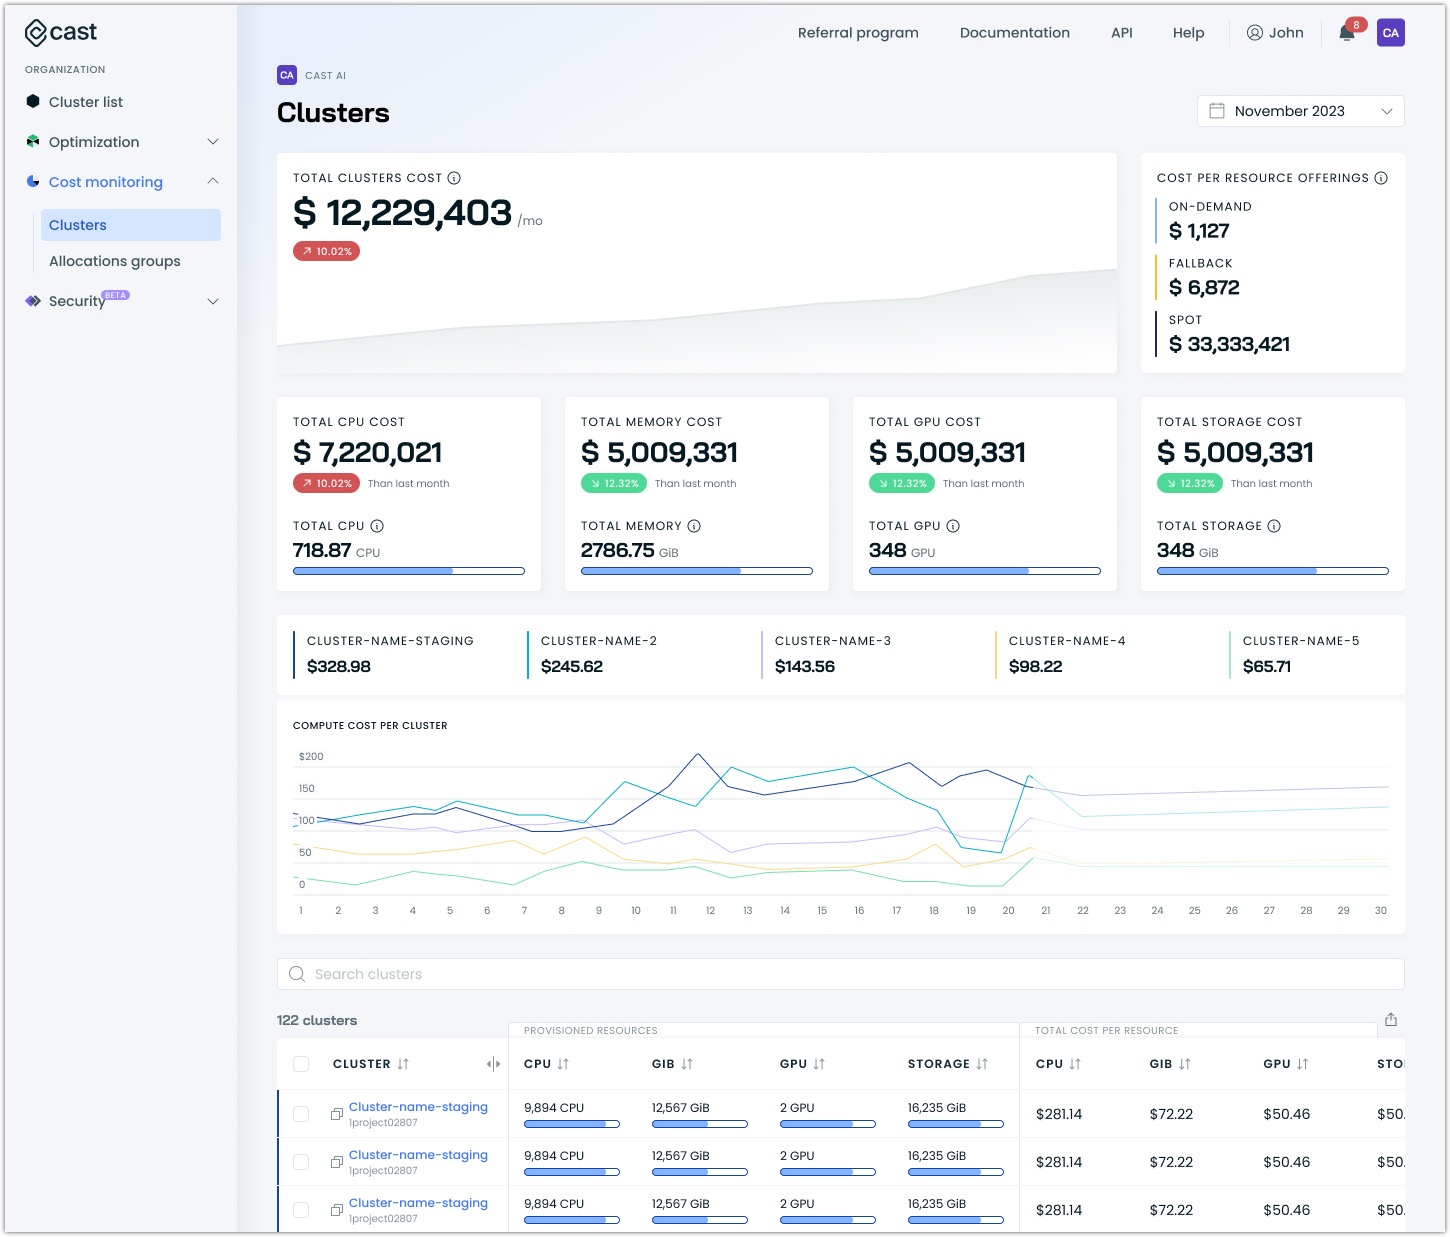
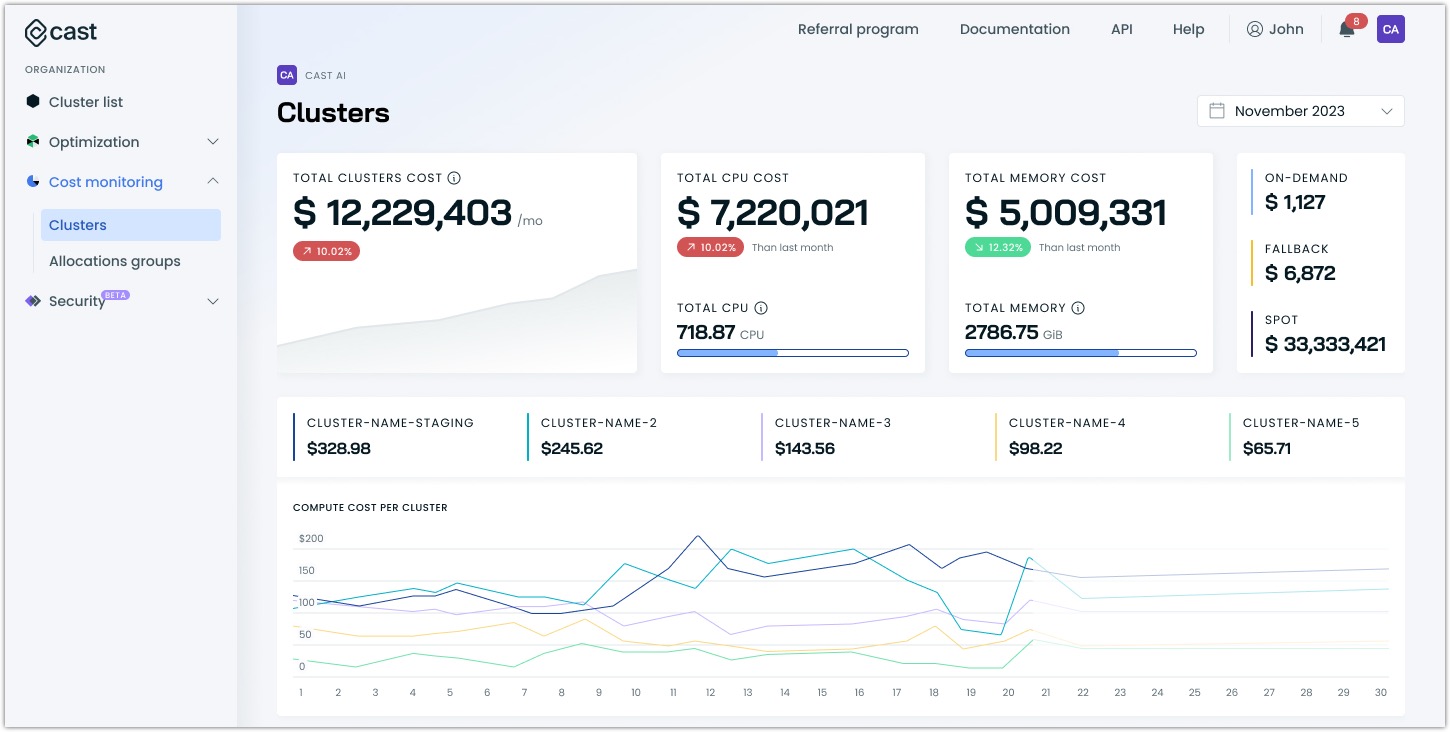
Compute cost
Understanding your organization's spending
The report's compute cost overview presents your total organizational spending with context that helps you assess your Kubernetes costs:
- Month-to-date spending compared to previous periods helps identify trends
- Cost distribution between resource types reveals your main cost drivers
- The top 5 most expensive clusters are highlighted for you to review, bringing focus on high-impact areas
Meaningful cost comparisons
When analyzing spending trends, focus on:
- Sudden cost increases: These often indicate scaling events or potential issues requiring investigation. Make sure to consider any configuration changes you have made across the organization or growth that may be the root cause of costs being up compared to previous periods.
- Weekend vs. weekday patterns: Different usage patterns can suggest opportunities for scheduled scaling. If your applications have drastic differences between weekend vs. weekday or night vs. day traffic, consider this an opportunity to leverage for sizeable savings, which can be delivered by Cast AI automation offerings. See Workload autoscaler for more information on how Cast AI can automatically detect and optimize in line with these patterns.
- Month-over-month changes: Gradual increases might reveal resource creep that needs addressing. Alternatively, the relationship between the organization's growth and cost trends should be evaluated. Costs going up may not necessarily indicate a problem but, in fact, reveal that the proportional increase in costs related to organizational growth can indicate successful optimization attempts, depending on the ratio. For example, a 10% growth of your organization's infrastructure with only a 5% uptick in costs is commendable.
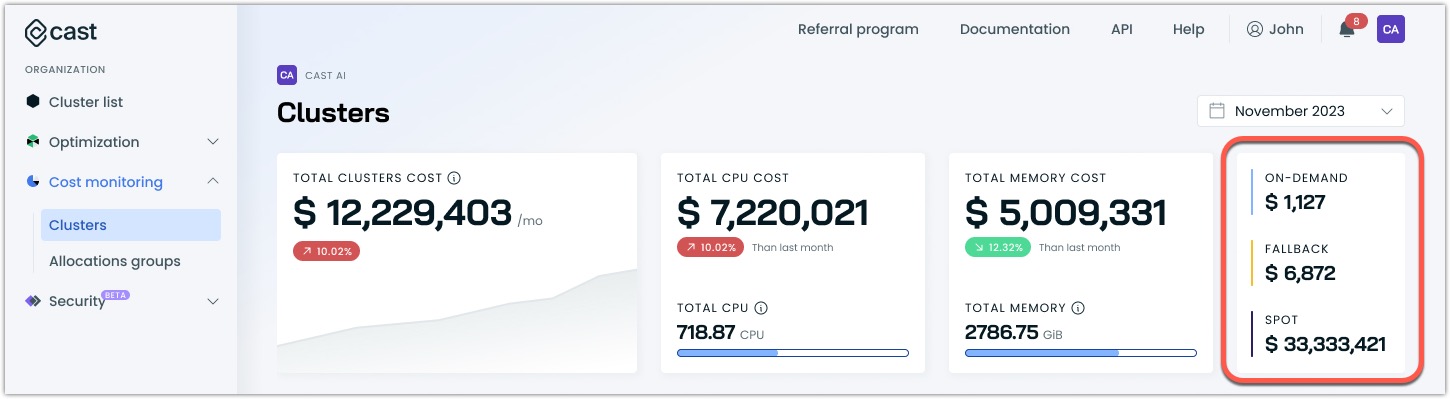
Instance lifecycle impact on costs
Understanding how different instance types affect your costs is crucial for optimization:
- On-demand instances provide baseline capacity but at premium prices
- Spot Instances can significantly reduce costs but require proper handling of potential interruptions
- Fallback instances temporarily protect workloads during spot unavailability
High fallback costs often indicate that your Spot Instance configuration needs adjustment - either in terms of instance types selected or availability zones used.
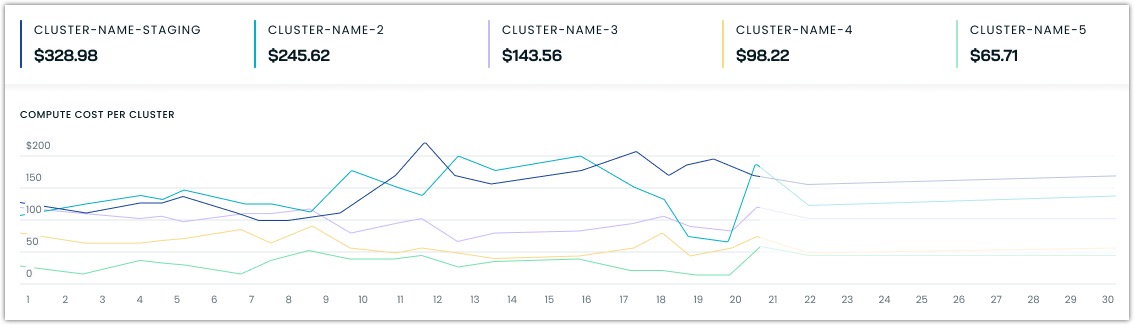
Most expensive clusters
The compute cost report highlights up to five clusters with the highest costs in your organization. This section helps you:
- Identify your main cost drivers
- Track cost trends over time between clusters
- Focus optimization efforts where they'll have the most impact
Detailed cluster list
This section includes a table with detailed information on each cluster. Each cluster entry shows:
- Total cost
- Cost distribution visualization
- Comparison with other high-cost clusters
- Direct link to detailed cluster analysis
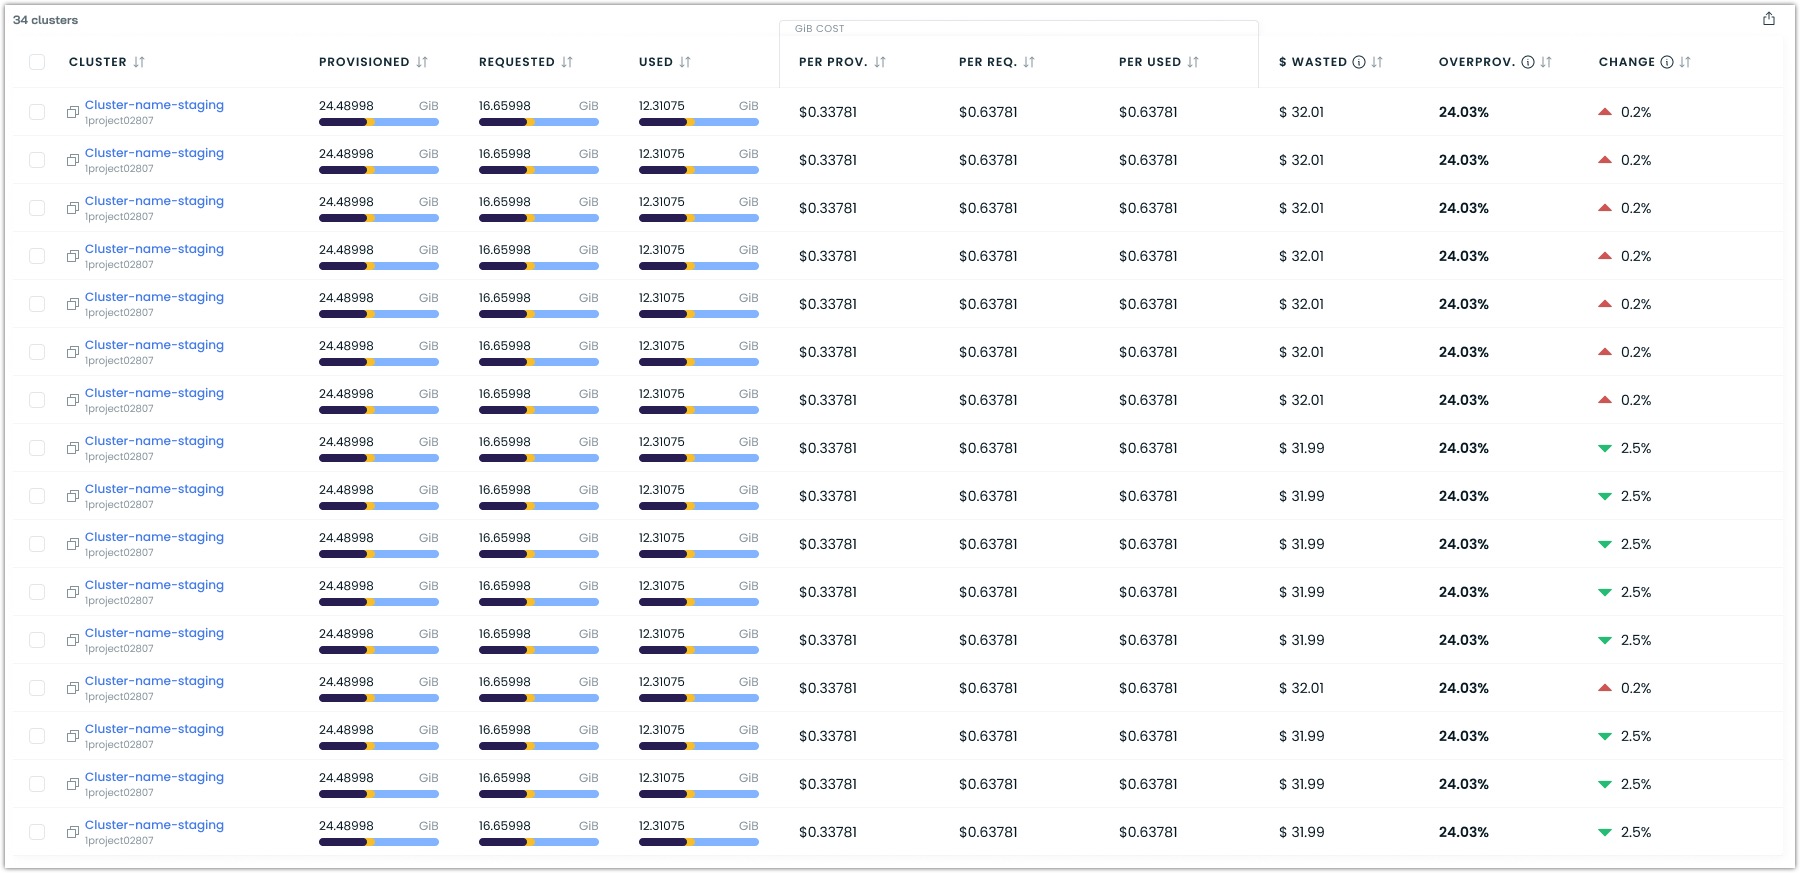
The cluster list accommodates organizations with a high cluster count for improved convenience. It provides ample filtering and sorting options to narrow your selection to show only what matters to you.
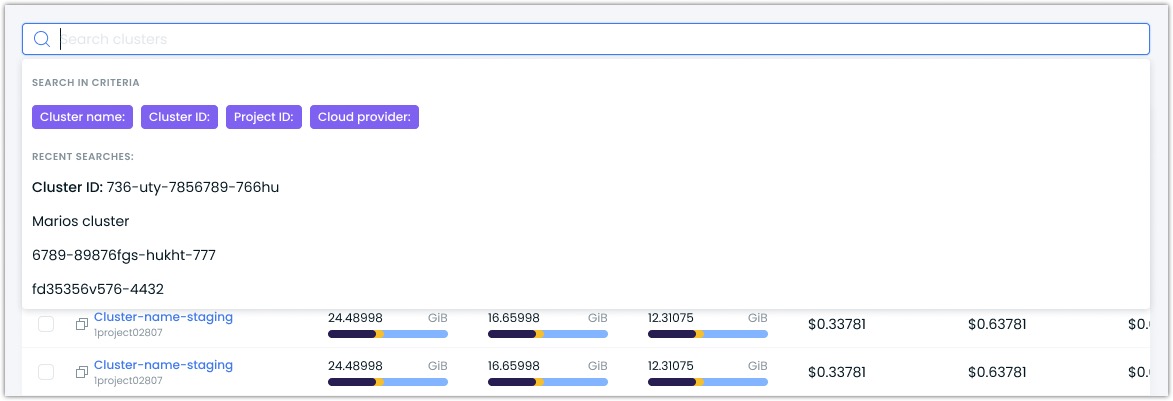
Use the search functionality to isolate a specific cluster you wish to analyze.
- If you do this often with the same parameters, use suggested search criteria or leverage one of the recent searches.
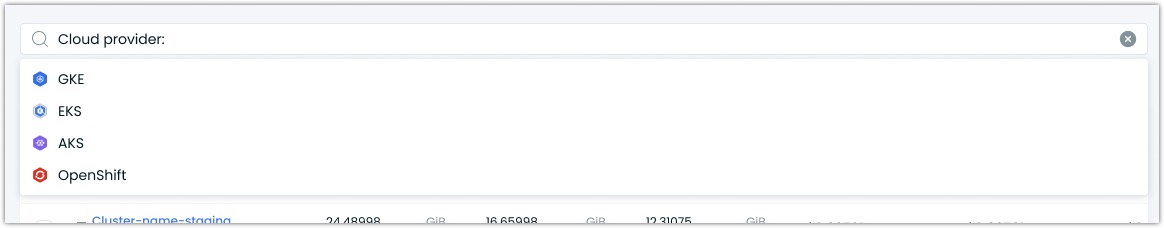
For organizations that have their clusters spread out across multiple cloud service providers (CSPs), we offer the ability to filter by CSP:
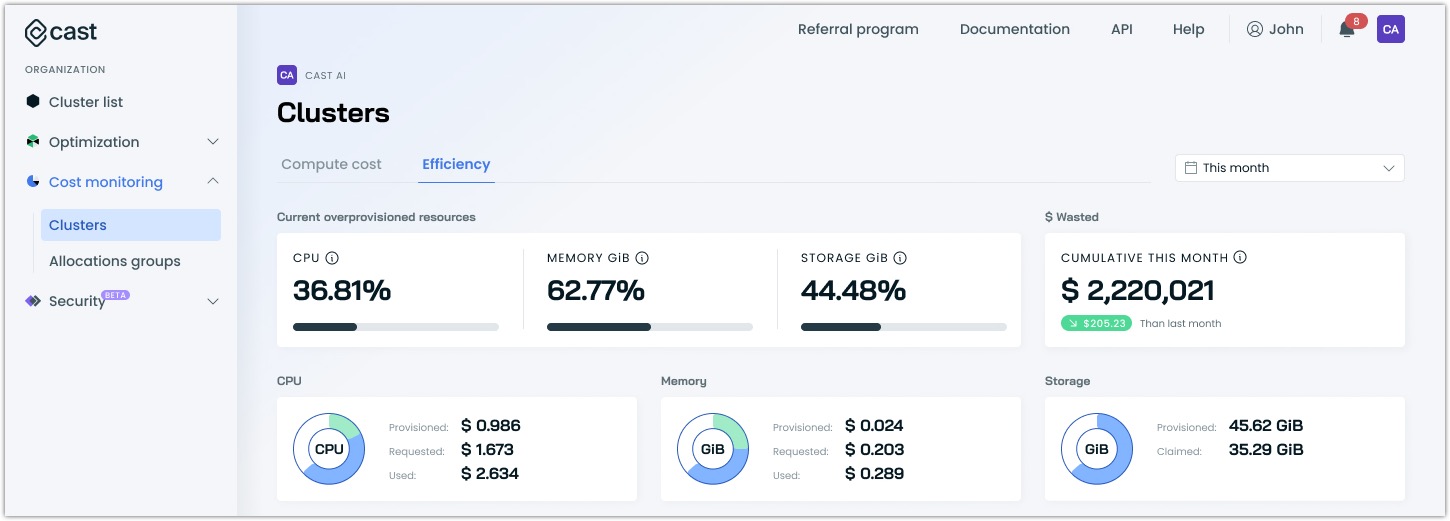
Resource efficiency
Switch to the Efficiency tab to understand what you're spending and how effectively your resources are being used. The efficiency view provides insights into resource utilization patterns and highlights potential optimization opportunities across your organization.
Current overprovisioned resources
At the top of the efficiency view, you'll find percentages showing your current overprovisioned resources:
- CPU overprovisioning: The percentage of CPU resources that are provisioned but not used
- Memory overprovisioning: The percentage of memory that's allocated but not utilized
- Storage overprovisioning: The percentage of storage space that's provisioned but remains unused (available for GKE clusters)
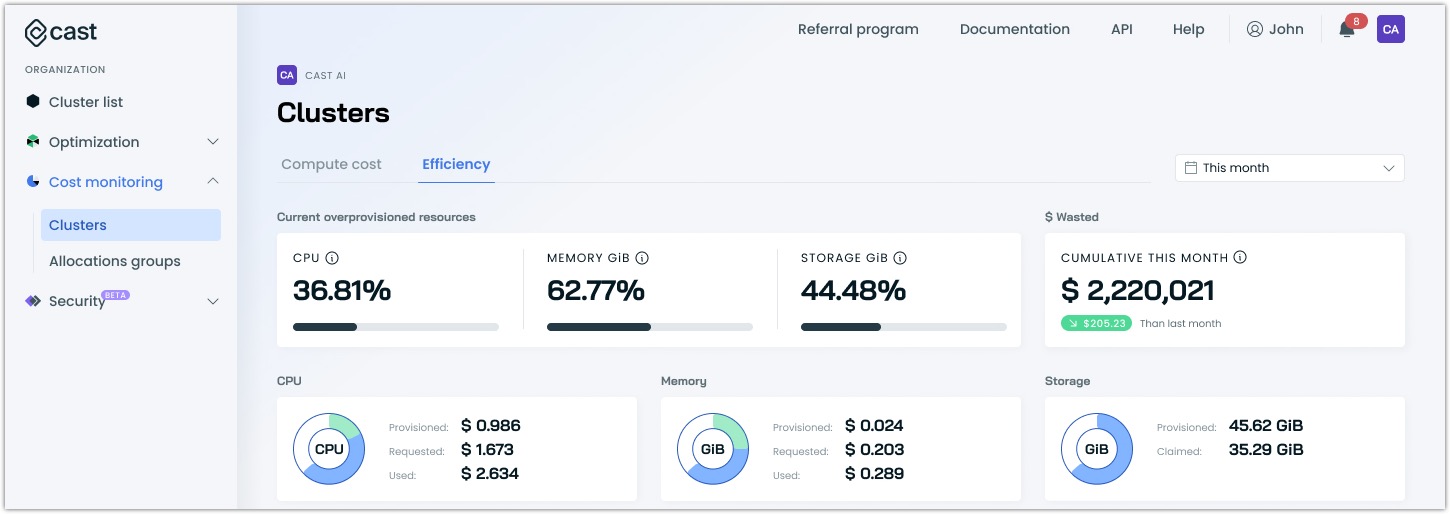
These percentages help you quickly assess whether your current resource allocation aligns with actual needs. High percentages often indicate opportunities for significant cost savings.
Resource-specific analysis
The efficiency view provides dedicated tabs for CPU, memory, and storage analysis. For each resource type, you can track:
- Provisioned resources: Total capacity available across your clusters
- Requested resources: Capacity requested by your workloads
- Used resources: Actual consumption by your applications
- Cost implications: Financial impact of your resource allocation decisions
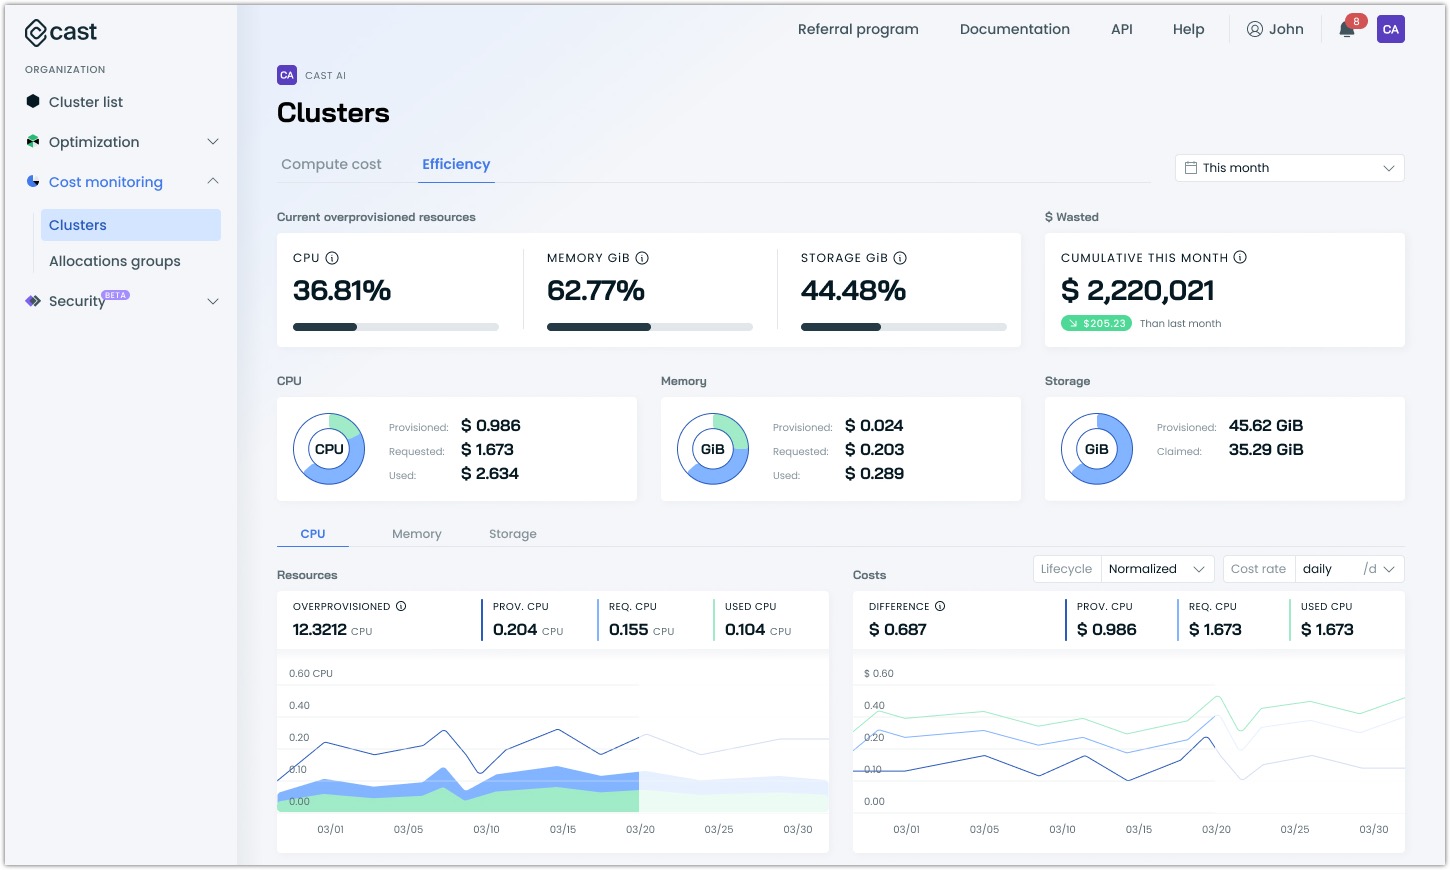
When analyzing these metrics, focus on:
- Gaps between provisioned and used resources that indicate overprovisioning
- Consistent underutilization patterns suggesting rightsizing opportunities
- Cyclical usage patterns that could benefit from dynamic scaling
The relationship between these metrics often reveals optimization opportunities. For instance, if your resources are consistently well below the requested amount, you might benefit from adjusting your workload resource requests using Cast AI's workload autoscaler.
NoteStorage efficiency metrics are currently available only for GKE clusters.
Resource costs and lifecycle
The efficiency view also breaks down resource costs by instance lifecycle:
- Normalized view: Overall resource efficiency
- On-demand resources: Efficiency of regular instances
- Spot resources: Utilization of Spot Instances
- Fallback resources: Usage patterns during spot unavailability
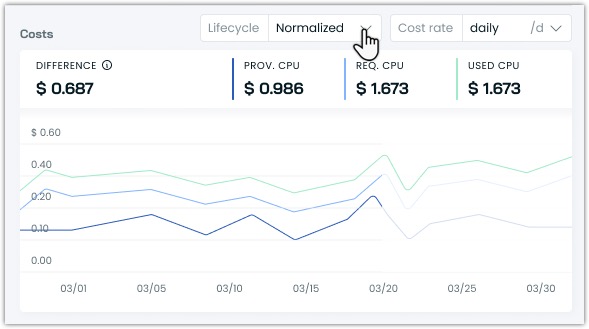
Understanding these patterns helps optimize your instance lifecycle strategy for better cost efficiency.
Cost-actionable data
The organization-level cost report isn't just about viewing numbers - it's about identifying opportunities and taking action to optimize your Kubernetes infrastructure.
Monitor spending trends
Start by monitoring trends in your month-over-month data. Gradual cost increases often signal resource creep, where additional resources are provisioned but never decommissioned. Watch for sudden spikes, too - these usually indicate an unexpected scaling event or a potential issue that needs investigation. Pay attention to the differences between weekend and weekday patterns, as these can help you implement more efficient scheduling strategies.
Focus on high-impact targets
When deciding where to focus your optimization efforts, prioritize high-cost and low-utilization clusters. These clusters often provide the quickest wins in terms of cost reduction. Pay attention to patterns of consistent overprovisioning and inefficient distribution of instance lifecycles, as addressing these issues can lead to significant savings without compromising performance.
Updated 2 months ago