
Available settings
This page provides a reference for configuration options available in the Cast AI console when optimizing workloads with Cast AI's Workload Autoscaler. These settings control how the autoscaler analyzes resource usage patterns, generates resource request recommendations, and applies optimizations to your workloads.
For comprehensive, advanced configuration options, see our Annotations reference to learn how to configure and manage workload optimization on Cast AI via Kubernetes annotations.
Configuration scope and hierarchy
The settings documented here can be applied at multiple levels, creating a flexible configuration hierarchy.
Policy-level configuration
Settings defined in scaling policies serve as defaults for all workloads assigned to that policy. This approach enables consistent optimization strategies across groups of similar workloads while reducing individual configuration overhead. Cast AI strongly recommends leveraging scaling policies with automated assignment rules to reduce the amount of manual work needed to manage and optimize your workloads.
Workload-level configuration
Individual workloads can override policy-level settings using Kubernetes annotations when specific requirements differ from the policy defaults. Annotation-based settings take precedence over policy-level configurations.
NoteThe Cast AI console does not support editing per-workload vertical scaling settings. You can still toggle optimization on or off for individual workloads via the console, but all other workload-level overrides must be configured through annotations.
Configuration hierarchy
When multiple configuration sources are present, they are applied in the following order of precedence:
- Workload-level annotations (highest priority)
- Policy-level settings (lowest priority)
This hierarchy allows for centralized policy management while maintaining flexibility for specific workload requirements through annotations.
Configuration methods
You can configure these settings through multiple interfaces, each suited for different use cases and workflows.
Cast AI Console
The web-based interface provides user-friendly controls for configuring scaling policies and toggling optimization on or off for individual workloads. This method is ideal for:
- Interactive policy creation and management
- Enabling or disabling optimization on individual workloads
See our guide on creating scaling policies or the available settings reference below for instructions on policy settings available in the console.
API integration
The Workload Optimization API enables programmatic configuration of scaling policies and workload settings.
Terraform provider
The Cast AI Terraform provider allows you to define optimization settings as infrastructure code.
Kubernetes annotations
Workload-specific settings can be applied directly to Kubernetes resources using annotations. This method provides:
- Fine-grained control at the workload level
- Integration with existing Kubernetes manifests
For detailed information about annotation syntax and examples, see the Configuration via annotations section in the Workload Autoscaling Configuration documentation.
Settings reference
The following sections provide detailed information about each available configuration option, including their purpose, impact on workload optimization, and configuration examples across different interfaces.
You can configure the following settings in your custom scaling policies. To override these settings for individual workloads, use annotations.
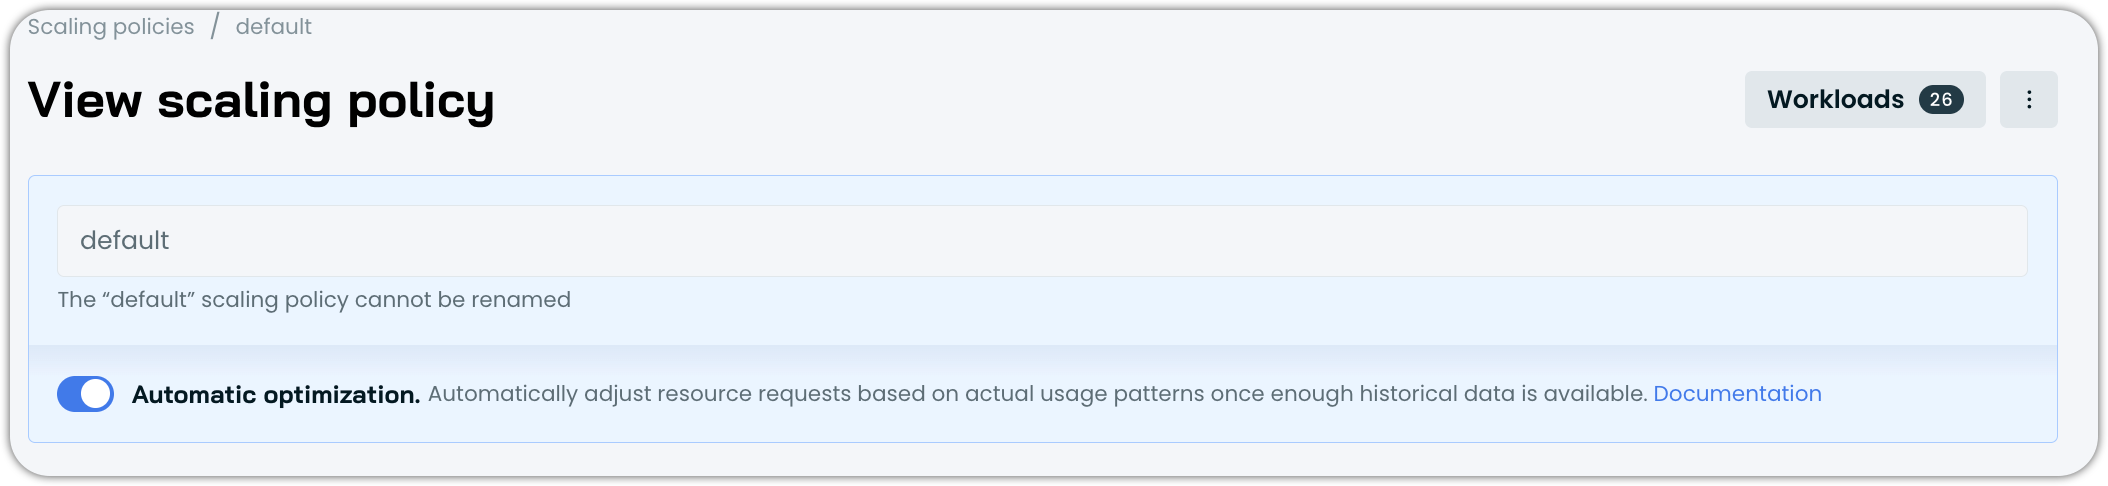
Automatically optimize workloads
Specify whether resource request recommendations should be automatically applied to all workloads associated with the scaling policy. This feature enables automation only when enough data is available to make informed recommendations.
Resource-specific optimization
When configuring vertical scaling, you can enable or disable CPU and memory optimization independently while still receiving recommendations for both resources. Even when optimization is disabled for a resource, Workload Autoscaler continues to generate recommendations but won't apply them automatically. This setting can be configured at the vertical policy level. To override it for individual workloads, use annotations.
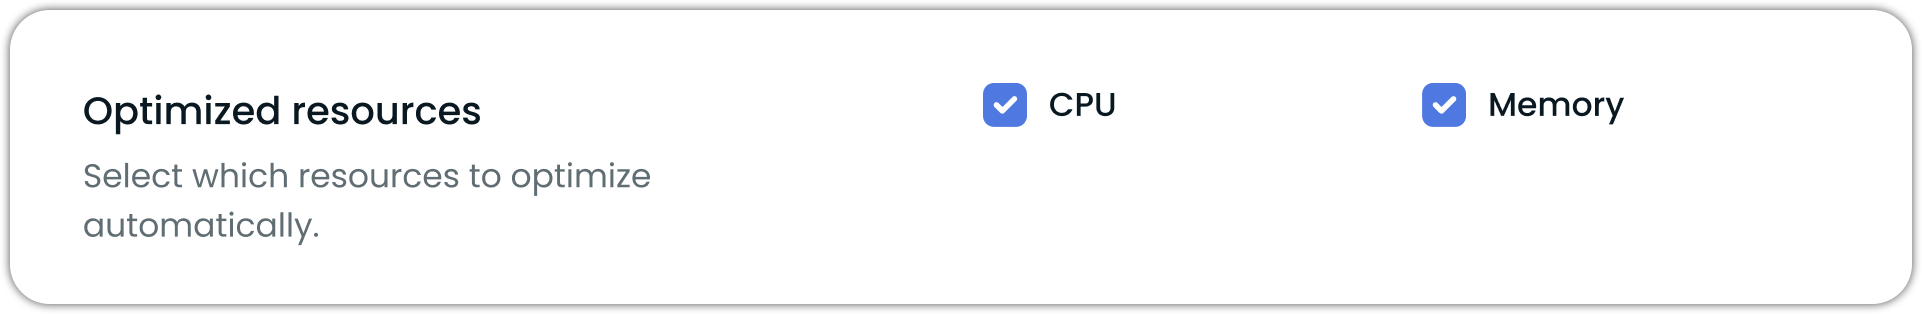
Selective resource optimization controls in the vertical scaling policy settings
NoteAt least one resource type must remain enabled – you cannot disable both CPU and memory optimization simultaneously.
Version requirements
The minimum required workload-autoscaler component version to use this feature is v0.23.1.
Configuration options
At the policy level, you can configure resource-specific optimization through:
- The Cast AI console UI using the resource checkboxes
- The Workload Autoscaler API or the Terraform module
To override this setting for individual workloads, use annotations:
workloads.cast.ai/configuration: |
  vertical:
    memory:
      optimization: off
For detailed reference information on Workload Autoscaler annotations, see Configuration via annotations.
Container exclusions
You can exclude specific containers from automatic optimization within a scaling policy. Excluded containers retain their current resource settings and are not scaled by the Workload Autoscaler. Recommendations are still generated and visible in the event log and the workload detail view.
This setting is configured under the Selective optimization section of a vertical scaling policy, alongside the resource selection (CPU/Memory) described above.
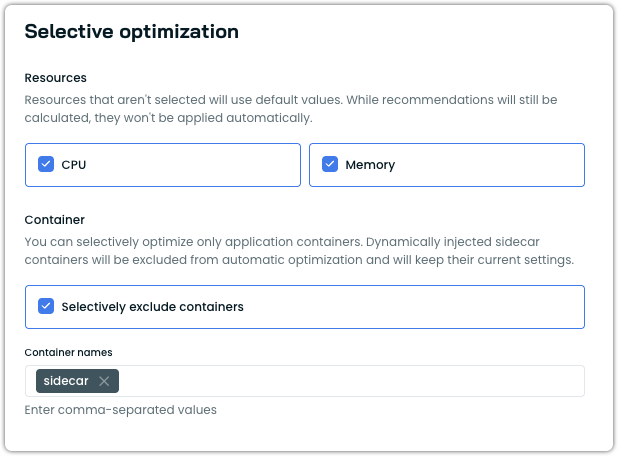
Container exclusion settings under Selective optimization
Note
excludedContainerstargets containers explicitly defined in your pod spec, such as application containers or native Kubernetes sidecar containers. For information on dynamically injected containers, see Sidecar container support.
Configuring container exclusions
To exclude containers from optimization in the Cast AI console:
- Navigate to Workload Autoscaler → Scaling policies.
- Edit an existing policy or create a new one.
- Under the Vertical Rightsizing tab, locate the Selective optimization section.
- In the Container subsection, enable Selectively exclude containers.
- Enter the exact container names to exclude, separated by commas.
- Save the policy.
Container exclusions can also be configured via annotations:
workloads.cast.ai/configuration: |
  vertical:
    excludedContainers:
      - istio-proxy
      - logging-agent
For the full annotation reference, see vertical.excludedContainers.
When to apply changes
| Setting Name | Description | Possible Values | Default Value |
|---|---|---|---|
| Apply type | Controls how and when the Workload Autoscaler applies recommendations to workloads. | immediate, deferred | immediate |
Immediate mode
When set to immediate, the Workload Autoscaler proactively implements resource optimization. The system monitors your workloads and applies new resource recommendations when they exceed the configured thresholds. This approach prioritizes rapid resource optimization, automatically triggering pod restarts to implement the new allocations.
- Apply recommendations as soon as they exceed the configured thresholds
- Trigger pod restarts to implement the new resource allocations immediately
How immediate mode applies recommendations
How immediate mode applies recommendations
When immediate mode applies a recommendation, the Workload Autoscaler updates annotations on the pod spec template of your workload (Deployment, StatefulSet, etc.). This annotation change triggers the Kubernetes controller to perform a rollout, replacing pods with new ones that have the updated resource requests applied via the Cast AI mutating webhook.
Because the Kubernetes controller manages the actual pod replacement:
- Rollout strategies are respected: The controller follows whatever rollout strategy you have configured (e.g.,
RollingUpdate,Recreate). - Pod Disruption Budgets are honored: Any PDBs configured for your workloads will be enforced during optimization cycles.
- Workload-specific behavior applies: StatefulSets, Deployments, and other controller types each follow their native update mechanisms.
Single-replica deployments with RollingUpdateFor single-replica Deployments using
strategy.type: RollingUpdatewith default settings, Kubernetes roundsmaxSurge: 25%up to 1 andmaxUnavailable: 25%down to 0. This means Kubernetes launches a replacement pod first and only terminates the original after the new pod is ready—avoiding downtime natively without requiring Cast AI's zero-downtime feature. Workloads withstrategy.type: Recreateor explicitmaxUnavailable: 1settings will experience brief downtime during recommendation application.
Rollout behavior
When using immediate mode, you can control how Workload Autoscaler rolls out recommendations to your pods. Under Advanced settings, the Rollout behavior section groups all three controls: Zero-downtime updates for single-replica workloads, Evict pods one by one to minimize disruption during resource adjustments, and Eviction delay to pace how often Workload Autoscaler evaluates the next eviction.
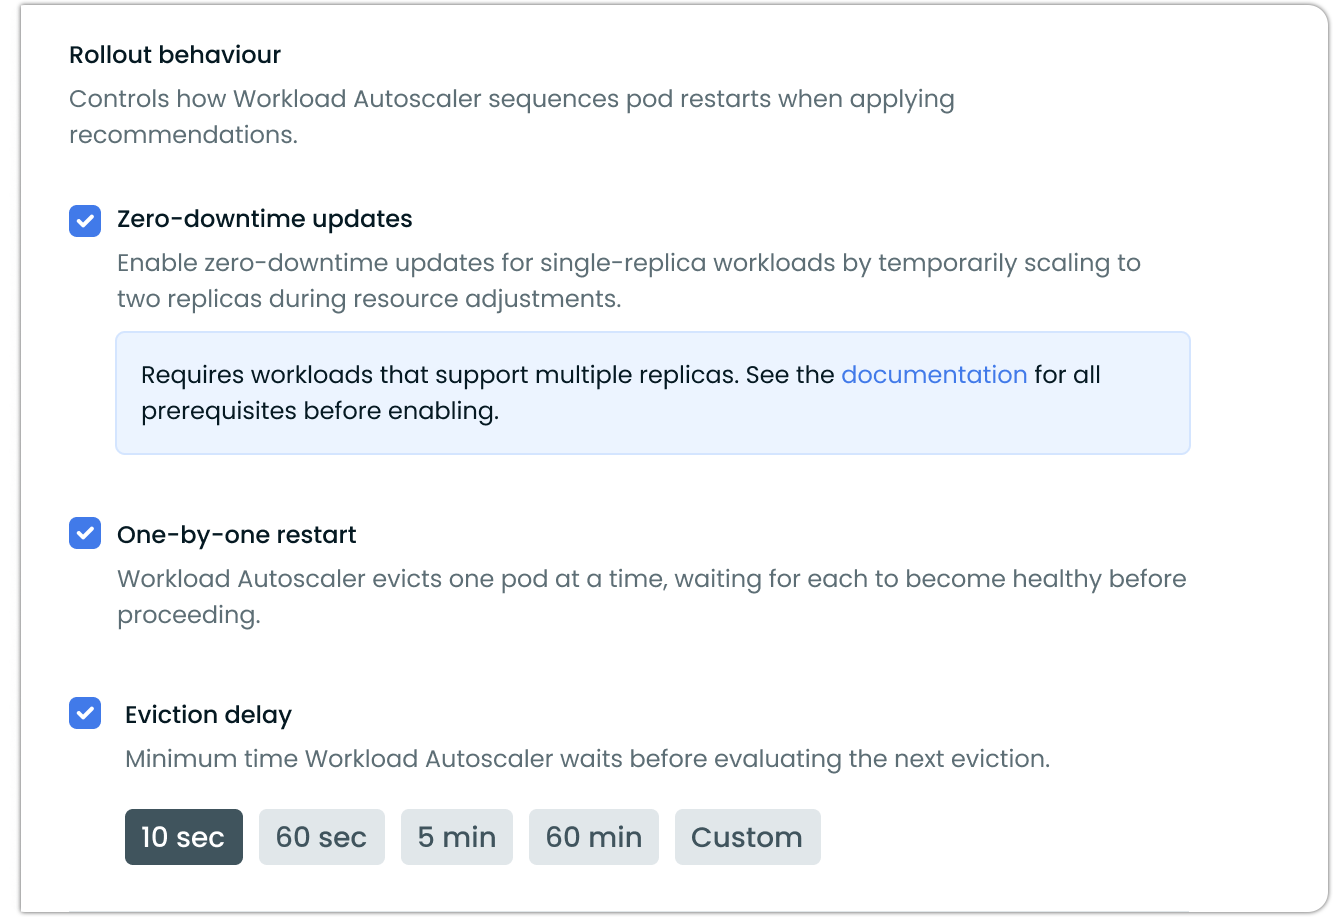
Zero-downtime updates
The Workload Autoscaler provides a zero-downtime update mechanism for single-replica workloads. This feature enables resource adjustments without service interruptions by temporarily scaling to two replicas during updates.
How it works
When enabled, this setting:
- Temporarily scales single-replica deployments to two replicas
- Applies resource adjustments to the new pods
- Waits for the new pod to become healthy and ready
- Scales back to one replica, removing the original pod
Thus, it maintains continuous service availability throughout the process. This setting is especially valuable for applications where even brief interruptions could cause failed requests or other issues.
Configuring zero-downtime updates
You can enable this feature in your vertical scaling policy settings:
- Navigate to the Workload Autoscaler → Scaling policies section
- Edit an existing policy or create a new one
- Under Advanced settings, locate the Rollout behavior section
- Check Zero-downtime updates
Prerequisites
For zero-downtime updates to work effectively, your workloads must meet these requirements:
- This feature is only applicable to Deployment resources that support running as multi-replica
- Running with a single replica (replica count = 1)
- Deployment's rollout strategy allows for downtime
- It works with the immediate apply type and is not needed for deferred mode
- Must not use PersistentVolumeClaims (PVCs)
- It requires
workload-autoscalercomponent version v0.35.3 or higher
For workloads where brief interruptions are unacceptable, this setting provides a way to achieve continuous availability without permanently increasing replica counts and associated costs.
Evict pods one by one
When Evict pods one by one is enabled, immediate mode applies recommendations as follows:
- Sequential processing: The system applies the recommendation to a single pod at a time
- Health verification: Waits for each pod to become healthy and ready before proceeding
- Gradual rollout: Moves to the next pod only after the previous one is successfully running
- Automatic recovery: If a pod fails to start, the rollout pauses until the workload recovers
This ensures gradual rollouts and maintains service availability throughout the resource adjustment process.
You can enable this feature through the Cast AI console:
- Navigate to Workload Autoscaler → Scaling policies
- Select or create a policy with When to apply changes set to Immediately
- Under Advanced settings, locate Rollout behavior
- Check Evict pods one by one
- Save the policy
You can also configure this setting using annotations:
apiVersion: apps/v1
kind: Deployment
metadata:
  name: my-app
  annotations:
    workloads.cast.ai/configuration: |
      vertical:
        optimization: on
        applyType: immediate
      rolloutBehavior:
        type: NoDisruption
        preferOneByOne: true
        delaySeconds: 120
spec:
  # deployment spec...
For more information on configuring workloads via annotations, see Annotations reference.
NoteThe one-by-one restart feature is currently opt-in. Based on customer feedback and continued improvements, it may become the default behavior in system policies in future releases.
Eviction delay
Eviction delay sets a minimum wait time between evictions while Workload Autoscaler rolls out a recommendation. The delay applies whether or not Evict pods one by one is enabled — it controls how often Workload Autoscaler evaluates the next eviction during any rollout.
You can enable this feature through the Cast AI console:
- Navigate to Workload Autoscaler → Scaling policies
- Select or create a policy with When to apply changes set to Immediately
- Under Advanced settings, locate Rollout behavior
- Check Eviction delay and select a preset (10 sec, 60 sec, 5 min, 60 min) or enter a custom value
You can also configure this setting using the rolloutBehavior.delaySeconds annotation. See Annotations reference for details.
Supported workload types
The one-by-one restart feature works with the following workload types:
- Deployments
- StatefulSets
- ReplicaSets
- ArgoCD Rollouts
Not supported: Bare pods, CronJobs, Jobs, and other non-replicated workloads.
Version requirements
To use the one-by-one restart feature, ensure you have the following minimum versions:
| Component | Minimum Version |
|---|---|
| castai-workload-autoscaler | v0.57.0 |
| Helm chart | 0.1.127 |
Considerations and limitations
When using one-by-one restart, be aware of these considerations:
Rollout duration: For workloads with many replicas (100+), the gradual rollout process may take longer depending on pod startup time. This is expected behavior as each pod must become healthy before the next one is processed.
Mid-rollout recommendations: If a new recommendation is generated while a rollout is in progress, it takes precedence. For example, if half the pods have been updated with an immediate recommendation and a deferred recommendation is then issued, the rollout will stop. The new deferred recommendation will be applied to the remaining pods only during their natural restarts.
Failed pod scenarios: If a pod fails to start during the rollout (for example, due to image pull errors or application crashes), the entire rollout pauses until the workload recovers. This prevents further disruption but requires manual intervention to resolve the underlying issue.
OOM kills and surge handling: When enabled, OOM kill responses and surge-triggered adjustments also follow the one-by-one pattern, which may delay the system's response to these events.
Deferred mode
When set to deferred, the Workload Autoscaler takes a non-disruptive approach to resource optimization. Rather than forcing changes immediately, the system stores recommendations and waits for natural pod lifecycle events to apply them. When pods restart for other reasons—such as application deployments, scaling events, or node maintenance—the pending recommendations are seamlessly applied.
- Store recommendations, but do not forcibly apply them
- Apply recommendations only when pods naturally restart (e.g., during deployments, scaling events, or node maintenance)
Recommendation Annotations in Different Scaling Modes
When the Workload Autoscaler applies recommendations to your workloads, it adds annotations to track when and which recommendations have been applied.
| Annotation | Description |
|---|---|
autoscaling.cast.ai/vertical-recommendation-hash | A hash value representing the applied recommendation. This annotation appears on all workloads with applied recommendations, regardless of the scaling mode. |
autoscaling.cast.ai/recommendation-applied-at | A timestamp indicating when the recommendation was actively applied to the workload. This annotation only appears on workloads using the immediate apply type. |
Scaling Mode Behavior
-
Immediate mode: Both annotations will be present. The
recommendation-applied-atannotation captures the exact time when the recommendation was applied, and pod restarts were triggered. -
Deferred mode: Only the
vertical-recommendation-hashannotation will be present. Since recommendations are only applied during natural pod restarts in deferred mode (without forcing controller restarts), therecommendation-applied-atannotation is not added. You can determine when the recommendation was applied by looking at the pod's creation timestamp, as this corresponds to when the pod naturally restarted and incorporated the recommendation.
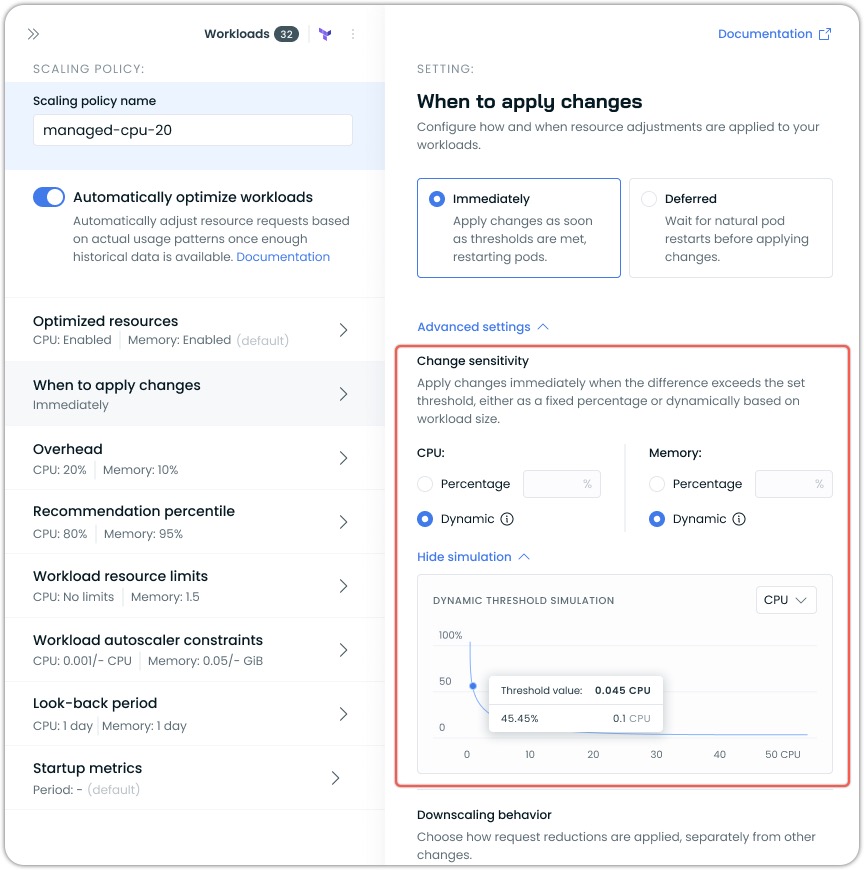
Change Sensitivity
Change sensitivity determines when the Workload Autoscaler applies resource recommendation changes to your workloads. The sensitivity represents the minimum percentage difference between current resource requests and new recommendations that triggers an update.
Workload Autoscaler offers two sensitivity options in the UI:
- Percentage: A fixed threshold value that applies equally to all workloads
- Dynamic: An adaptive threshold that automatically adjusts based on workload size
Dynamic vs Percentage Sensitivity
Percentage Sensitivity
A percentage sensitivity applies the same fixed percentage to all workloads regardless of their size. For example, with a 10% sensitivity:
- A workload requesting 100m CPU will only be scaled if the new recommendation differs by at least 10m
- A workload requesting 10 CPUs will only be scaled if the new recommendation differs by at least 1 CPU
While this is straightforward, it can be less optimal for workloads of varying sizes.
Dynamic Sensitivity (Recommended)
The dynamic sensitivity automatically adjusts based on workload size, providing more appropriate scaling behavior:
- For small workloads: Uses a higher threshold percentage to prevent frequent, insignificant updates
- For large workloads: Uses a lower threshold percentage to enable meaningful optimizations
This helps prevent unnecessary pod restarts for small workloads while ensuring larger workloads are also efficiently optimized.
Recommendations
For most users, we recommend using the Dynamic sensitivity setting, as it provides appropriate thresholds across workloads of all sizes and requires no manual tuning or maintenance.
The Percentage sensitivity setting is best suited for workloads of similar sizes and behavior when they are managed by the same scaling policy.
Dynamic Sensitivity Simulation
The policy/workload configuration interface includes a sensitivity simulation graph that shows how the dynamic threshold changes based on workload size. This visualization helps you understand how the sensitivity percentage varies as resource requests increase.
Key elements of the simulation:
- The X-axis represents resource requests (CPU or memory)
- The Y-axis represents the threshold percentage
- The curve shows how the threshold decreases as resource size increases
You can toggle between CPU and memory views using the dropdown.
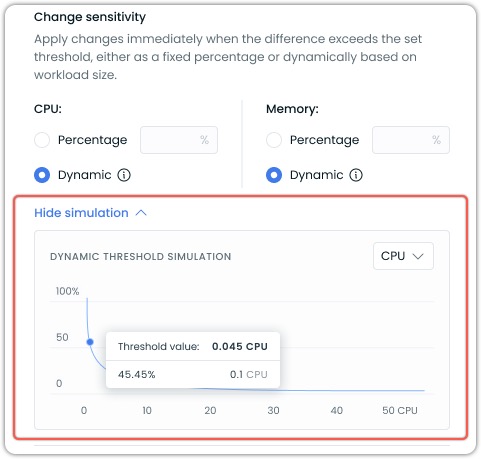
The threshold value indicator shows the exact sensitivity percentage that would apply to a specific resource request amount. For example, in the screenshot above, a request of 0.1 CPU would have a threshold of 45.45%. Meaning it would need to change by that amount to trigger a change.
Advanced Configuration Options
While the UI offers simplified access to dynamic sensitivity settings, power users can access additional customization options through annotations. These advanced options include:
- Custom adaptive thresholds with configurable parameters
- Independent sensitivity settings for CPU and memory
- Fine-tuning of the adaptive algorithm formula
For details on these advanced options, refer to our Annotations reference documentation.
Resource overhead
Resource overhead allows you to add a buffer to the recommendations generated by the Workload Autoscaler. This buffer provides extra capacity for your workloads to handle unexpected load increases without immediately triggering scaling events.
Resource overhead is a percentage value that is added to the recommended resource requests. For example, if the recommended CPU usage for a workload is 100m and you set a CPU overhead of 10%, the final recommendation will be 110m.
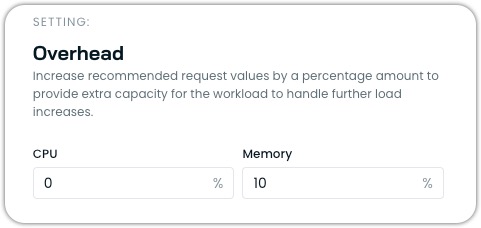
Configuring resource overhead
You can configure different overhead values for CPU and memory:
- CPU Overhead: Typically set between 10% (default) and 20%.
- Memory Overhead: Typically set between 10% (default) and 30%.
Properly configured overhead helps prevent out-of-memory (OOM) events and CPU throttling while maintaining cost efficiency.
Limitations
- Overhead cannot exceed 250% (2.5), as extremely high values could lead to significant resource waste.
- When both Vertical and Horizontal workload scaling are enabled, memory overhead can still be configured as normal, but CPU overhead settings are ignored as the system automatically balances vertical and horizontal scaling.
Recommendation percentile
The recommendation percentile setting determines how conservatively the Workload Autoscaler allocates resources based on the workload's historical usage patterns. It defines how close recommendations should be to observed workload resource usage, with higher percentiles leading to more generous resource allocations.
The recommendation percentile represents the statistical threshold used when analyzing workload resource usage. For example:
- A p80 (80th percentile) setting for CPU means the recommendation will ensure resources are sufficient to handle 80% of all observed load scenarios.
- A max (100th percentile) memory setting means recommendations will account for the absolute highest observed memory usage.
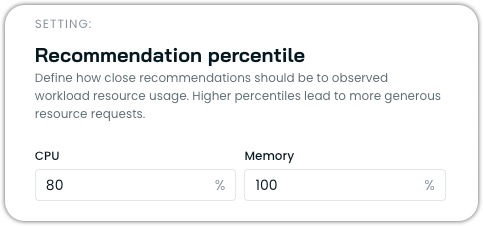
Configuring percentiles
You can configure different percentile values for CPU and memory independently:
- CPU Percentile: Typically set at p80 (default), can range from p50 to max
- Memory Percentile: Typically set at max (default) or p99, rarely lower
The recommendation is calculated using the average target percentile across all pods spanning the recommendation period. When you set the percentile to "max" (100%), the system will use the maximum observed value over the period instead of the average across pods.
Workload resource limits
Workload resource limits allow you to configure how container resource limits are managed relative to the resource requests that Workload Autoscaler optimizes. This feature provides fine-grained control over the relationship between requests and limits, ensuring your workloads have the right balance of resource guarantees and constraints.
In Kubernetes, each container can specify both resource requests (guaranteed resources) and resource limits (maximum allowed resources). The Workload Autoscaler primarily optimizes resource requests based on actual usage patterns, but the workload resource limits setting determines how container limits are handled during this optimization.
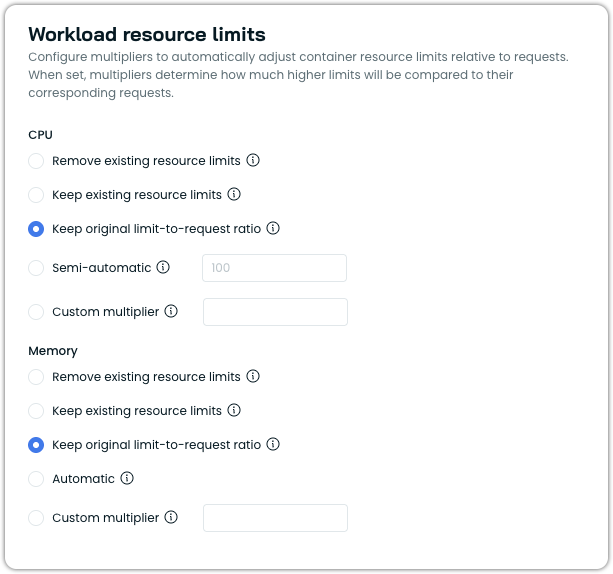
Configuration options
You can configure resource limits separately for CPU and memory.
CPU limit options
- Remove limits: Removes any existing resource limits from containers, including those specified in your workload manifest.
- Keep existing resource limits: Preserves the existing limits as defined in the workload manifest without modification.
- Keep original limit-to-request ratio: Scales limits proportionally with recommended requests, preserving the original limit-to-request ratio from the workload manifest. For example, if the original limit is 2× the request, the updated limit stays 2× the new request. If the workload has no existing CPU limit, this option falls back to the default behavior (no limit).
- Semi-automatic: Sets CPU limits as a multiple of requests when workloads already have CPU limits defined and those existing limits are lower than the calculated result. Otherwise, limits remain unchanged.
- Custom multiplier: Sets CPU limits as a multiple of requests for all workloads (e.g.,
2.0means limits = requests × 2).
Memory limit options
- Automatic (default): Automatically sets memory limits to 1.5x requests (with a minimum of 128MiB) when limits are lower than this value. If existing limits are higher, they remain unchanged.
- Remove limits: Removes any existing resource limits from containers, including those specified in your workload manifest.
- Keep existing resource limits: Preserves existing resource limits as defined in your workload manifest without modification.
- Keep original limit-to-request ratio: Scales limits proportionally with recommended requests, preserving the original limit-to-request ratio from the workload manifest. For example, if the original limit is 2× the request, the updated limit stays 2× the new request. If the workload has no existing memory limit, a default 1.5× multiplier is applied to the recommended request. The 128MiB minimum memory limit applies.
- Custom multiplier: Set memory limits as a multiple of the requests (e.g.,
2.0means limits = requests × 2).
Impact on resource management
The relationship between requests and limits affects how Kubernetes schedules and manages your workloads:
- Scheduling: Pods are scheduled based on requests, not limits.
- CPU Throttling: Containers using more CPU than their limit will be throttled.
- OOM Kills: Containers exceeding memory limits will be terminated (OOM killed), as they cannot burst past the limit.
Even though Cast AI does not recommend using resource limits on workloads actively managed by Workload Autoscaler, properly configured limits can prevent problems from neighboring workloads and provide predictable performance.
Limitations
- The multiplier value must be greater than or equal to
1.0 - When setting a custom multiplier, Workload Autoscaler will never reduce existing limits below the calculated value (limits = requests × multiplier)
- Workload Autoscaler enforces a minimum memory limit of 128MiB whenever it calculates a memory limit (Automatic, Custom multiplier, Semi-automatic, and Keep original limit-to-request ratio modes). This floor prevents unreasonably low memory allocations.
Workload Autoscaler constraints
Workload Autoscaler constraints allow you to set minimum and maximum resource limits that the Workload Autoscaler will respect when generating and applying recommendations. These constraints act as guardrails to prevent resources from being scaled too low or too high, ensuring your workloads maintain appropriate resource boundaries.
These constraints define the allowed resource scaling range for each container managed by the autoscaler. By setting these constraints, you can:
- Prevent resources from being scaled below a functional minimum
- Limit maximum resource allocation to control costs
- Customize scaling boundaries for each container individually
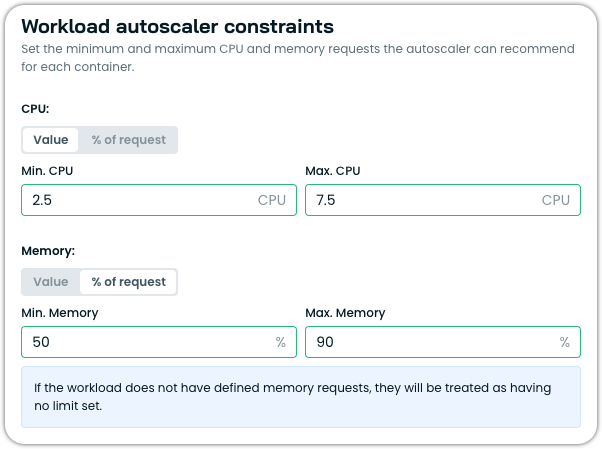
Constraint types
Each constraint (min or max) can be set using one of two modes, selectable via the Value or % of request toggle in the UI:
| UI mode | Annotation type | Description |
|---|---|---|
| Value | constant | An absolute Kubernetes resource value (e.g., 500m, 2Gi). |
| % of request | percentageOfOriginal | A percentage of the workload's original resource request (e.g., 90 = 90% of original). |
Note% of request requires the workload to have defined resource requests. If a workload does not have defined requests, the constraint will be treated as having no limit set. This mode is not supported for custom workloads or injected containers.
Configuration options
Constraints can be configured at two levels.
Policy-level constraints (global)
Policy-level constraints apply to all workloads associated with a scaling policy. These constraints serve as default guardrails for all containers managed by that policy.
You can set:
- Global minimum CPU and memory limits
- Global maximum CPU and memory limits
Container-level constraints
For more granular control, you can specify constraints for individual containers within a workload using annotations. Container-specific constraints override policy-level constraints when both are defined.
Container constraints include:
- Minimum and maximum CPU resources
- Minimum and maximum memory resources
Annotations example
For workloads with multiple containers with different resource profiles, you can set specific constraints for each using annotations:
workloads.cast.ai/configuration: |
  vertical:
    containers:
      app-server:
        cpu:
          constraints:
            min:
              type: constant
              value: 500m
            max:
              type: constant
              value: 2000m
        memory:
          constraints:
            min:
              type: constant
              value: 1Gi
            max:
              type: constant
              value: 4Gi
      metrics-sidecar:
        cpu:
          constraints:
            min:
              type: constant
              value: 10m
            max:
              type: constant
              value: 100m
        memory:
          constraints:
            min:
              type: constant
              value: 64Mi
            max:
              type: constant
              value: 256Mi
This allows for precise control over scaling boundaries for each container within your pod.
NoteWhen configuring container-specific constraints, the container name must match exactly what's defined in the pod specification.
Use cases
Workload Autoscaler constraints are valuable in multiple scenarios.
Setting minimum CPU/memory resources ensures business-critical services never scale below functional thresholds. Some applications (like JVM-based services) need a certain amount of memory to function, so setting a minimum for them will prevent performance issues on cold starts. For JVM-specific optimization that uses actual heap metrics, see JVM workload optimization.
Setting maximum CPU/memory resources is typically done for reasons such as:
- Cost Control: Limiting maximum resources prevents unexpected cost increases
- Compliance: Enforcing organizational policies about resource consumption limits
Look-back period
The look-back period defines the timeframe the Workload Autoscaler uses to observe CPU and memory usage when calculating scaling recommendations. This feature allows you to customize the historical data window used for generating recommendations, which can be particularly useful for workloads with atypical resource usage patterns.
You can configure the look-back period under the Advanced Settings of a vertical scaling policy:
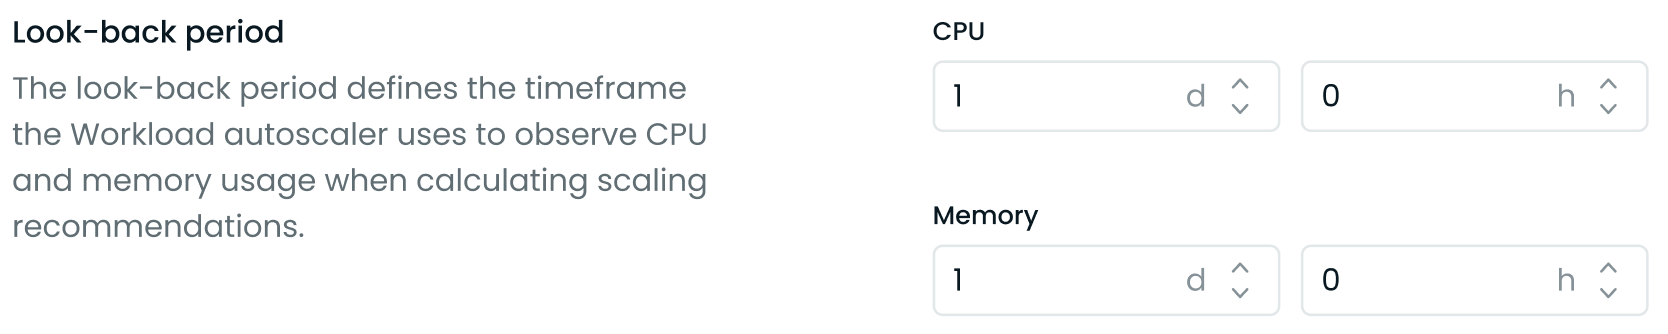
Look-back period in Advanced Settings
- Set the look-back period for CPU and memory separately.
- Specify the duration in days (d) and hours (h). The minimum allowed period is 3 hours, and the maximum is 7 days.
This feature allows you to:
- Adjust the recommendation window based on your workload's specific resource usage patterns.
- Account for longer-term trends or cyclical resource usage in your applications.
You can configure this setting at different levels:
- Policy level: Apply the setting to all workloads assigned to a specific scaling policy.
- Individual workload level: Configure the setting for a specific workload using annotations to override policy-level settings.
The look-back period can also be configured via Annotations, the API, or Terraform.
Choosing the right look-back period
The optimal look-back period largely depends on your workload's resource usage patterns. Most applications benefit from a shorter look-back period of 1-2 days. This approach works particularly well for standard web applications, capturing daily usage patterns while maintaining high responsiveness to changes. Shorter periods enable more aggressive optimization and often lead to higher savings.
Some workloads, however, require longer observation periods of 3-7 days. Applications with significant differences between weekday and weekend usage patterns benefit from a 7-day period to capture these weekly variations. Batch processing jobs that run every few days need a look-back period that covers at least one full job cycle to prevent potential out-of-memory (OOM) situations.
Common use cases and recommended periods:
- High-frequency trading or real-time applications: 3-6 hours for rapid scaling response
- Standard web applications: 1-2 days captures daily patterns while maintaining responsiveness to changes
- Batch processing jobs: Set to cover at least one full job cycle to account for periodic resource spikes
- Weekend-sensitive workloads: 7 days to capture both weekday and weekend patterns
- Variable workloads: Start with 1-2 days and adjust based on observed scaling behavior
TipFor workloads with variable or uncertain patterns, start with a shorter period and adjust based on observed behavior. The key is to match the look-back period to your application's actual resource usage patterns – whether that's daily consistency, weekly cycles, or periodic processing jobs.
Ignore startup metrics
Some workloads, notably Java and .NET applications, may have increased resource usage during startup that can negatively impact vertical workload scaling recommendations. To address this, Cast AI allows you to ignore startup metrics for a specified duration when calculating these recommendations. For Java workloads, also consider enabling JVM heap-based optimization, which uses actual JVM runtime metrics for more accurate memory recommendations.
You can configure this setting in the Cast AI console under the Advanced Settings of a vertical scaling policy:
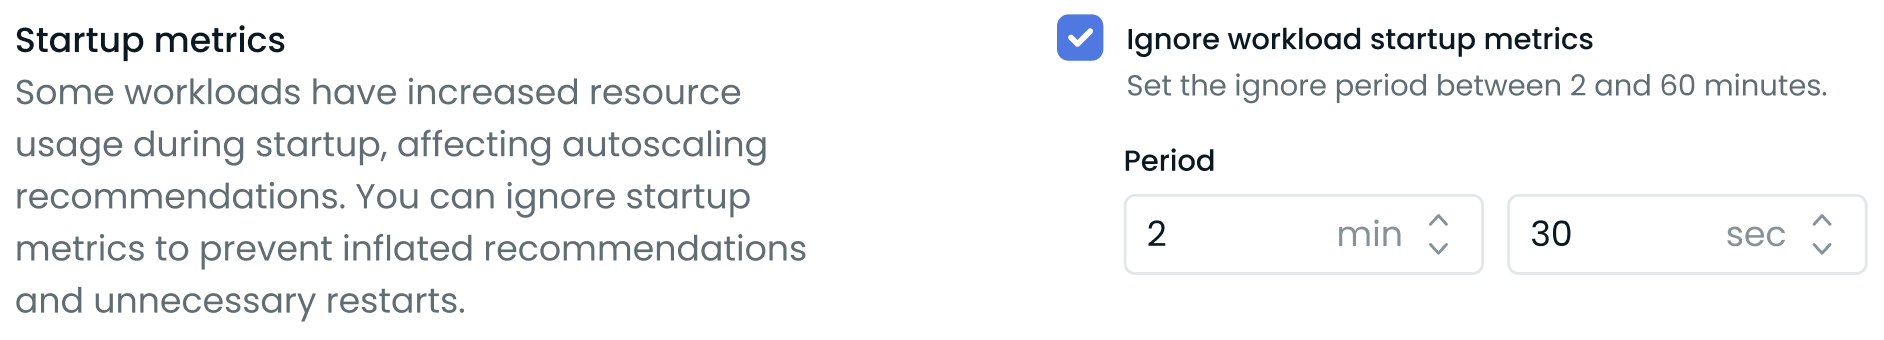
Startup metrics at the vertical scaling policy level
- Enable the feature by checking the Ignore workload startup metrics box.
- Set the duration to exclude from vertical workload scaling recommendation generation after a workload starts (between 2 and 60 minutes).
This feature helps prevent inflated vertical scaling recommendations and unnecessary pod restarts caused by temporary resource spikes during application initialization.
NoteThe startup metrics exclusion only applies to vertical workload scaling; horizontal scaling will still respond normally to resource usage during startup.
You can also configure this setting via the API or Terraform.
Related featureThe configured startup period also determines the duration of the startup phase in startup recommendations — a feature that applies original CPU requests during pod initialization to prevent slow starts and HPA spikes.
Recommendation confidence
The recommendation confidence setting determines the minimum confidence level required before Workload Autoscaler automatically applies resource recommendations to workloads assigned to this policy.
How confidence works
Workload Autoscaler calculates confidence based on the quality and quantity of historical usage data available for each workload. Confidence is expressed as a percentage that represents the ratio of collected metric data points to the expected number of data points within the configured look-back period.
For example, with a 7-day look-back period:
- 100% confidence means the workload has complete metric coverage for all 7 days
- 90% confidence (default threshold) means at least 90% of expected metric data points have been collected
- 40% confidence represents the minimum metric density needed beyond the initial 24-hour period
The confidence score reflects both:
- Time coverage: How long the workload has been monitored
- Data completeness: The density and continuity of collected metrics within that period
Confidence levels:
- Full confidence: The workload has sufficient historical data for reliable, unrestricted recommendations. Optimization proceeds based on comprehensive usage analysis without artificial limits.
- Low confidence: The workload lacks sufficient historical data for reliable analysis. The autoscaler applies different strategies based on how optimization was enabled:
- Policy-optimized workloads: Receive gradual scaling with conservative limits during the confidence-building period
- Manually enabled workloads: Receive unrestricted recommendations immediately, bypassing confidence checks
Setting the confidence threshold
Set the minimum confidence level required before automatically applying resource recommendations to workloads assigned to this policy. The default value is 90%.
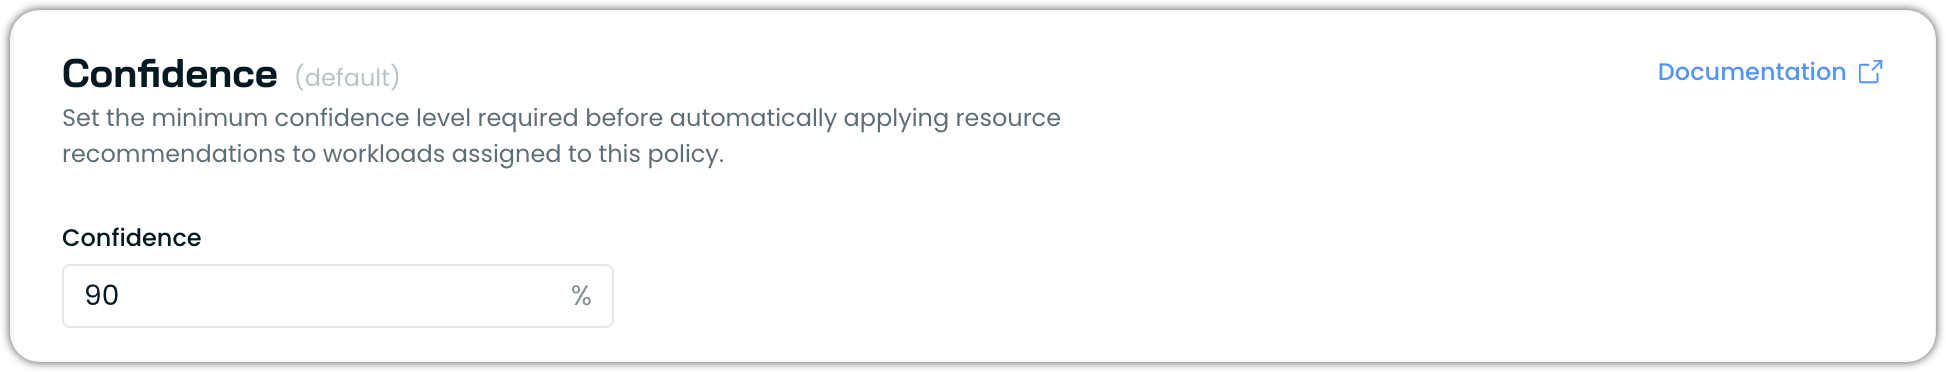
Confidence (default: 90%)
- Lower values (e.g., 50-80%): Allow earlier optimization with less historical data. Useful for faster time-to-value but may be less reliable for workloads with variable usage patterns.
- Higher values (e.g., 95-100%): Wait for more complete historical data before applying recommendations. Provides more reliable optimization but delays scaling actions.
Gradual scaling for new clusters
For newly onboarded clusters (within the first 24 hours), Workload Autoscaler provides immediate optimization benefits through gradual scaling, even for workloads with low confidence. This allows you to see optimization results within hours rather than waiting days for complete data collection.
| Workload Data | Max Resource Request Adjustment | Behavior After Threshold |
|---|---|---|
| < 2.4 hours | 10% | - |
| < 6 hours | 25% | - |
| < 24 hours | 35% | - |
| > 24 hours | - | Confidence-based optimization |
During this period:
- Policy-optimized workloads automatically receive conservative resource adjustments with progressive limits
- Manually enabled workloads (via annotations or direct UI toggle) bypass gradual scaling and receive unrestricted recommendations immediately
Building sufficient confidence
For the Workload Autoscaler to consider confidence sufficient for unrestricted optimization:
-
Minimum monitoring period: The workload must be monitored for at least 24 hours, even for existing workloads in newly connected clusters.
-
Adequate metric density: Beyond the minimum 24-hour requirement, workloads with longer look-back periods need metrics for approximately 40% of the configured period. For example, with a 7-day lookback period, confidence continues to build over approximately 3 days of continuous operation.
Cluster hibernation impactIf your cluster uses hibernation or has scheduled downtime periods, confidence calculations may be affected. During hibernation, no metrics are collected, which reduces the metric density used to calculate confidence scores. Workloads in hibernating clusters may require longer active periods to reach the configured confidence threshold before automatic optimization begins.
Stall detection
Stall detection uses Pressure Stall Information (PSI) metrics to identify CPU contention that standard usage metrics miss. When workloads experience CPU stall above configured thresholds, Workload Autoscaler automatically increases resource recommendations to reduce contention.
Resource contention can cause workloads to underperform even when CPU usage appears normal. This happens when requests are set too low or the node lacks effective headroom. Stall detection captures this hidden contention and responds by adjusting resources, providing a more accurate signal than traditional CPU utilization alone.
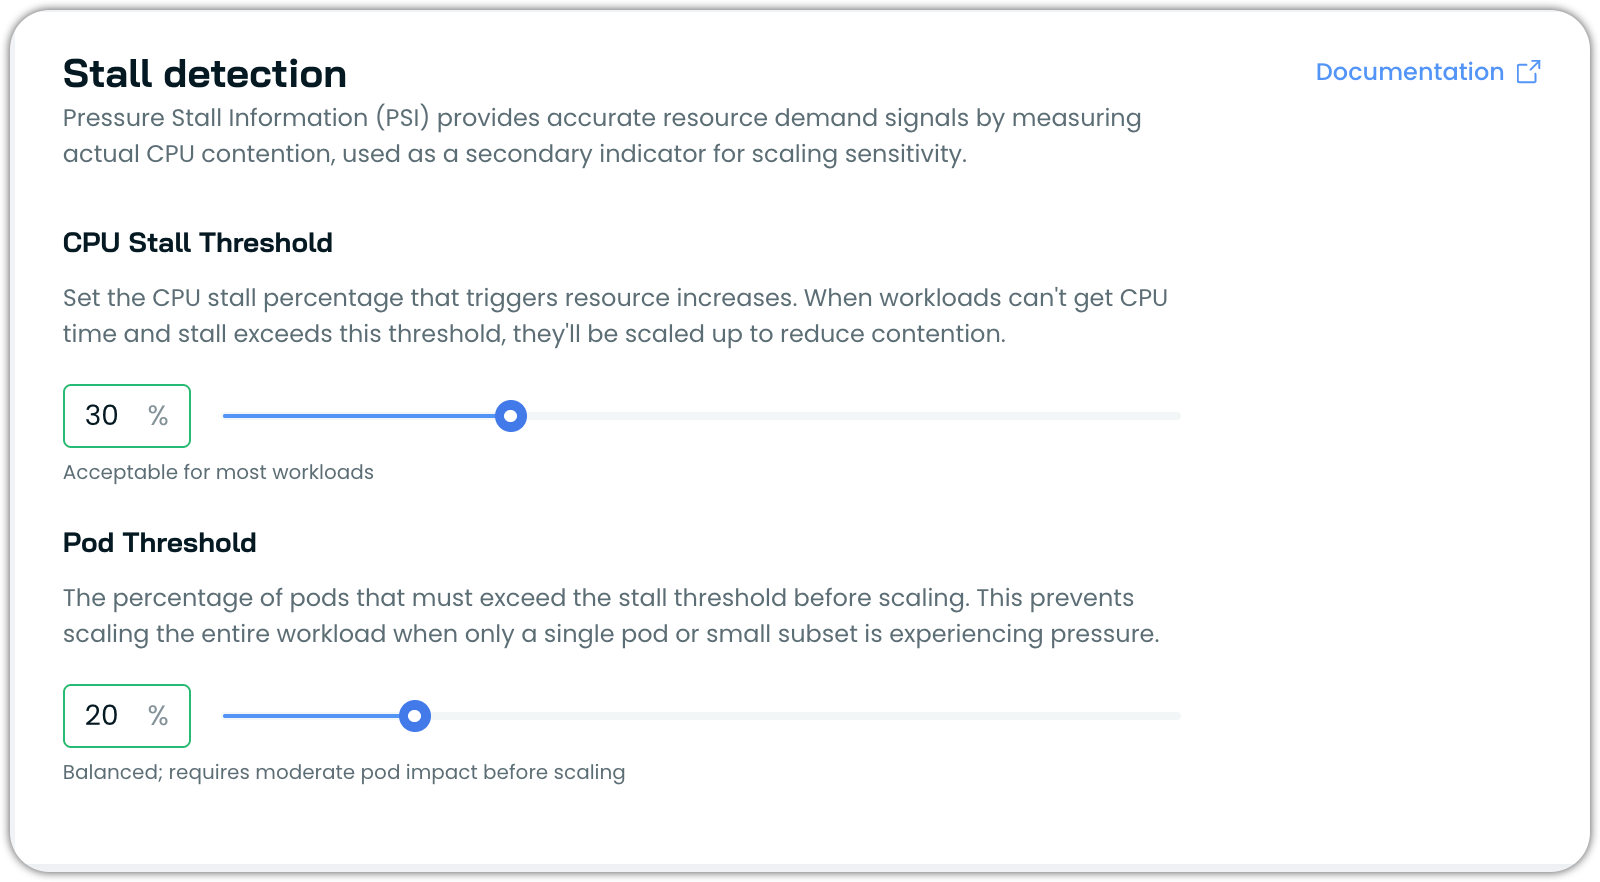
CPU stall threshold
The CPU stall percentage that triggers resource increases. When workloads can't get CPU time and stall exceeds this threshold, they'll be scaled up to reduce contention.
The stall percentage is measured over a 5-minute window. For example, a 50% threshold means workloads stalling for more than 2.5 minutes within each 5-minute period will trigger scaling.
| Setting | Description | Value range | Default |
|---|---|---|---|
| CPU Stall Threshold | Percentage of time spent waiting for CPU that triggers scaling. | 1–100% | Varies by system policy |
System policies have the following default CPU stall thresholds:
| Policy | CPU Stall Threshold | Description |
|---|---|---|
| cost-saving | 30% | Moderate contention acceptable |
| burstable | 50% | Higher contention acceptable |
| balanced | 10% | Light contention acceptable |
| stability/resiliency | 5% | Minimal contention; prioritize responsiveness |
Custom policies inherit stall detection settings from the balanced policy by default.
Pod threshold
The percentage of pods that must exceed the stall threshold before scaling. This prevents scaling the entire workload when only a single pod or a small subset is experiencing pressure.
| Setting | Description | Value range | Default |
|---|---|---|---|
| Pod Threshold | Percentage of pods required above stall threshold | 1–100% | 50% |
For example, with a 50% pod threshold on a workload with 10 pods, at least 5 pods must experience CPU stall above the configured threshold before scaling triggers. All the pods need to report CPU stall above the threshold, it is not an average across affected pods.
How stall detection works
The Workload Autoscaler collects CPU stall metrics per workload container through the Workload Autoscaler Exporter. The system checks each workload every 5 minutes, calculating the percentage of time it was waiting for CPU over that period. If the calculated percentage exceeds the threshold, a new recommendation is generated with adjustments designed to relieve contention. The recommendation is applied according to the scaling mode configured in the policy (immediate or deferred).
When CPU stall is detected, the system adjusts recommendations by:
- Increasing recommendation percentile: Higher percentiles capture more of the workload's resource demand
- Shortening look-back window: Focuses on recent usage patterns rather than historical data
- Increasing overhead: Surfaces "unseen" demand that traditional metrics miss
After issuing a stall-aware recommendation, the system waits 15 minutes before re-evaluating that workload. This stabilization window gives the updated recommendation time to take effect.
These adjustments appear in the Event log with a dedicated "CPU stall detected" event type.
Detection constraints
Stall detection only activates when all of the following conditions are met:
- Workload kind is not DaemonSet
- Vertical autoscaling is enabled for the workload
- If the workload has HPA configured, HPA must be at maximum replicas already
- Latest recommendation was created on the cluster
- Latest recommendation is older than 1 minute
- The CPU stall threshold (derived from the assigned scaling policy) is exceeded
- At least the configured percentage of pods (Pod Threshold) is above the stall threshold
- If the last recommendation was stall-related, at least 15 minutes have passed since it was applied to the workload
Prerequisites
Stall detection requires:
castai-workload-autoscaler-exporter(CME) installed in the cluster. This component is installed by default when installing Workload Autoscaler for new clusters.castai-workload-autoscaler-exporterversion v0.67.0 or above- Kubernetes cluster version 1.34 or above
Once the Workload Autoscaler Exporter is installed on a compatible cluster, PSI metrics are automatically scraped.
Configuring stall detection
You can configure stall detection thresholds when creating or editing a scaling policy:
- Navigate to Workload Autoscaler → Scaling policies
- Edit an existing policy or click Create scaling policy
- Under the Vertical optimization tab, locate Stall detection
- Set the CPU Stall Threshold percentage
- Set the Pod Threshold percentage
- Save the policy
The thresholds you configure apply to all workloads assigned to that scaling policy.
Stall detection can also be configured via annotations. See vertical.anomalyDetection.cpuPressure for details.
HPA converter
When Cast AI optimizes a workload's CPU or memory requests, any existing Horizontal Pod Autoscaler that uses percentage-based utilization targets can drift out of alignment. For example, an HPA targeting 50% CPU utilization effectively targets 500m when the request is 1000m — but only 100m after Cast AI reduces the request to 200m. This mismatch can cause the HPA to scale to maximum replicas unnecessarily.
The HPA converter prevents this by converting utilization-based targets into fixed absolute values calculated from the workload's original (pre-optimization) requests. The conversion preserves the original scaling intent: the same real CPU or memory threshold triggers scaling, regardless of how Cast AI adjusts the request.
When does the converter apply?The HPA converter is designed for workloads that have their own HPA (one you created, or managed by a third-party controller) while Cast AI handles only vertical optimization. If Cast AI's horizontal autoscaling is also enabled for the workload, Cast AI already manages the HPA directly and the converter is not needed.
What gets converted
The converter rewrites Resource and ContainerResource metrics that use target.type: Utilization for CPU or memory. The formula is:
averageValue = original_request × (averageUtilization / 100)For pod-level Resource metrics on multi-container workloads, the total of all container requests is used as the baseline. For ContainerResource metrics, only the named container's request is used.
The converter requires all metrics in the HPA to be CPU or memory Utilization percentages. If the HPA contains any of the following, the converter skips the entire HPA and no metrics are converted:
- External metrics — metrics from outside the cluster (for example, cloud provider queue depth)
Example: external metric target
spec:
  metrics:
  - external:
      metric:
        name: external_metric
      target:
        averageValue: "100"
        type: AverageValue
type: External- Object metrics — metrics from a specific Kubernetes object
Example: object metric target
spec:
  metrics:
  - object:
      metric:
        name: requests-per-second
      describedObject:
        apiVersion: networking.k8s.io/v1
        kind: Ingress
        name: main-route
      target:
        type: Value
        value: "10k"
type: Object- Pods metrics — custom metrics reported per pod
Example: pods metric target
spec:
  metrics:
  - pods:
      metric:
        name: packets-per-second
      target:
        type: AverageValue
        averageValue: "1k"
type: Pods- Already absolute targets — CPU or memory metrics already expressed as
AverageValue
Example: absolute-value target only
spec:
  metrics:
  - resource:
      name: cpu
      target:
        averageValue: 500m
        type: AverageValue
type: Resource- Mixed utilization and absolute-value targets — for example, CPU as
Utilizationand memory asAverageValue
Example: mixed utilization and absolute-value targets
spec:
  metrics:
  - resource:
      name: cpu
      target:
        averageValue: 500m
        type: AverageValue
    type: Resource
  - resource:
      name: memory
      target:
        averageUtilization: 80
        type: Utilization
    type: Resource
How it behaves
- Dynamic recalculation. The converter allows all HPA updates and recalculates the conversion whenever the HPA changes — for example, when you update an existing CPU utilization target or add a memory utilization percentage to an HPA that previously only had CPU.
- Only converted fields change. The target type and value are rewritten. Replicas, behavior, labels, and annotations are untouched.
- You remain the owner. CI/CD pipelines, GitOps controllers, and
kubectledits continue to work. Cast AI re-applies its conversion on top of changes it didn't make. - Automatic revert. Cast AI reverts the converted fields back to their pre-conversion values when any of the following occur:
- You disable the converter or delete the HPA.
- You remove resource requests from the workload, leaving the converter without a calculation baseline.
- You introduce external metrics or otherwise change the HPA configuration to one the converter does not support.
- You enable Cast AI's horizontal autoscaling for a workload that previously used only vertical optimization with the converter. Horizontal autoscaling takes priority and the converter steps aside automatically.
- Automatic refresh. The converter recalculates immediately whenever resource requests change. There is no waiting period.
Supported workload types and version requirements
The converter works with HPAs targeting Deployments, ReplicaSets, StatefulSets, and Argo Rollouts.
| Component | Minimum version |
|---|---|
castai-workload-autoscaler | v1.0.11 |
Enabling the HPA converter
To enable the HPA converter in a scaling policy:
- Navigate to Workload Autoscaler → Scaling policies.
- Edit an existing policy or click Create scaling policy.
- Under the Vertical Rightsizing tab, scroll to HPA converter.
- Enable the Enable HPA converter toggle.
- Save the policy.
The converter can also be enabled via workload annotations:
workloads.cast.ai/configuration: |
  vertical:
    optimization: true
    hpaConverters:
      - type: AverageValueFromOriginalRequests
For the full annotation reference, see vertical.hpaConverters.
Monitoring conversion health
After enabling the converter, watch for two conditions that can reduce its effectiveness:
- HPA maxing out after conversion — if average usage already exceeds the converted absolute target, the HPA will scale to its maximum replica count. This typically means the original utilization percentage was set too low relative to actual usage. Review the HPA's
averageValuetarget against current pod metrics usingkubectl get hpaand consider adjusting the utilization target or workload requests. - Converted target becoming unreachable — if Cast AI's recommended request grows larger than the converted target value, the HPA target can never be reached and scaling will not trigger. This can happen when actual usage rises significantly after conversion. Check that the relationship between the original request, utilization percentage, and current recommendation still makes sense.