
Allocation groups
Allocation groups is a custom-made report that lets you allocate the costs of your cluster per team, application, or other criteria by selecting relevant labels and namespaces. You can use the data to analyze compute costs per created allocation.
How do you create allocation groups?
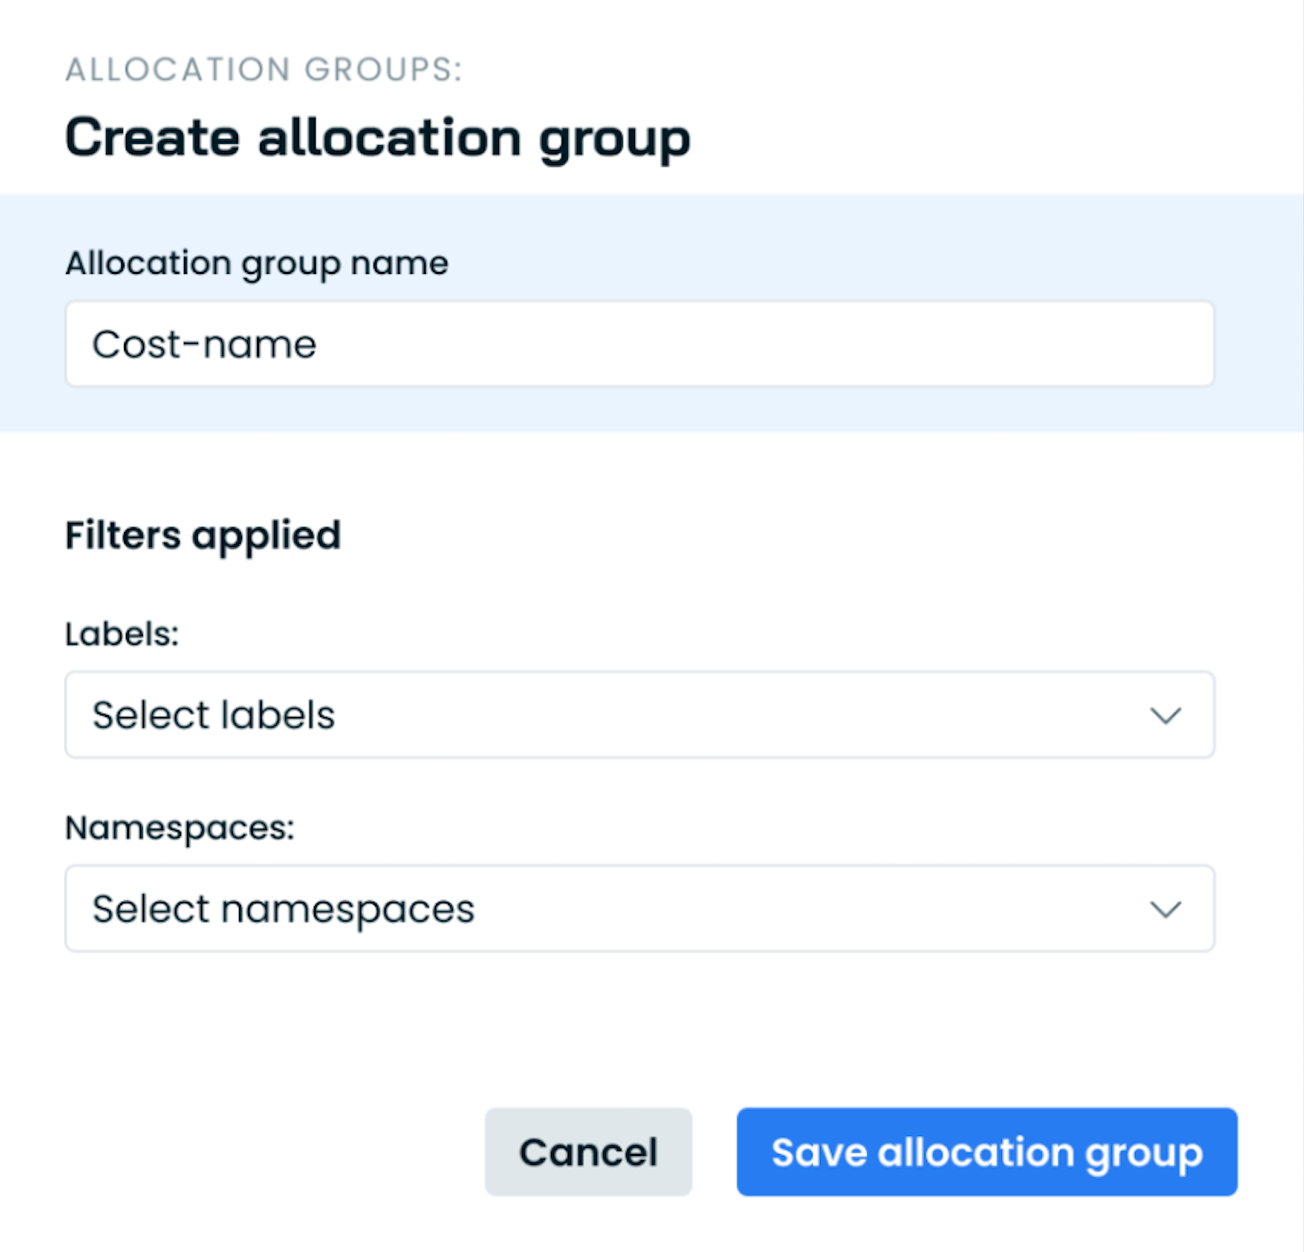
Navigate to the Allocation groups report in the side panel menu. Create an allocation group by clicking on the “Create allocation group” button in the upper right corner of the screen.
Enter your allocation group name and select the relevant namespaces and labels from the list.
NoteMake sure to create a name that reflects your group by entering the application or team name – or anything else that would help understand the contents of the group in the future.
Once everything is selected, save your allocation group. You’ll see this group's data in the report.
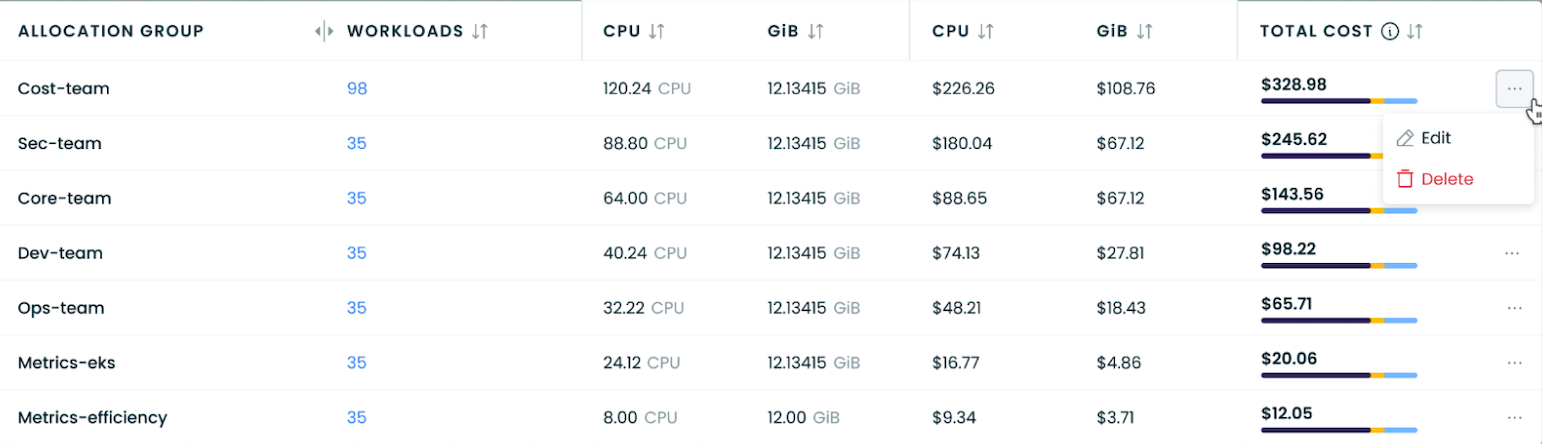
To manage your allocation groups (edit or delete them), select the allocation group you want to manage, click on the menu near it, and select the action.
Allocation groups report
Once you create your allocation groups, this report lets you see your cluster costs broken down by allocation groups. You can use this data to analyze compute expenses per allocation group, identify inefficiencies, and discover potential savings opportunities.
At the moment, the Allocation groups report provides one view:
- Daily allocation groups cost chart,
- List of allocation groups with cost details per selected period,
- List of workloads in the allocation group (once you click on the workload link).
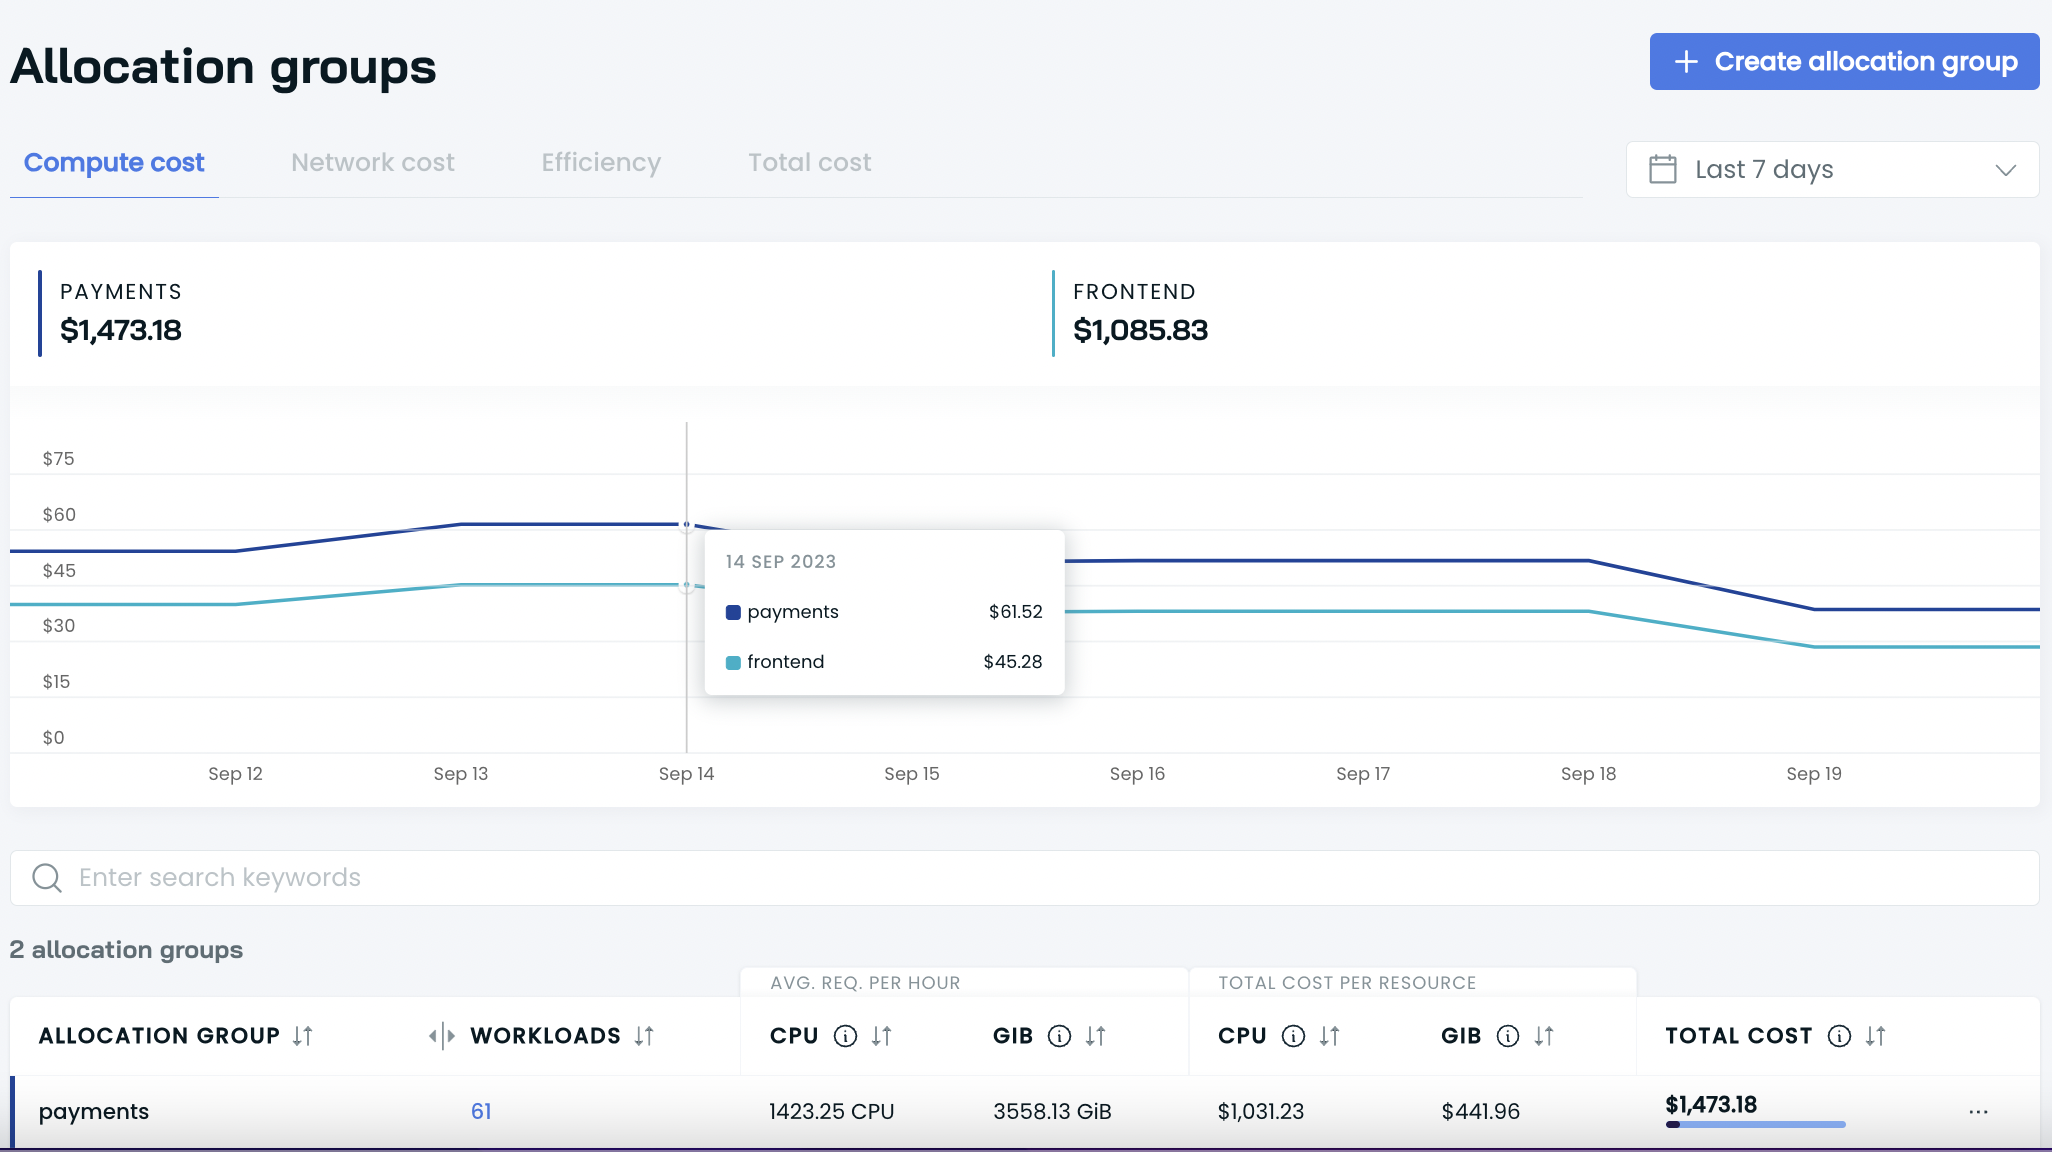
Daily allocation group cost chart
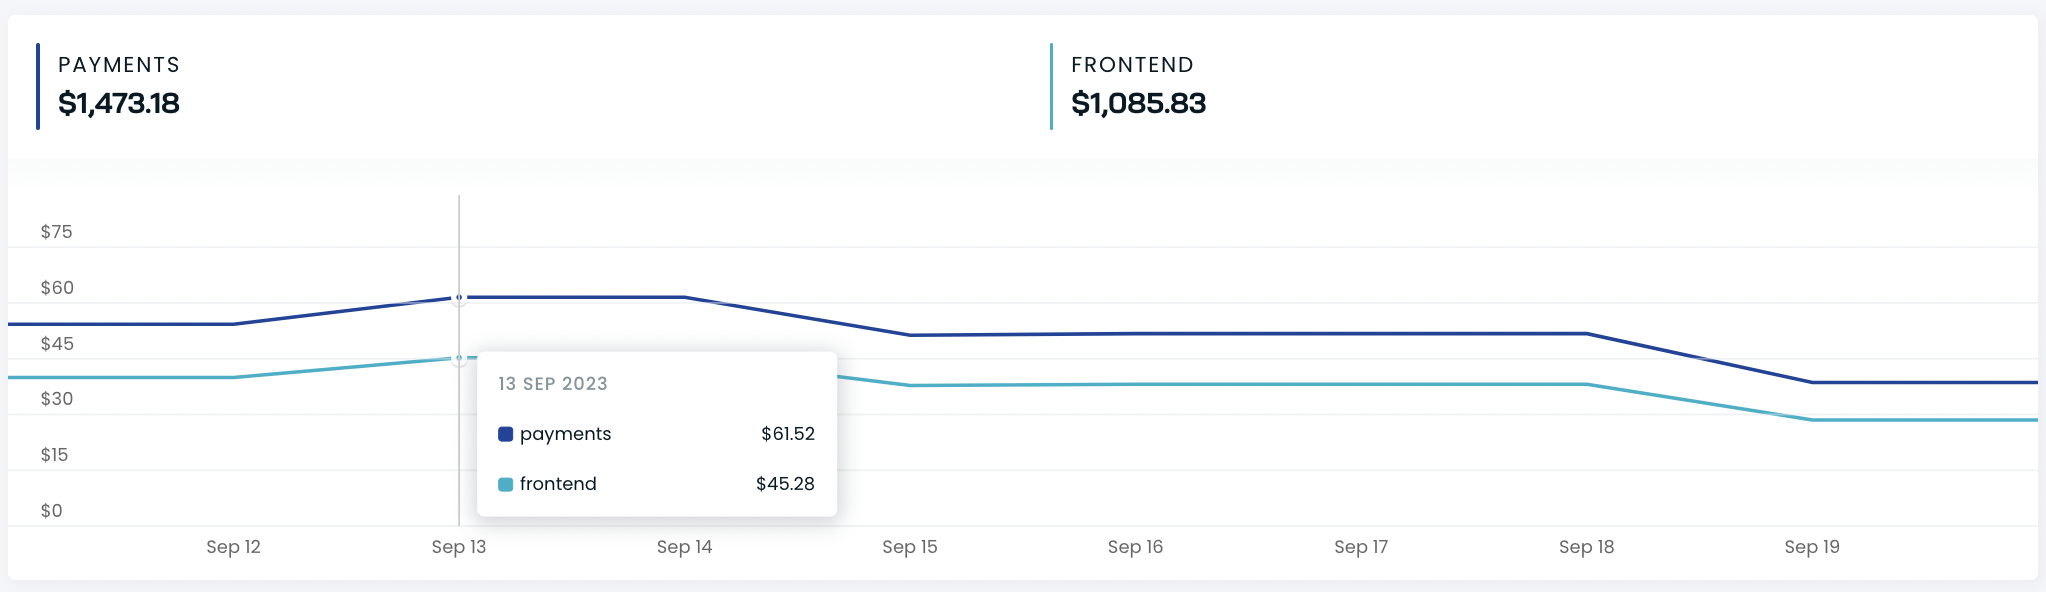
This view lets you see the top 5 most expensive allocation groups and their daily costs in one place. You can check allocation group cost details by hovering over a selected date.
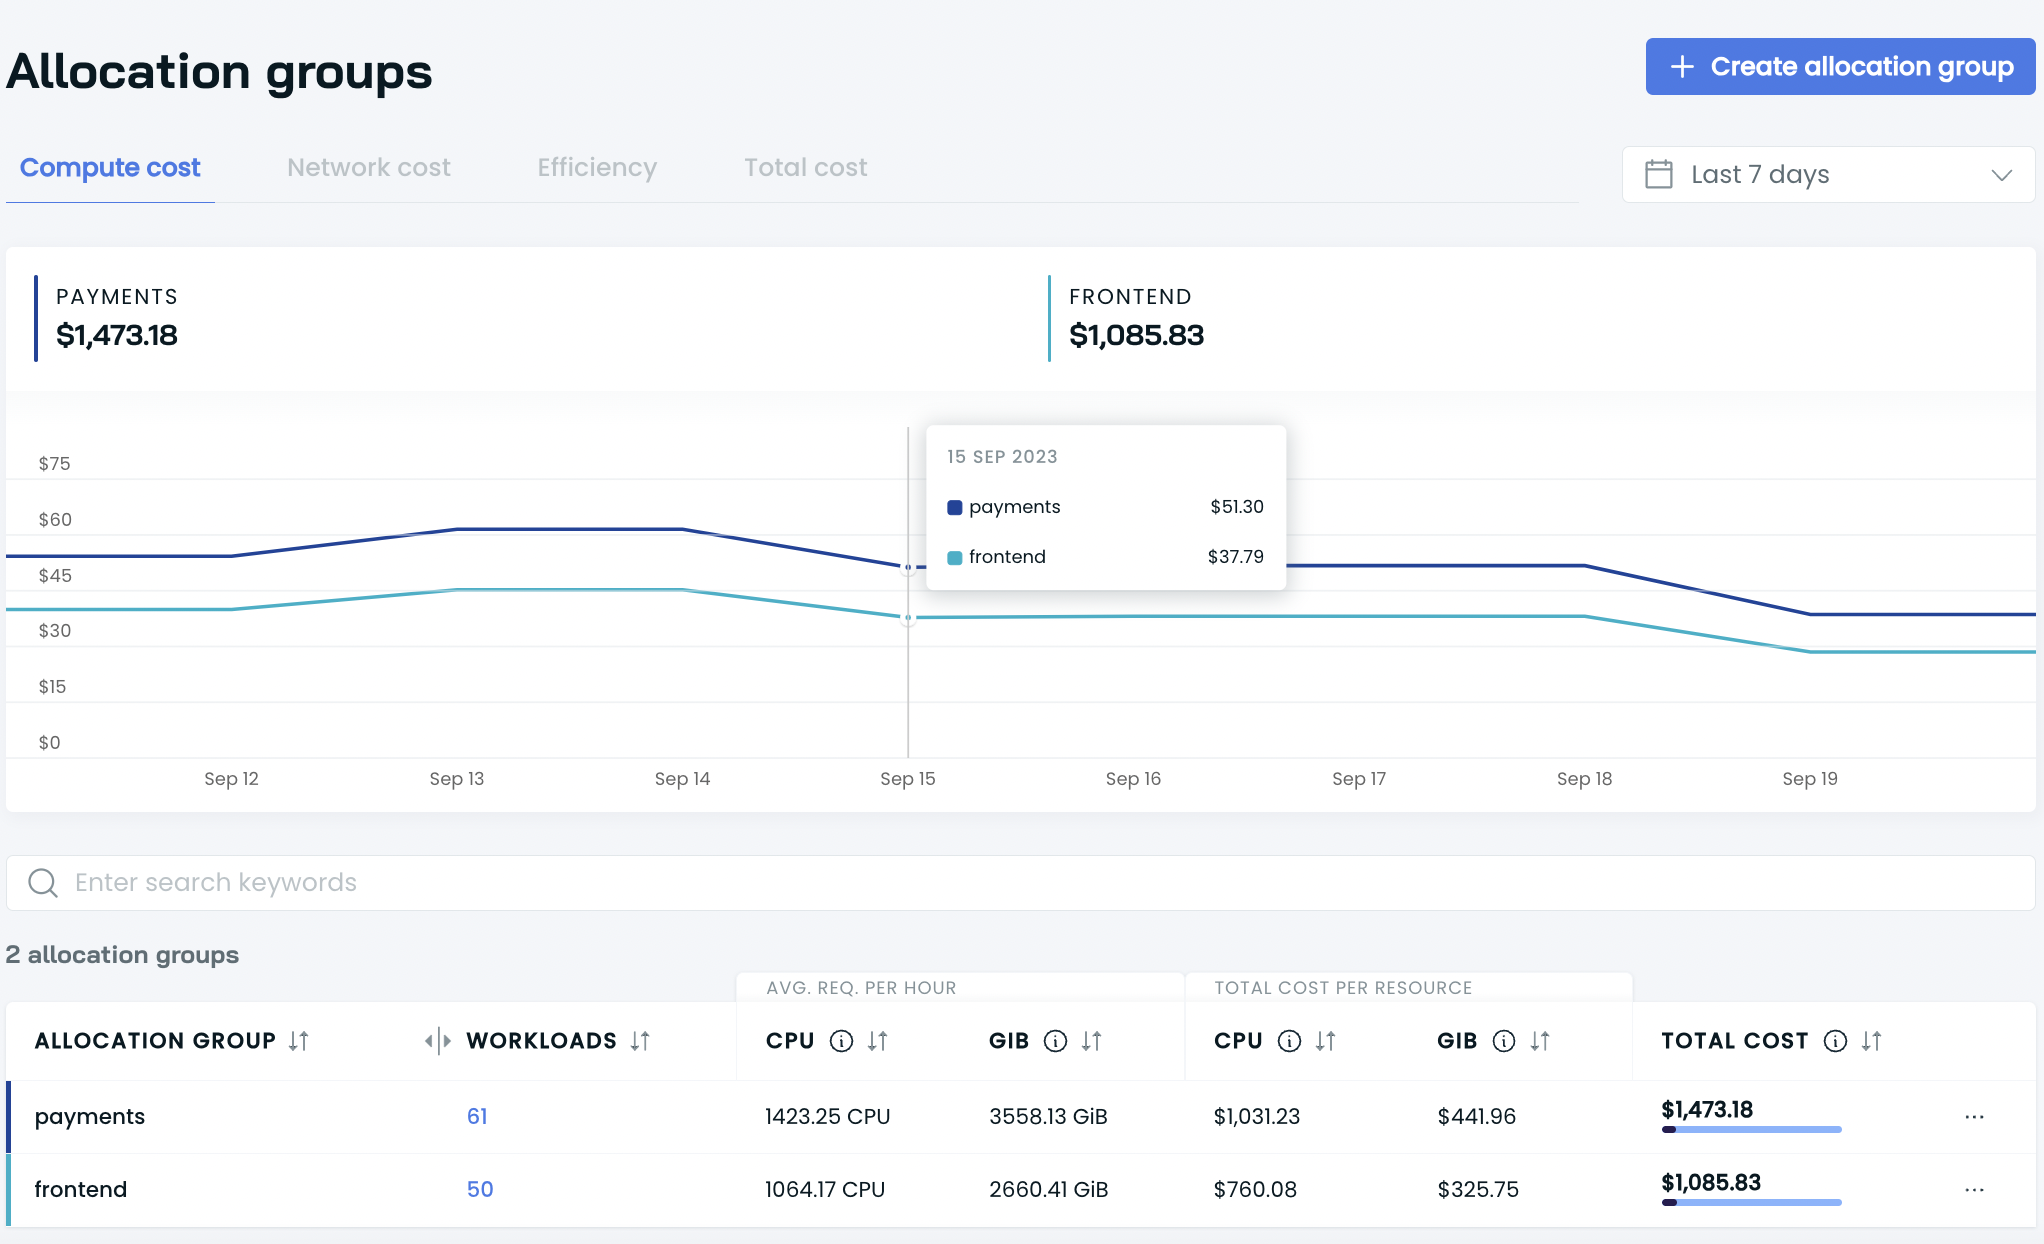
List of allocation groups with cost details per selected period
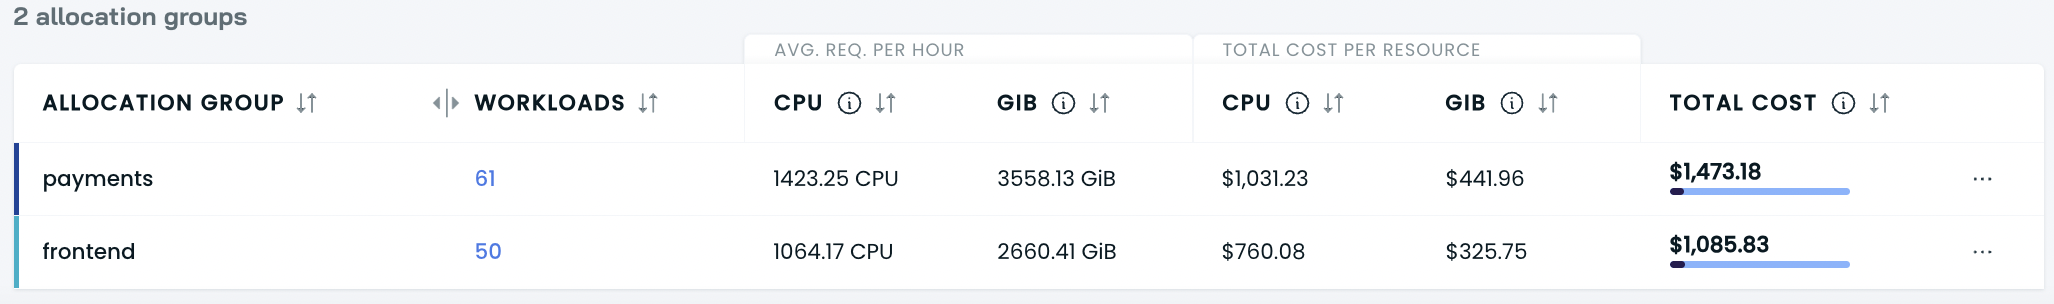
In the detailed view, you can dive into the details of each allocation group. For each of the listed allocation groups, you can check:
- The number of workloads in the allocation group,
- The average requested CPU and GiB per hour,
- Total cost per resource (CPU and GiB)
- The total cost of the allocation group is split by resource offering (On-demand, Fallback, Spot).
By analyzing the data in the report, you can find out which team or application generates the largest costs and plan changes accordingly.
Alternative creation methods
Terraform provider
Use the Cast AI Terraform provider to define allocation groups as infrastructure-as-code. This approach is ideal for managing allocation groups consistently across multiple clusters or environments.
For complete documentation and examples, see the Cast AI Terraform provider documentation.
NoteFull support for managing allocation groups is available in Cast AI Terraform provider v7.60.1 and later.
Updated 2 months ago