

Caching
Caching is DBO's in-line query cache. The Cache manager in the DBO proxy sits between your application and your database, speaks the native database wire protocol, and serves repeated read queries from memory in sub-millisecond time; your application only connects through the proxy, with no code changes. Write traffic passes through to your origin database untouched, and every write triggers Smart Invalidation, which evicts the affected cache entries so your application never reads stale data. A new query typically produces its first cache hit on its second or third occurrence.
Caching is one of the three DBO features, alongside Performance Advisor and Connection Pooling. It shows Enabled in the instance status row and as the nested Cache manager card ("Intercepts traffic between your app and database to serve repeated queries from memory…") on the instance Settings page. You monitor and manage it at two console levels: the instance Caches tab and a database's Caching section.
Instance level: the Caches tab
Open Caches in an instance's navigation for the instance-wide view. Two summary cards and a chart:
- Cache hits: HIT RATE next to PROJECTED HIT RATE (68.4% vs 82.1% on the demo instance), plus TOTAL CACHE HITS and PROJECTED CACHE HITS ("+ 96.87K more", the additional hits the projection expects).
- Database time: CURRENT DB TIME SAVINGS (45.2%), PROJ. SAVINGS (57.9%), and TOTAL DB TIME (20m 40s).
- Cache hits overview: a time-series chart of cache hits over the selected window (for example, Last hour GMT +02:00).
Scope everything with Filter by: Database (Database: All, Clear all).
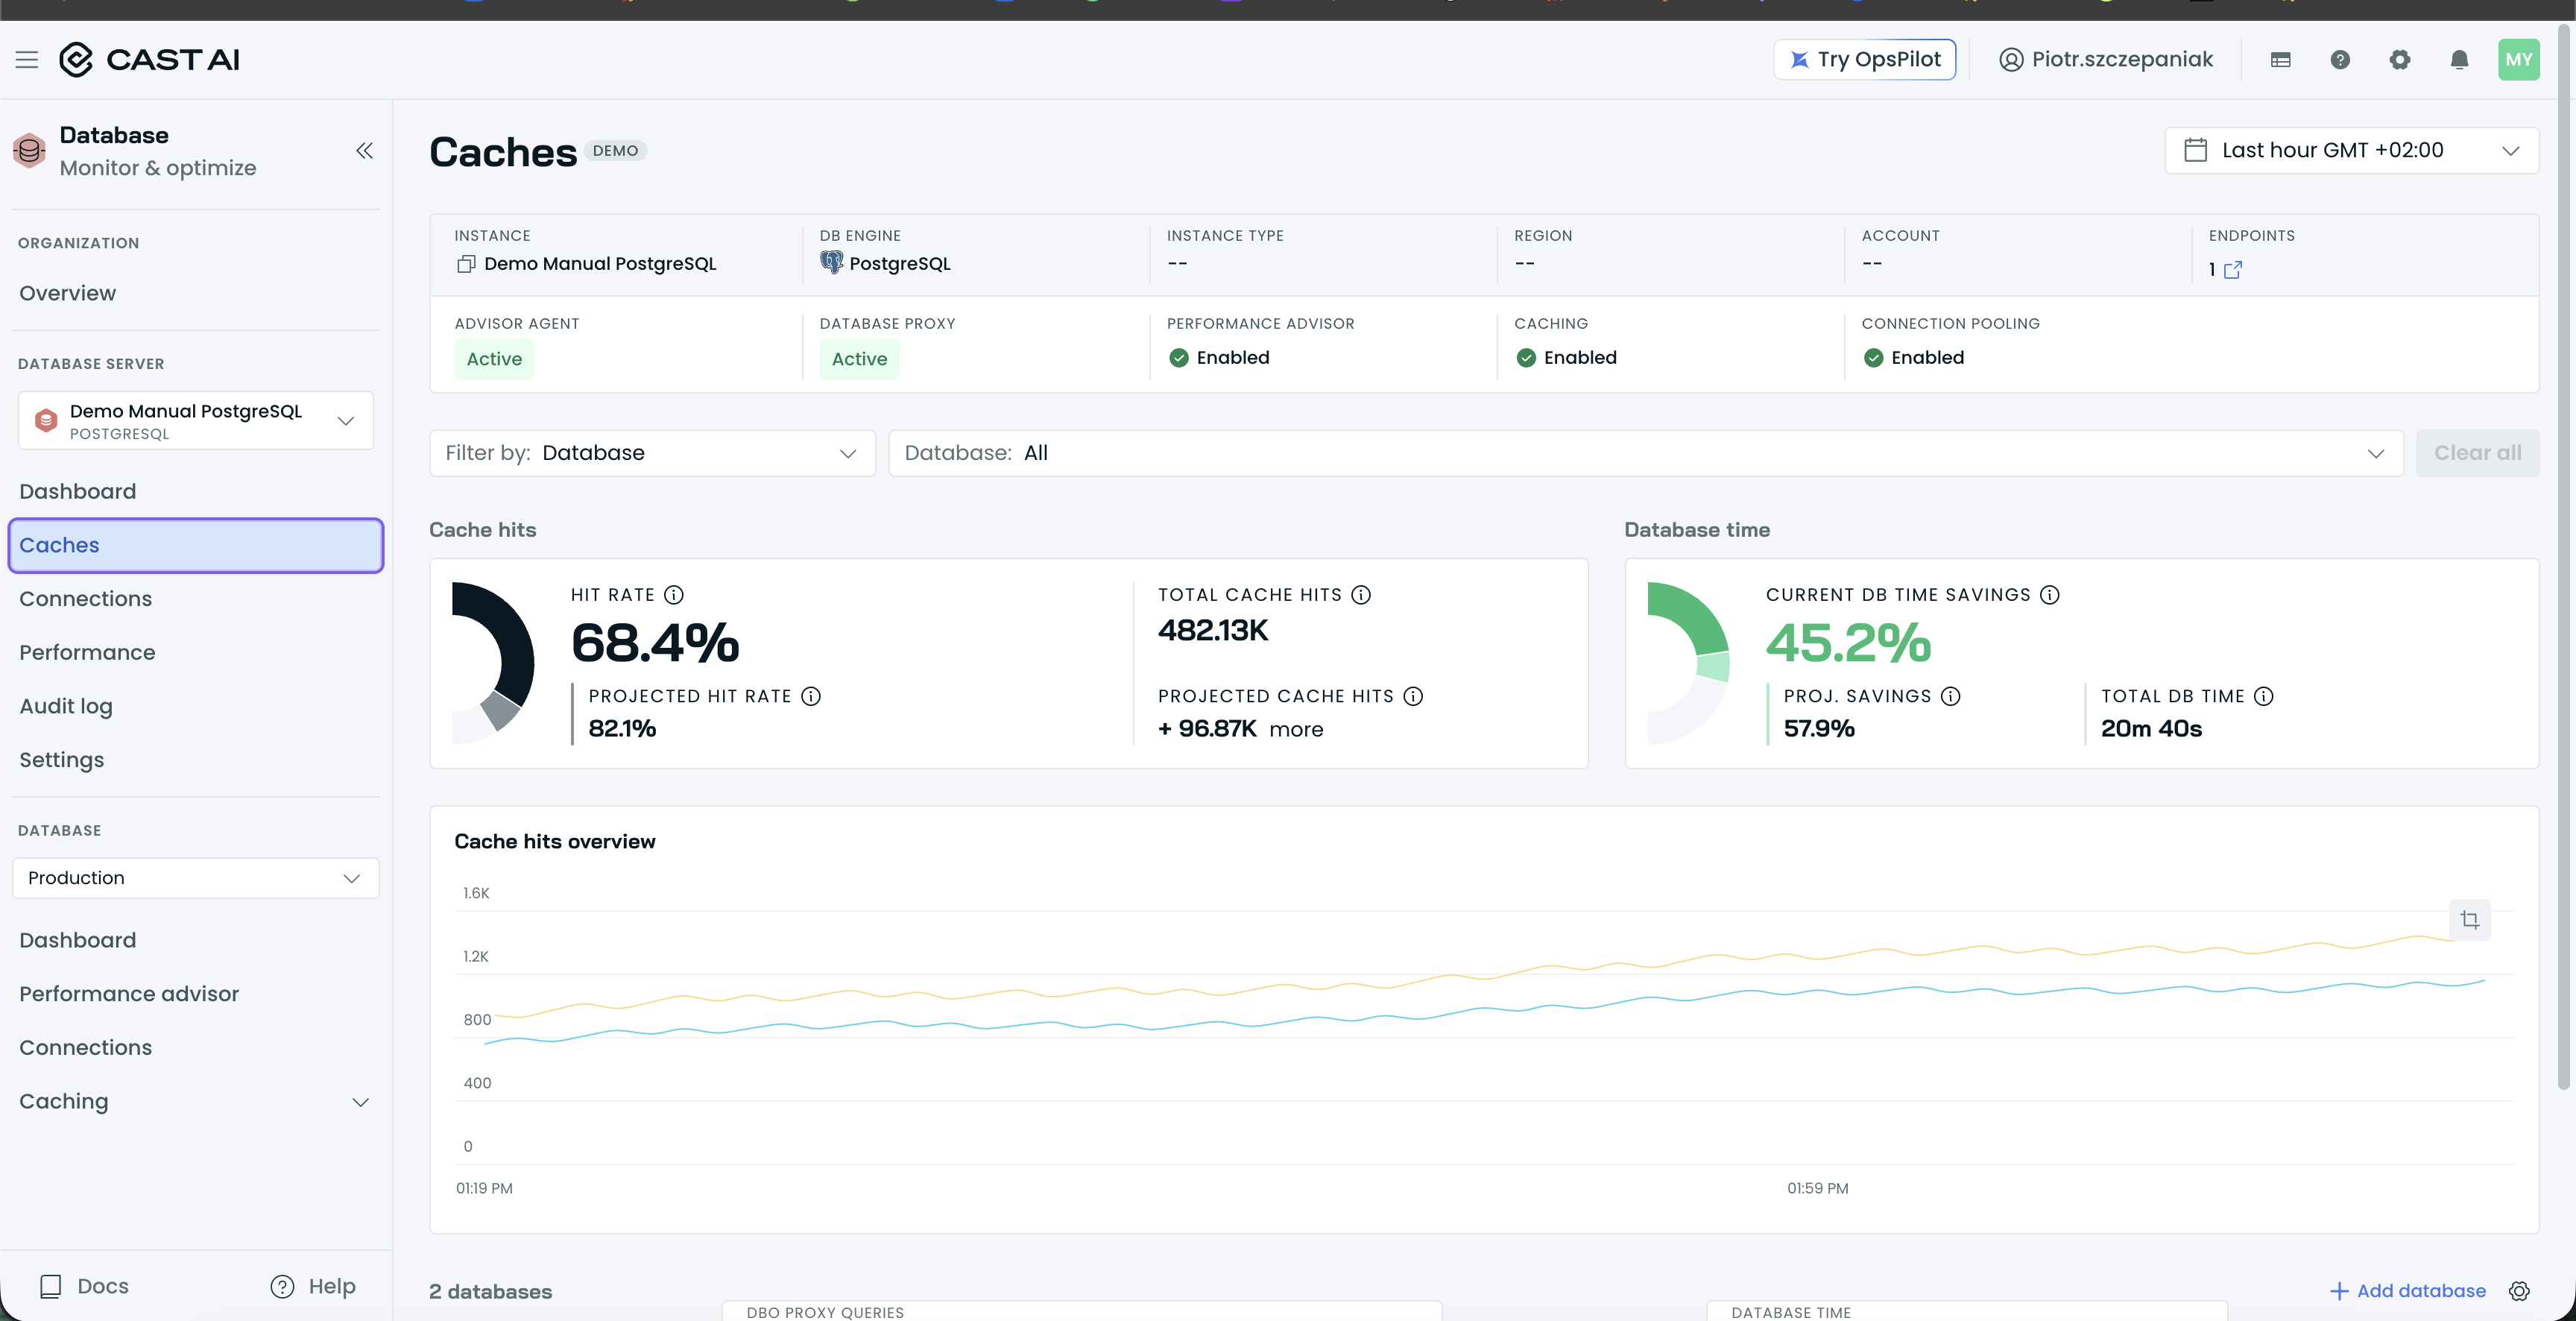
The instance Caches tab, with the Cache hits and Database time cards and the Cache hits overview chart.
Below the chart, the per-database table lists DATABASE, DBO PROXY QUERIES (TOTAL, READS, CACHE HITS), a HIT RATE bar, DATABASE TIME (TOTAL, SAVINGS), and a CACHE control showing each database's caching mode. Click + Add database to put another database's traffic through the proxy's cache.
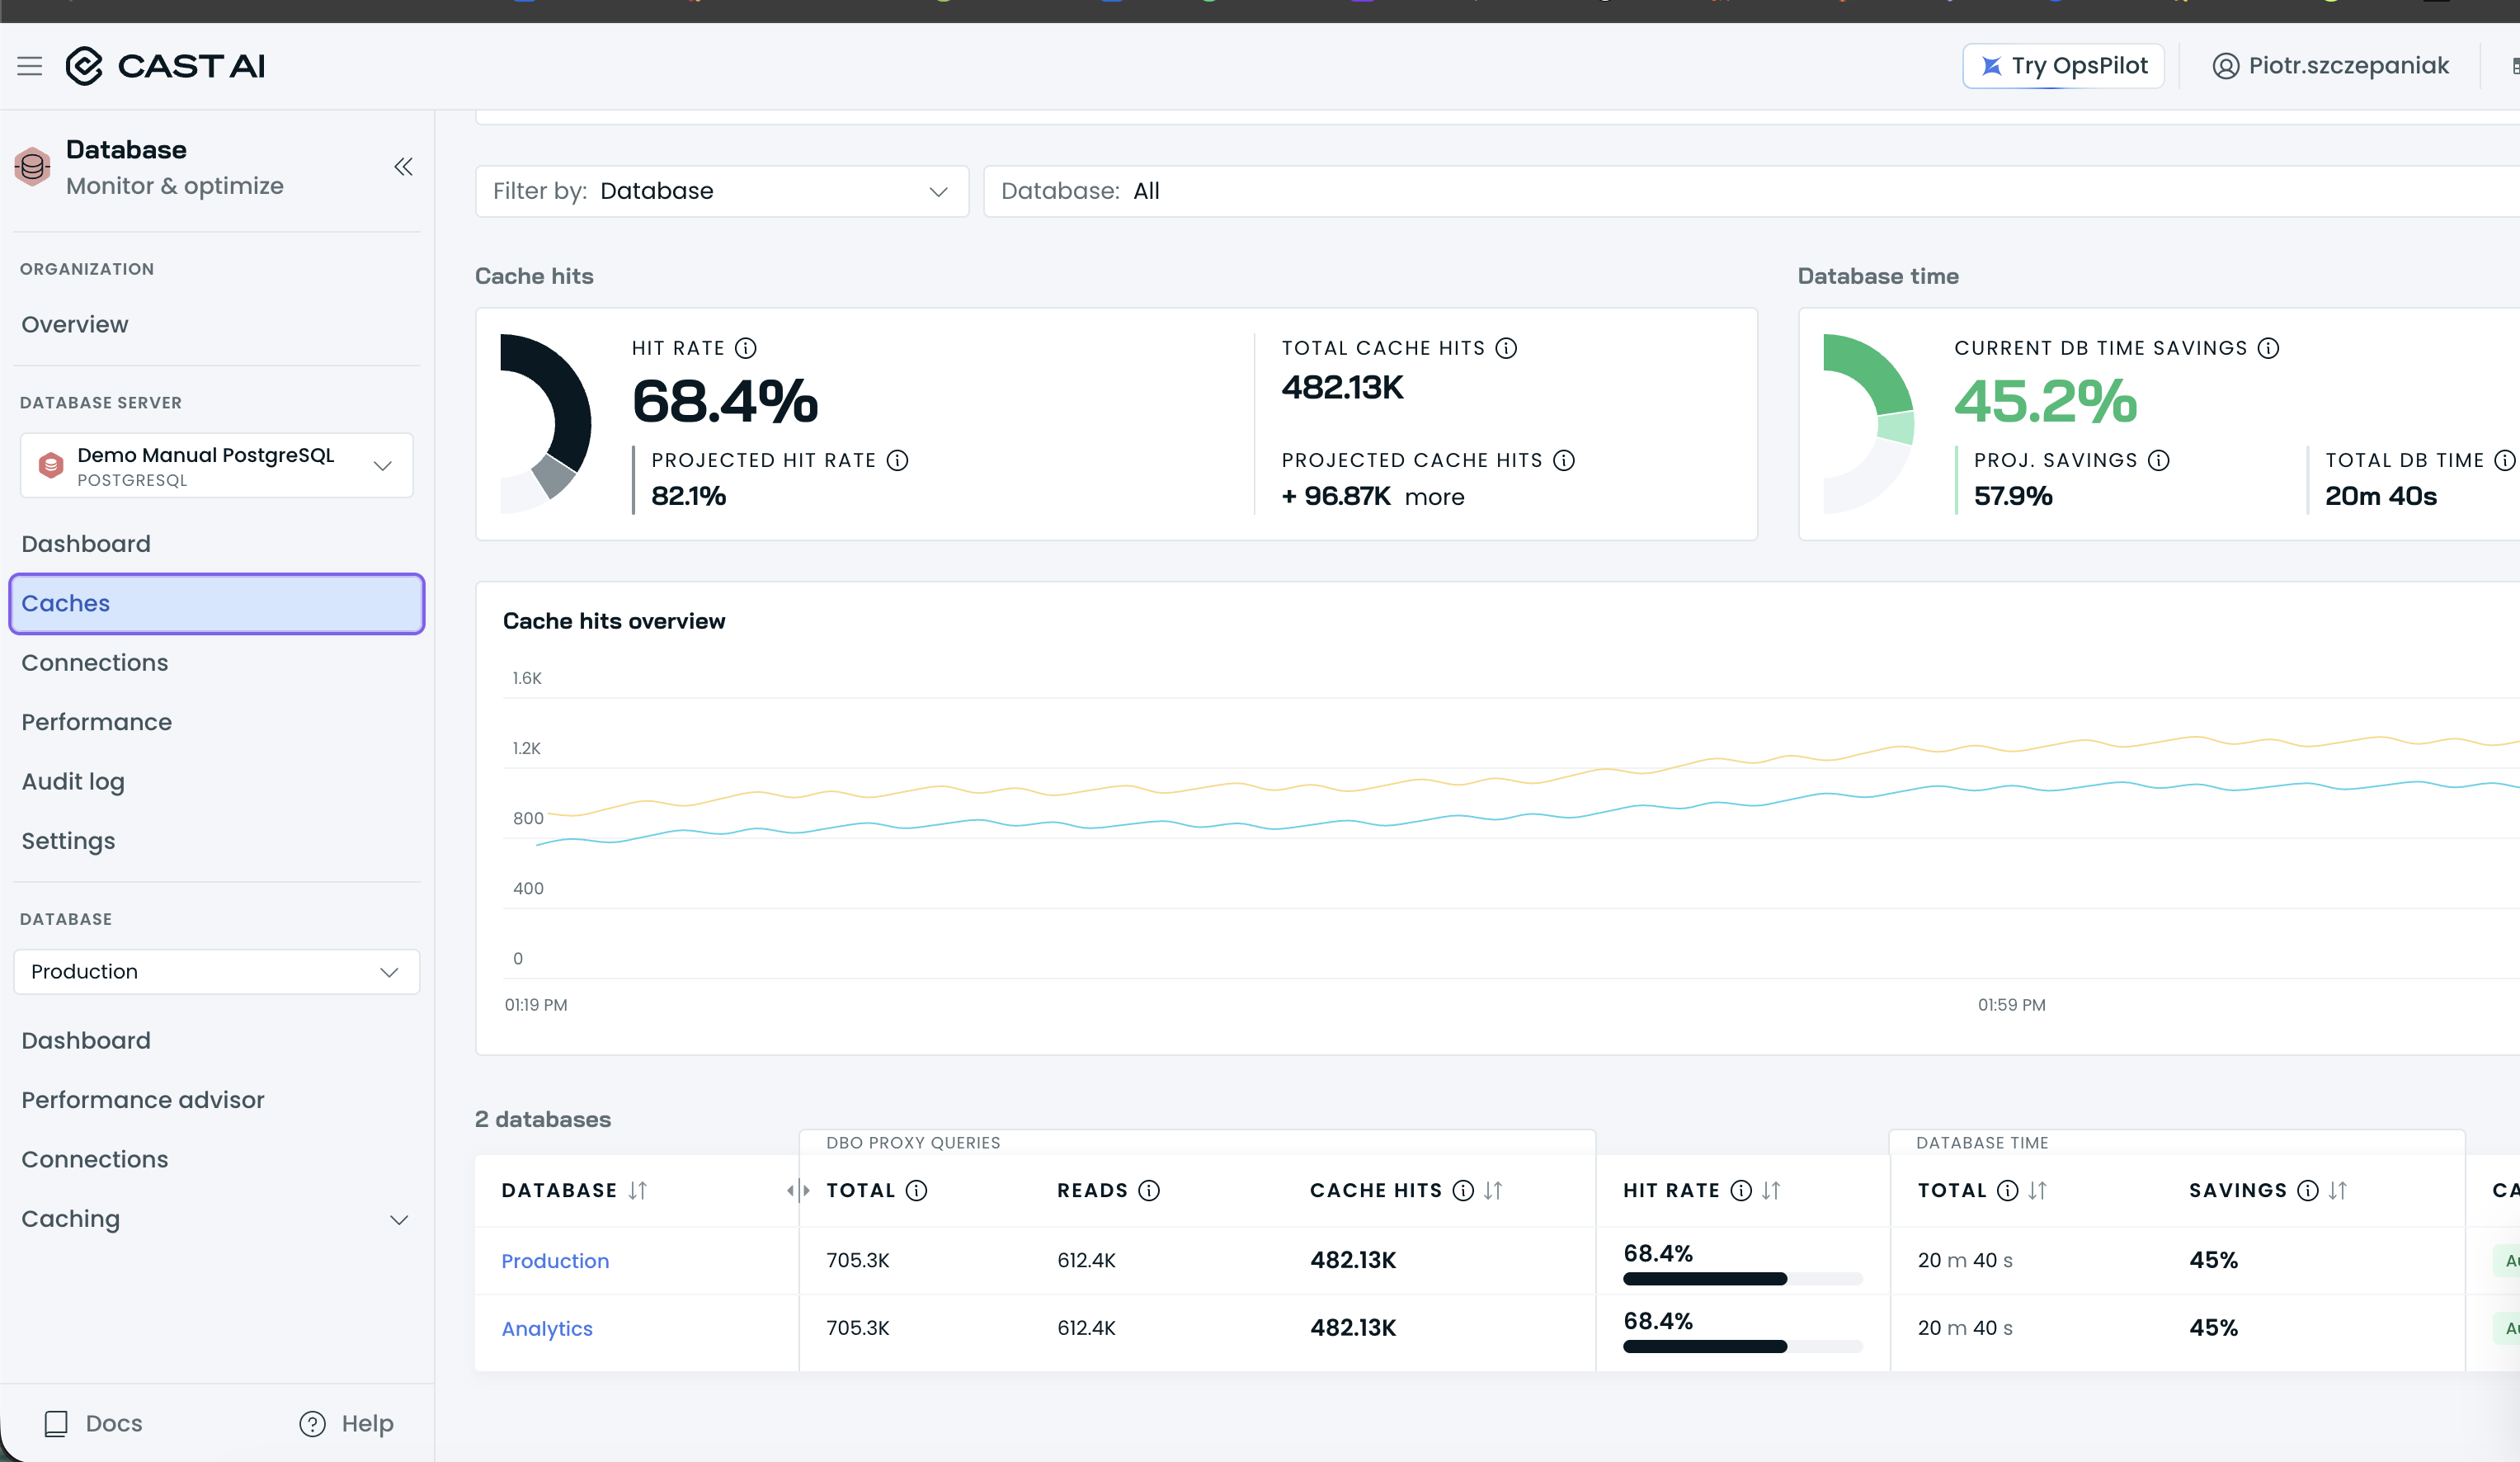
The per-database Caching table, with the DBO PROXY QUERIES, HIT RATE, and DATABASE TIME columns.
Database level: the Caching section
Select a database and expand Caching in its navigation: three sub-pages (Overview, Queries, and Rules) plus a CACHE MODE: Auto badge showing the current mode at a glance.
Overview
The Overview sub-page carries the performance cards:
- Cache hits performance: HIT RATE vs PROJECTED HIT RATE (65.02% vs 77.94% in the demo) and TOTAL CACHE HITS vs PROJECTED CACHE HITS.
- Database time: CURRENT DB TIME SAVINGS vs PROJ. SAVINGS and TOTAL DB TIME.
- Execution time: AVG. EXECUTION TIME (12.4 ms), AVG. MISS TIME (34.7 ms), and AVG. HIT TIME (2.1 ms). The gap between miss and hit time is what caching saves on every read.
- Query performance: headline HIT RATE, TOTAL QUERIES, READS, and CACHE HITS figures above a chart with a checkbox per series.
The Cache configuration → button at the top right opens the database's caching configuration; see Auto vs. Manual mode and override rules.
Queries
The Queries sub-page compares DB queries (what the database sees) with DBO proxy queries (what the proxy serves), then lists every query template with TOTAL, HIT RATE, UNQ.PAR (distinct parameter sets seen for the template), AVG. EXECUTION TIME split into HITS and MISSES, DATABASE TIME with TOTAL and SAVINGS, TTL, and TTL MODE. The TTL and TTL MODE columns show how long each template is cached and who controls that value; see Auto vs. Manual mode and override rules.
Rules
The Rules sub-page holds the per-query and per-table override rules; see Auto vs. Manual mode and override rules.
Reading a single query
Click a query's name in the Queries table to open its Query overview page: the query's SQL template in a code block with a copy icon, the Cache hits performance, Database time, and Execution time cards, and a Query performance chart with Hit Rate, Reads, and Cache Hits series.
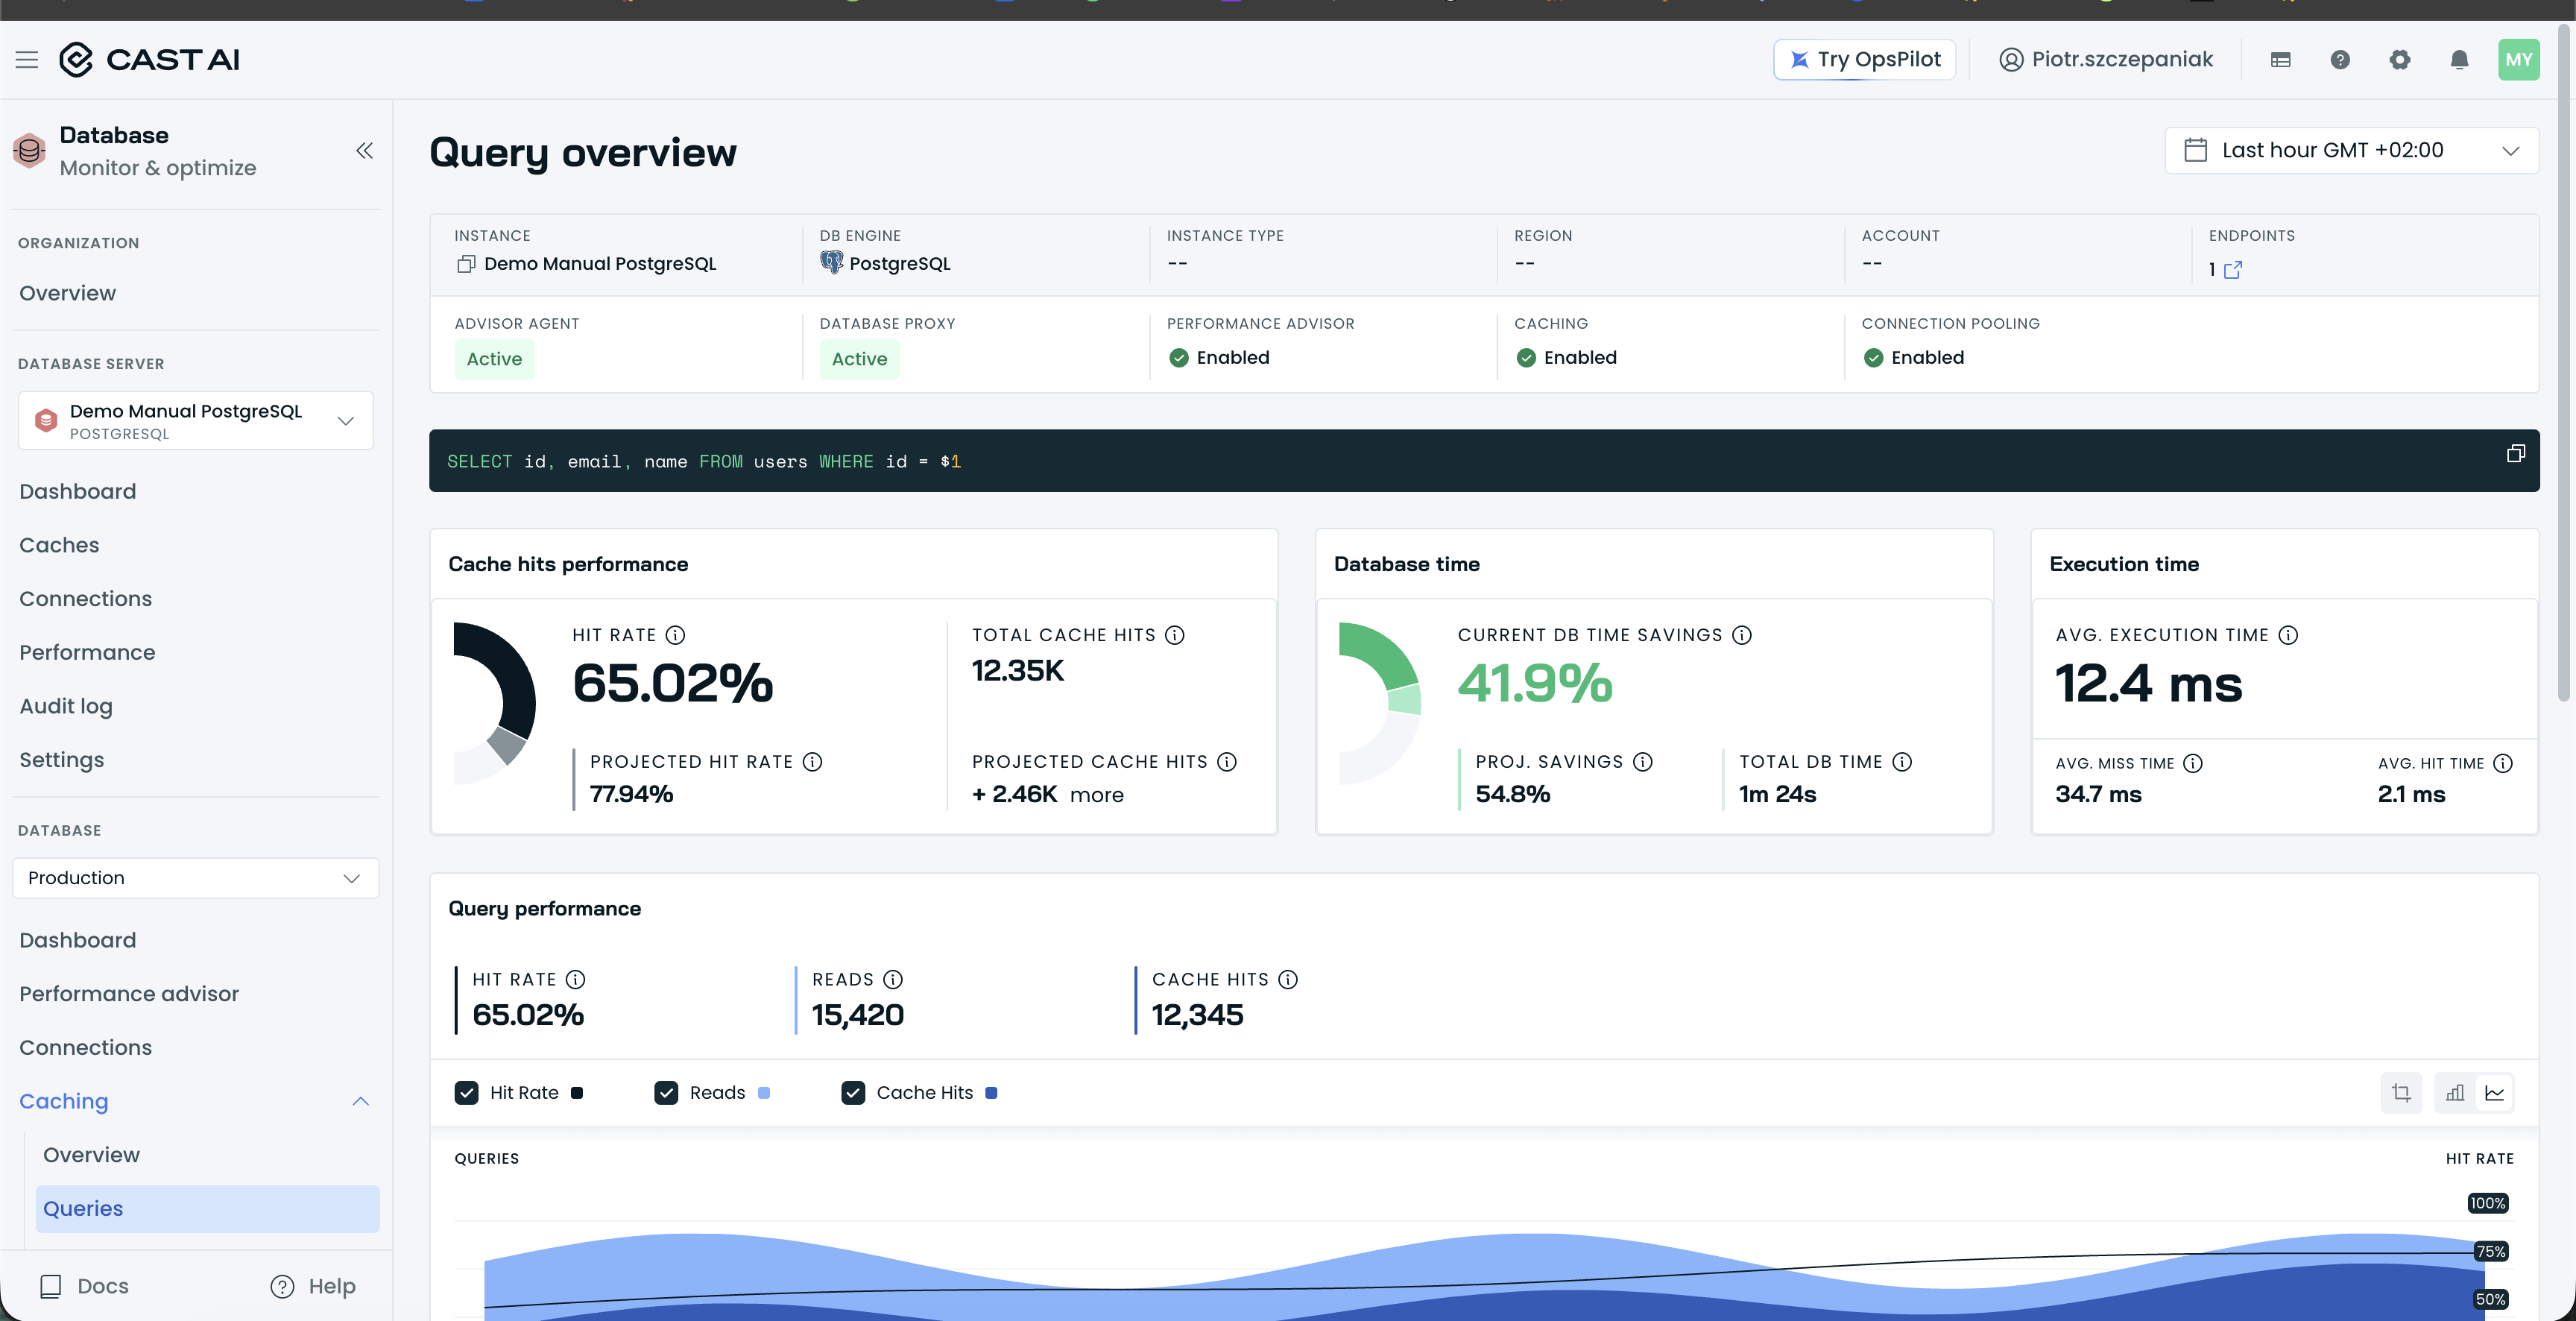
A query's overview page, with the SQL template, the performance cards, and the Query performance chart.
For how the projected numbers are produced and how to turn them into a savings estimate, see Performance estimation and cost savings.
Next steps
Updated 2 hours ago