
JVM workload optimization
Java workloads manage memory through the JVM heap, which is invisible to standard Kubernetes container memory metrics. The JVM preallocates heap memory at startup, and Kubernetes reports this preallocated memory as "used" even when only a fraction is consumed internally. This creates two problems: over-provisioning when relying on container-level metrics, and an inability to detect internal JVM heap OOM errors (java.lang.OutOfMemoryError) that are invisible to Kubernetes.
The Workload Autoscaler addresses this with two complementary capabilities:
- JVM memory optimization — Uses actual JVM runtime data (heap usage, GC behavior, thread count) to generate memory recommendations instead of relying on container-level working set memory.
- Auto-instrumentation — Automatically injects a JMX metrics agent into Java containers at pod admission time, so no application changes are required to collect JVM metrics.
How it works
JVM workload detection
The Workload Autoscaler automatically identifies JVM containers using multiple signals from the cluster snapshot:
- Container image — Images matching known JVM runtimes and frameworks (OpenJDK, Kafka, and others)
- Environment variables — Presence of
JAVA_OPTS,JAVA_TOOL_OPTIONS,JDK_JAVA_OPTIONS,JVM_OPTS,_JAVA_OPTIONS, orCATALINA_OPTS - Pod annotations — OpenTelemetry Java instrumentation (
instrumentation.opentelemetry.io/inject-java) and Datadog Java agent annotations - Custom metrics — JVM heap metrics already flowing into the Workload Autoscaler from an existing Prometheus setup
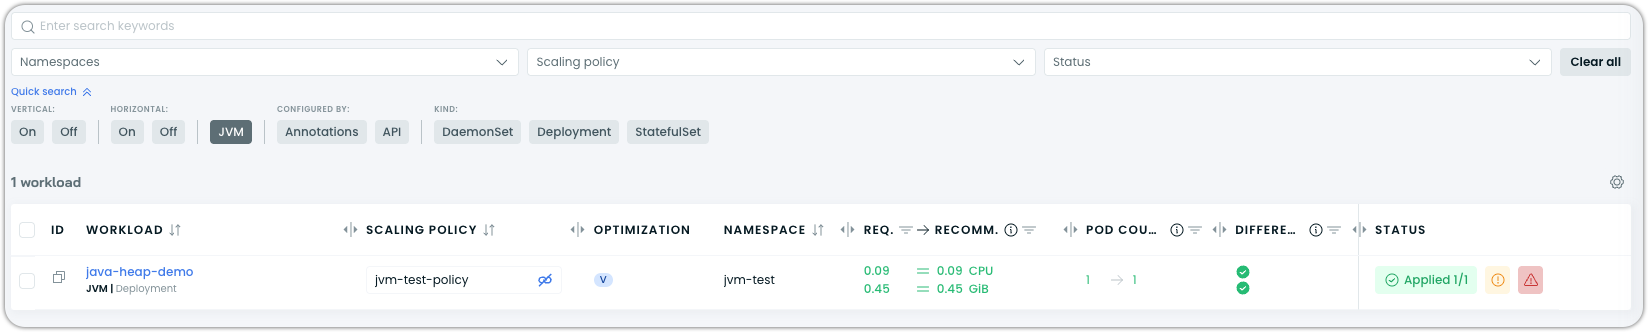
Detection is automatic — no labels or annotations are required on your part. Detected JVM workloads are tagged with a JVM badge in the Cast AI console. To find them, navigate to Workload Autoscaler > Optimization and use the JVM filter chip in the quick search bar.
JVM memory optimization
Standard container-level autoscaling cannot distinguish between heap memory that the JVM has reserved and heap memory that the application is actively using. This leads to two failure modes:
- Container OOM kill — When the total process RSS exceeds the Kubernetes memory limit. Kubernetes emits an
OOMKilledevent, and the Workload Autoscaler handles this automatically by increasing memory. - Internal JVM heap OOM — When the JVM exceeds its own heap limit (
-Xmx,-XX:MaxRAMPercentage). The JVM throwsjava.lang.OutOfMemoryErrorinternally, but Kubernetes sees nothing wrong unless a liveness probe fails. The container may keep running in a degraded state.
When JVM memory optimization is enabled in a scaling policy, the Workload Autoscaler uses actual JVM runtime data — heap usage, non-heap usage, garbage collection behavior, and thread count — to compute memory request recommendations. This lets it detect and prevent internal JVM heap OOM scenarios that are invisible to standard Kubernetes monitoring.
Recommendations include -Xms and -Xmx flags injected into the container's Java options environment variable. The flags are appended to any existing value, preserving your existing JVM configuration. The Workload Autoscaler automatically identifies the right environment variable to use based on what is already present in the container, falling back to JDK_JAVA_OPTIONS if none is detected.
If JVM metrics are not yet available or there is insufficient history, the Workload Autoscaler falls back to the standard memory recommendation flow — the workload continues to receive recommendations, and no disruption occurs.
NoteAfter enabling JVM heap scaling, the Workload Autoscaler needs time to collect enough data points before generating heap-based recommendations. During this warm-up period, the workload detail page may show a message like "JVM recommendation skipped: insufficient JVM metrics." This is normal — the Workload Autoscaler uses standard recommendations in the meantime.
When JVM metrics are available, the workload detail page in the Cast AI console displays additional charts showing heap size and heap recommendation metrics alongside standard memory metrics.
Auto-instrumentation
Auto-instrumentation enables the Workload Autoscaler to collect JVM heap metrics from any Java container without code changes or involvement from the application team. When enabled, the workload-autoscaler webhook injects the following at pod admission time:
- An init container that copies the JMX Prometheus Java agent JAR into a shared
emptyDirvolume - A
-javaagentflag appended to the container's Java options environment variable, pointing the agent at the shared volume - A Prometheus scrape port (port 9404 by default) declared on the container for metrics collection
- A pod label (
workloads.cast.ai/jmx-exporter-injected=true) indicating the agent was successfully injected
Nothing in the application image changes.
Injection behavior:
- New pods and restarts — Injection occurs at admission time. Rolling updates and pod restarts are safe — the webhook skips containers that are already instrumented.
- Running pods — Not affected until they restart. The Workload Autoscaler does not restart pods when auto-instrumentation is toggled. You must restart affected pods manually for the injection to take effect.
- Multiple JVM containers — If a pod contains multiple JVM containers, each gets its own port and Prometheus scrape target.
- Port conflicts — If port 9404 is already in use, the Workload Autoscaler automatically picks the next available port (9405, 9406, and so on).
- Prometheus — If Prometheus is not already present in the cluster, the Workload Autoscaler installs it automatically when auto-instrumentation is enabled.
Prerequisites
Before JVM optimization produces metrics and heap-based recommendations, the following must be in place:
| Component | Minimum version | Description |
|---|---|---|
castai-workload-autoscaler | — | Main component that generates and applies recommendations |
castai-workload-autoscaler-exporter | 0.85.0 | Collects custom metrics from the cluster |
castai-agent | 0.113.0 | Cluster agent that communicates with the Cast AI control plane |
For upgrade instructions, see Workload Autoscaler configuration.
Verify installed component versions
Run the following commands to check that the required components are installed and running:
kubectl get pods -n castai-agent -l app.kubernetes.io/name=castai-workload-autoscalerkubectl get pods -n castai-agent -l app.kubernetes.io/name=castai-workload-autoscaler-exporterkubectl get deploy -n castai-agent castai-agent \
-o jsonpath='{.spec.template.spec.containers[0].image}'All pods should be in Running status.
Additionally:
- Prometheus running in the cluster with JVM metrics being scraped
- Prometheus connected as a custom metrics data source in the Cast AI console
- A scaling policy with JVM heap scaling enabled
- Auto-instrumentation enabled in the same scaling policy (unless you already have your own JMX/Prometheus metrics pipeline feeding data to the Workload Autoscaler)
- Affected pods restarted after enabling auto-instrumentation
WarningEnabling JVM heap scaling in a policy without also enabling auto-instrumentation (or having your own JMX metrics pipeline) will result in missing metrics errors for JVM. Both settings must be active for the feature to work.
Enable JVM optimization
Enable via the Cast AI console
-
Ensure a Prometheus data source is connected. Navigate to Workload Autoscaler > Custom metrics and verify that a data source is connected (or click Add data source to connect one). See Custom metrics for details.
-
Navigate to Workload Autoscaler > Scaling policies
-
Select an existing policy or create a new one
-
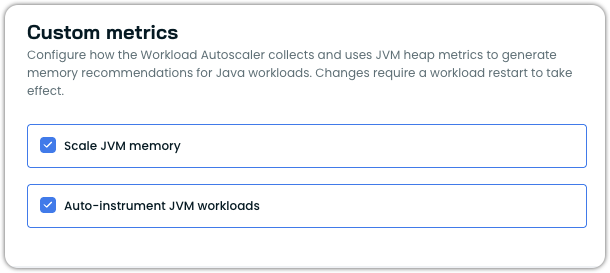
Click Custom metrics in the policy settings sidebar
-
Under JVM heap scaling, enable Scale JVM memory
-
Under Auto-instrumentation, enable Auto-instrument JVM workloads
-
Configure the remaining policy settings and save your policy. See Create a scaling policy for details.
-
Assign JVM workloads to this policy using assignment rules or manual assignment
-
Restart affected pods to trigger injection:
kubectl rollout restart deployment/<name> -n <namespace>Helm configuration
Which upgrade method to useThe Helm commands on this page use the umbrella chart (
castai-helm/castai) by default. If you need to use a different method:
- castctl: To upgrade all Cast AI components at once without managing Helm flags:
This preserves your existing configuration. See the castctl documentation for installation and authentication instructions.castctl castware upgrade- Individual charts: If you installed each component as a separate Helm release (e.g., for ArgoCD or custom GitOps), replace the release name and chart reference with the component-specific ones (e.g.,
castai-workload-autoscalerandcastai-helm/castai-workload-autoscaler) and remove theautoscaler.castai-workload-autoscaler.value prefix.Not sure which method you used? Run
helm list -n castai-agent. A single release namedcastaimeans umbrella chart; separate releases likecastai-workload-autoscalermean individual charts.
Auto-instrumentation is enabled per scaling policy in the Cast AI console. The following Helm value for the castai-workload-autoscaler chart controls cluster-level behavior:
| Parameter | Default | Description |
|---|---|---|
jmxExporter.enabled | true | Master switch for auto-instrumentation. Set to false to disable injection cluster-wide, regardless of scaling policy settings. |
To disable auto-instrumentation at the cluster level:
Configuration-only changesThis command upgrades all components in the umbrella chart, not just Workload Autoscaler. To change configuration without upgrading component versions, pin the chart to your current version by adding
--version <your-current-chart-version>to the command. Runhelm list -n castai-agentto check your current version.
helm upgrade castai castai-helm/castai \
  -n castai-agent \
  --reset-then-reuse-values \
  --set autoscaler.castai-workload-autoscaler.jmxExporter.enabled=false
Enable via annotations
You can enable JVM optimization and auto-instrumentation on individual workloads using the workloads.cast.ai/configuration annotation. This overrides the scaling policy settings for the annotated workload.
workloads.cast.ai/configuration: |
  vertical:
    jvm:
      enabled: true
      autoInstrument: true
To enable JVM optimization for a specific container in a multi-container pod:
workloads.cast.ai/configuration: |
  vertical:
    containers:
      my-container:
        jvm:
          enabled: true
          autoInstrument: true
For the full annotation schema and all available fields, see the annotations reference.
Verify auto-instrumentation
After enabling auto-instrumentation and restarting pods, verify that the injection was successful:
-
Check that the pod has the injection label:
kubectl get pod <pod-name> -n <namespace> -o jsonpath='{.metadata.labels.workloads\.cast\.ai/jmx-exporter-injected}'Expected output:
true -
Confirm that the JMX agent init container was injected:
kubectl get pod <pod-name> -n <namespace> -o jsonpath='{.spec.initContainers[*].name}'The output should include a
jmx-exporter-initcontainer alongside any other init containers in the pod. -
Verify that JVM metrics are being exposed by forwarding the metrics port to your local machine and querying it:
kubectl port-forward pod/<pod-name> 9404:9404 -n <namespace>Then, in a separate terminal:
curl -s http://localhost:9404/metrics | head -20 -
In the Cast AI console, navigate to Workload Autoscaler > Optimization, verify the JVM badge on the workload, and check for heap size and heap recommendation charts on the workload detail page
When not to use auto-instrumentation
Disable auto-instrumentation (jmxExporter.enabled: false) in the following scenarios:
- The application already runs a JMX agent. The Workload Autoscaler does not detect existing JMX agents — it adds a second agent alongside the first, which can cause port conflicts or duplicate metrics. If the application already exposes JMX metrics, feed them to the Workload Autoscaler through your existing Prometheus setup instead.
JDK_JAVA_OPTIONSorJAVA_TOOL_OPTIONSis loaded from a ConfigMap or Secret. The webhook appends the-javaagentflag to the environment variable value. If the value is sourced from a ConfigMap or Secret reference (envFromorvalueFrom), the webhook cannot modify it. Injection may appear to succeed (the pod label is applied), but the agent will not actually load.- A strict security policy blocks init containers. The injection relies on an init container. If your cluster enforces a Pod Security Policy, OPA/Gatekeeper policy, or Kyverno policy that rejects pods with init containers added by the Workload Autoscaler, the pod will not start.
- You already have Prometheus scraping JVM metrics. If your monitoring stack already collects JVM heap metrics and they are flowing to the Workload Autoscaler, auto-instrumentation is unnecessary.
Known limitations
Elasticsearch and OpenSearch are not auto-instrumented. Workload Autoscaler detects Elasticsearch and OpenSearch workloads as JVM containers and applies heap scaling, but does not inject the JMX exporter into them. To scale Elasticsearch or OpenSearch memory with Workload Autoscaler, configure your own Prometheus metrics pipeline and connect it as a custom metrics data source.
Java 9+ required. Auto-instrumentation defaults to the JDK_JAVA_OPTIONS environment variable, which is only available in Java 9 and later. Java 8 workloads may show the injection label (workloads.cast.ai/jmx-exporter-injected=true), but the agent will not load and no metrics will be produced because Java 8 does not recognize JDK_JAVA_OPTIONS.
Java 8 uses JAVA_TOOL_OPTIONS instead. The ability to configure the target environment variable per scaling policy is planned. Until then, Java 8 workloads should use an external JMX metrics pipeline instead of auto-instrumentation.
NoteIf you see the injection label on a pod but no metrics are being produced, check the Java version of the workload. Java 8 workloads require manual JMX configuration rather than auto-instrumentation.
Troubleshooting
"Metric is missing" errors for JVM metrics
Symptom: The Cast AI console shows "metric is missing" for metrics like jvm.gc.pause_count, jvm.gc.pause_seconds, jvm.memory.heap.allocated, jvm.memory.heap.committed, jvm.memory.heap.used, jvm.memory.non_heap.used, or jvm.threads.live_threads.
Cause: JVM heap scaling is enabled in the scaling policy, but one or more prerequisites are not met — auto-instrumentation is not enabled, pods have not been restarted, or the custom metrics data source is not configured.
Solution:
- Verify that both Scale JVM memory and Auto-instrument JVM workloads are enabled in the scaling policy assigned to the workload
- Verify that a custom metrics data source is connected and healthy
- Restart affected pods:
kubectl rollout restart deployment/<name> -n <namespace> - Wait 2-3 minutes for metrics to begin flowing
Injection label present but no metrics
Symptom: The pod has the label workloads.cast.ai/jmx-exporter-injected=true, but port 9404 is not listening and no JVM metrics are produced.
Cause 1: Java 8 or earlier. The default environment variable (JDK_JAVA_OPTIONS) is not recognized by Java 8. The agent JAR is copied to the shared volume, but it never loads.
Solution: Upgrade the workload to Java 9 or later. If upgrading is not possible, set up an external JMX metrics pipeline compatible with Java 8 and feed the metrics to the Workload Autoscaler through a Prometheus data source.
Cause 2: Java options environment variable sourced from a ConfigMap or Secret. The webhook could not append the -javaagent flag because the environment variable value is a reference, not an inline string.
Solution: Move the environment variable value inline into the pod spec, or manually add the -javaagent flag to the ConfigMap or Secret value.
Auto-instrumentation blocked by security policy
Symptom: Pods fail admission with errors referencing the init container injected by the Workload Autoscaler.
Cause: Cluster security policies (Pod Security Policy, OPA/Gatekeeper, Kyverno) reject the init container that the Workload Autoscaler adds during admission.
Solution: Add an exception for the Workload Autoscaler JMX agent init container in your security policy configuration, or disable auto-instrumentation and use an external JMX metrics pipeline instead.
Next steps
Updated 20 days ago