
Custom metrics
Custom metrics allow the Workload Autoscaler to scale applications based on signals that Kubernetes does not natively expose. The primary use case is connecting a Prometheus data source so the Workload Autoscaler can collect JVM heap metrics and generate heap-aware memory recommendations for Java workloads.
NoteOther features that rely on custom metrics infrastructure — such as PSI (Pressure Stall Information) scaling and startup failure detection — work automatically once the Workload Autoscaler Exporter is installed. They use system-defined data sources and do not require you to connect a Prometheus data source. See System-defined data sources for details.
Prerequisites
The following components must be installed in your cluster:
| Component | Minimum version | Description |
|---|---|---|
castai-workload-autoscaler-exporter | 0.85.0 | Collects custom metrics from your cluster and forwards them to the Workload Autoscaler. Installed by default during cluster onboarding. |
castai-agent | 0.113.0 | Cluster agent that communicates with the Cast AI control plane. |
For upgrade instructions, see Workload Autoscaler configuration.
Verify installed component versions
Run the following commands to check that the required components are installed and meet the minimum version requirements:
kubectl get pods -n castai-agent -l app.kubernetes.io/name=castai-workload-autoscaler-exporterkubectl get pods -n castai-agent -l app.kubernetes.io/name=castai-workload-autoscalerkubectl get deploy -n castai-agent castai-agent \
-o jsonpath='{.spec.template.spec.containers[0].image}'All pods should be in Running status.
Install the exporter manually
If the exporter was not installed during cluster onboarding, you can install it manually. First, check whether the exporter is already running:
kubectl get deployment castai-workload-autoscaler-exporter -n castai-agentIf the deployment exists and is running, no action is needed. If it is not found, install it using one of the methods below.
helm repo add castai-helm https://castai.github.io/helm-charts
helm repo update
helm install castai-workload-autoscaler-exporter castai-helm/castai-workload-autoscaler-exporter -n castai-agent
Set install_workload_autoscaler_exporter = true in your Cast AI Terraform module configuration.
Configure a data source
A Prometheus data source connects the Workload Autoscaler to a Prometheus server running in your cluster, enabling it to collect application and runtime metrics for scaling decisions.
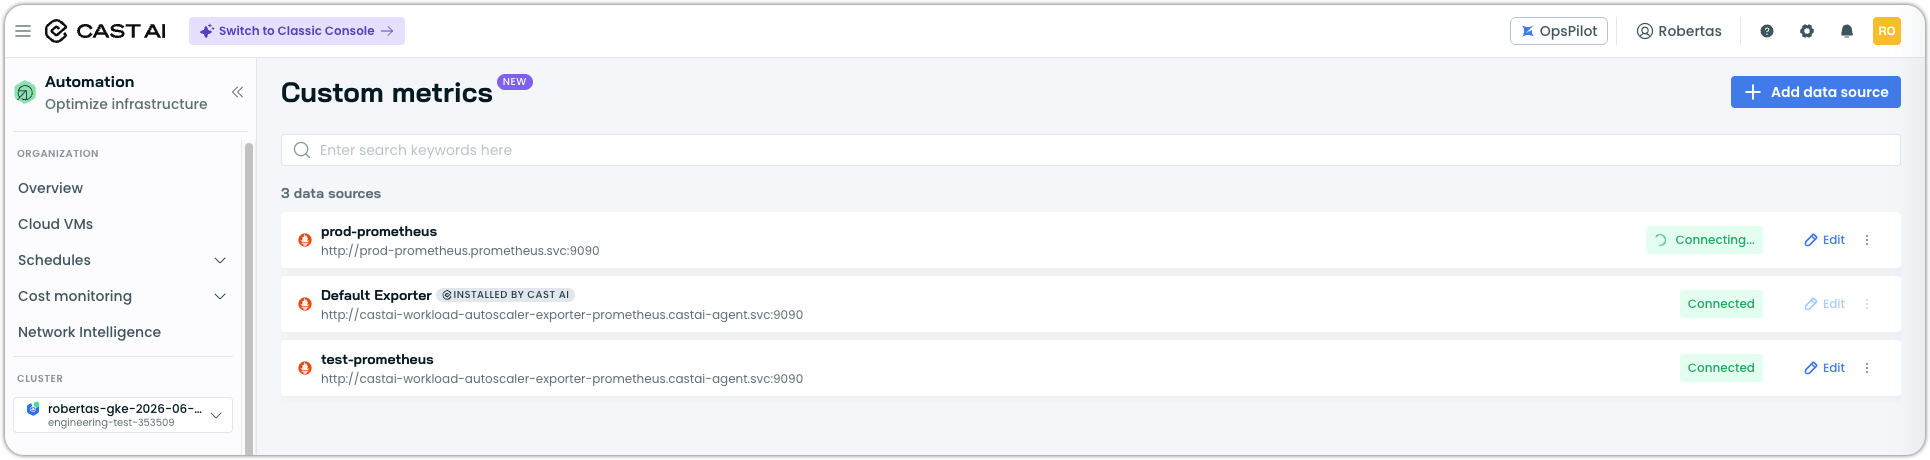
Default Exporter
When the exporter is installed, the Workload Autoscaler automatically creates a Default Exporter data source. This data source points to the exporter's own Prometheus instance (http://castai-workload-autoscaler-exporter-prometheus.castai-agent.svc:9090) and provides the system-defined metrics that power PSI scaling and startup failure detection.
For JVM heap scaling, you need to connect a Prometheus data source that scrapes JVM metrics from your Java workloads. If your existing Prometheus server already scrapes JVM metrics, connect it as an additional data source. If you do not have Prometheus scraping JVM metrics, enable auto-instrumentation in your scaling policy — the Workload Autoscaler will inject a JMX agent and route metrics through the Default Exporter automatically.
JVM optimization can also be enabled on individual workloads using annotations:
workloads.cast.ai/configuration: |
  vertical:
    jvm:
      enabled: true
      autoInstrument: true
See JVM workload optimization for details, or the annotations reference for the full schema.
Connect a Prometheus data source
-
Navigate to Workload Autoscaler > Custom metrics
-
Click Add data source
-
Enter a Data source name (for example,
prometheus-prod-eu) -
Enter the Prometheus server URL — the in-cluster service URL of your Prometheus server (for example,
http://prometheus.production.svc.cluster.local:9090)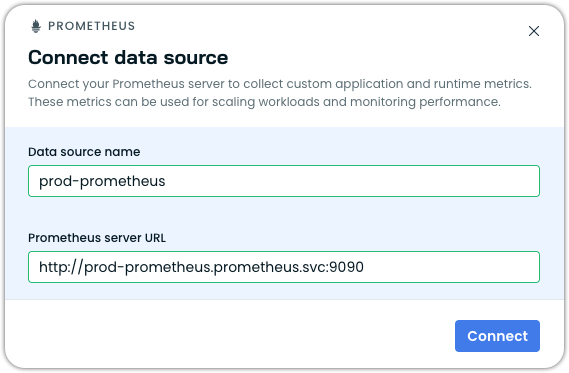
-
Click Connect
-
Wait a few minutes for the data source to appear in the cluster
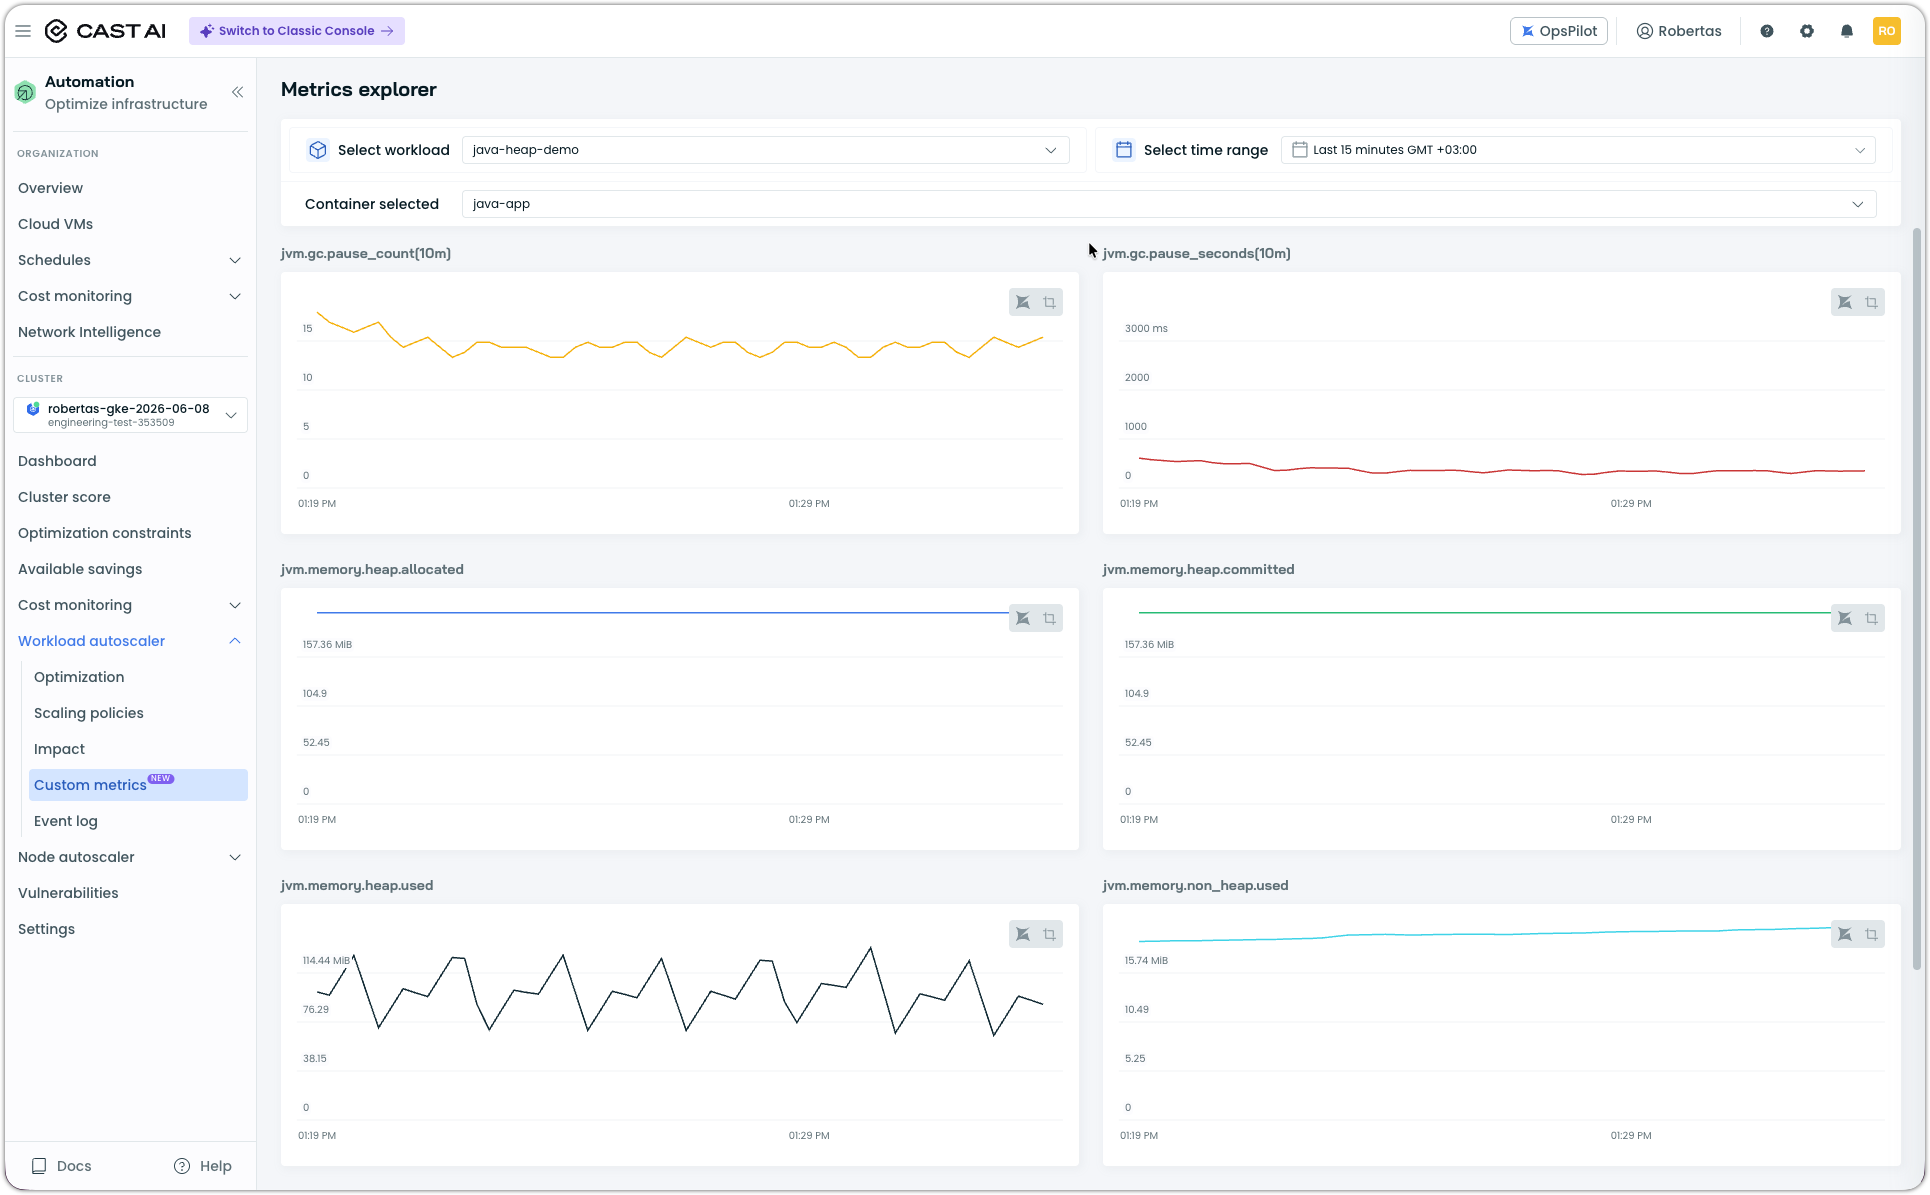
Metrics explorer
The Custom metrics page includes a Metrics explorer where you can select a JVM workload and time range to inspect the JVM metrics being collected from your data sources. Use this to verify that JVM metrics (heap usage, GC behavior, thread count) are flowing correctly after connecting a data source or enabling auto-instrumentation.
Verify data source status
After connecting a data source, verify that it is healthy. The Custom metrics page shows the connection status for each data source. You can also check the custom resource status in the cluster:
kubectl get custommetricsexporterconfigsExpected output when data sources are healthy:
NAME                      HEALTHY   READY   AGE
castai-data-source-name   True      1/1     21d
exporter-config           True      3/3     8m51s
NoteIt may take a few minutes for the custom resource to be created in the cluster after connecting a data source. If it does not appear immediately, wait and check again.
System-defined data sources
The Workload Autoscaler provides built-in data sources that are installed alongside castai-workload-autoscaler-exporter by default. These data sources require no manual configuration and work automatically once the exporter is installed:
- node-probes — Provides startup-related metrics used by startup failure detection. No additional setup needed.
- node-psi — Provides Pressure Stall Information metrics used by stall detection. Requires Kubernetes 1.34+. No additional setup needed.
Troubleshooting
Data source not appearing
If the custom resource does not appear after connecting a data source:
- Verify that
castai-workload-autoscaler-exporteris running:kubectl get pods -n castai-agent -l app.kubernetes.io/name=castai-workload-autoscaler-exporter - Check exporter logs for errors:
kubectl logs -n castai-agent -l app.kubernetes.io/name=castai-workload-autoscaler-exporter --tail=50 - Wait 2-3 minutes and check again — resource creation is asynchronous
Data source shows unhealthy
If a data source reports an unhealthy status, inspect the custom resource for details:
kubectl describe custommetricsexporterconfigs <config-name>The status includes a reason for the unhealthy state. For example, a cluster version incompatibility:
Status:
  Datasource Statuses:
    Type:     NodeWorkload
    Message:  Datasource disabled: node workload data source
              not supported on cluster version 1.33.6+k3s1
    Name:     node-psi
    State:    DatasourceDisabled
Address the underlying issue indicated in the status message, or contact Cast AI support if the error is unclear.
Next steps
Optimize Java workloads with heap-based scaling and auto-instrumentation.
Create and manage scaling policies that control how the Workload Autoscaler optimizes your workloads.
Full annotation schema for per-workload JVM settings and all other configuration overrides.
Updated 23 days ago