
OpsPilot
An AI-powered assistant that answers operational questions about your Kubernetes clusters, costs, and database optimization in plain English.
Limited Availability FeatureThis feature is currently available through feature flags. Contact us to enable access for your organization.
Cast AI OpsPilot is an AI-powered assistant embedded in the Cast AI console. Ask operational questions about your Kubernetes clusters in plain English and get structured, actionable answers — without writing kubectl commands, navigating multiple dashboards, or running SQL queries.
Questions that previously required switching between dashboards and tools can be handled in a single interaction. OpsPilot understands your live cluster state, cost and savings data, workload events, audit logs, cluster health scores, and Cast AI documentation. It combines information from multiple data sources into a single response.
Access OpsPilot
OpsPilot is available to all Cast AI customers directly in the console — no separate configuration, installation, or onboarding required.
- Log in to the Cast AI console.
- Locate the OpsPilot chat interface in the console header. It is accessible from any page.
- Type your question in the input field and press Enter.
OpsPilot authenticates you automatically using your existing Cast AI session.
How OpsPilot works
When you ask a question, OpsPilot analyzes your intent and routes the query to the right data sources. It can query multiple sources in parallel and combine the results into a single, coherent response.
OpsPilot covers four main data domains:
- Live cluster state — pods, nodes, services, deployments, statefulsets, daemonsets, HPAs, namespaces, workload events, and audit logs. OpsPilot queries your real-time cluster data and applies filtering, counting, and analysis. When kubectl logs access is enabled, OpsPilot can also retrieve live container logs.
- Cost and savings analytics — cluster costs, namespace-level cost breakdowns, workload-level costs, savings data, and optimization recommendations. Cost data updates at 5-minute intervals and can include trend charts.
- Database optimization (DBO) — DBO deployment health, cache hit rates, query-level performance, connection pooling status, and optimization activity. Available when DBO is enabled on your cluster.
- Cast AI documentation — how-to guides, feature explanations, and configuration references from the Cast AI docs. OpsPilot retrieves the most relevant content and synthesizes a targeted answer with source citations.
For multi-topic questions like "show me expensive pods with their resource requests," OpsPilot queries both the cost analytics and cluster state data simultaneously, then merges the results into a combined response.
What you can ask
The table below summarizes what OpsPilot can answer and the kind of question each capability handles.
| Capability | What you can ask about | Example |
|---|---|---|
| Cluster state | Pods, nodes, deployments, statefulsets, daemonsets, services, HPAs, and namespaces. Filter by namespace, status, label, or restart count. | "Show me all pods in CrashLoopBackOff in the payments namespace." |
| Container logs | Live container logs fetched directly from your cluster. Requires kubectl logs access to be enabled — see Enable kubectl logs. | "Show me the last 50 log lines from the api-gateway container." |
| Workload events & audit logs | OOM kills, traffic surges, memory pressure, rightsizing activity, and policy changes. Time ranges work in natural language. | "Which containers were OOM killed in the last 12 hours?" |
| Cost and savings | Cluster, namespace, or workload-level costs; trend data over custom periods; savings opportunities. Cost data updates every 5 minutes. | "Cost breakdown by namespace for the last 30 days, ordered by spend." |
| Health score & optimization | Score breakdown across version management, instance diversity, spot usage, resource requests, autoscaling, security, and cost efficiency. | "Why is my health score low and what should I fix first?" |
| Database optimization (DBO) | DBO deployment status, cache hit rates, slow or low-hit-rate queries, connection pool usage, and optimization activity. Requires DBO to be enabled on your cluster. | "What's my overall cache hit rate?" or "Is DBO working on my cluster?" |
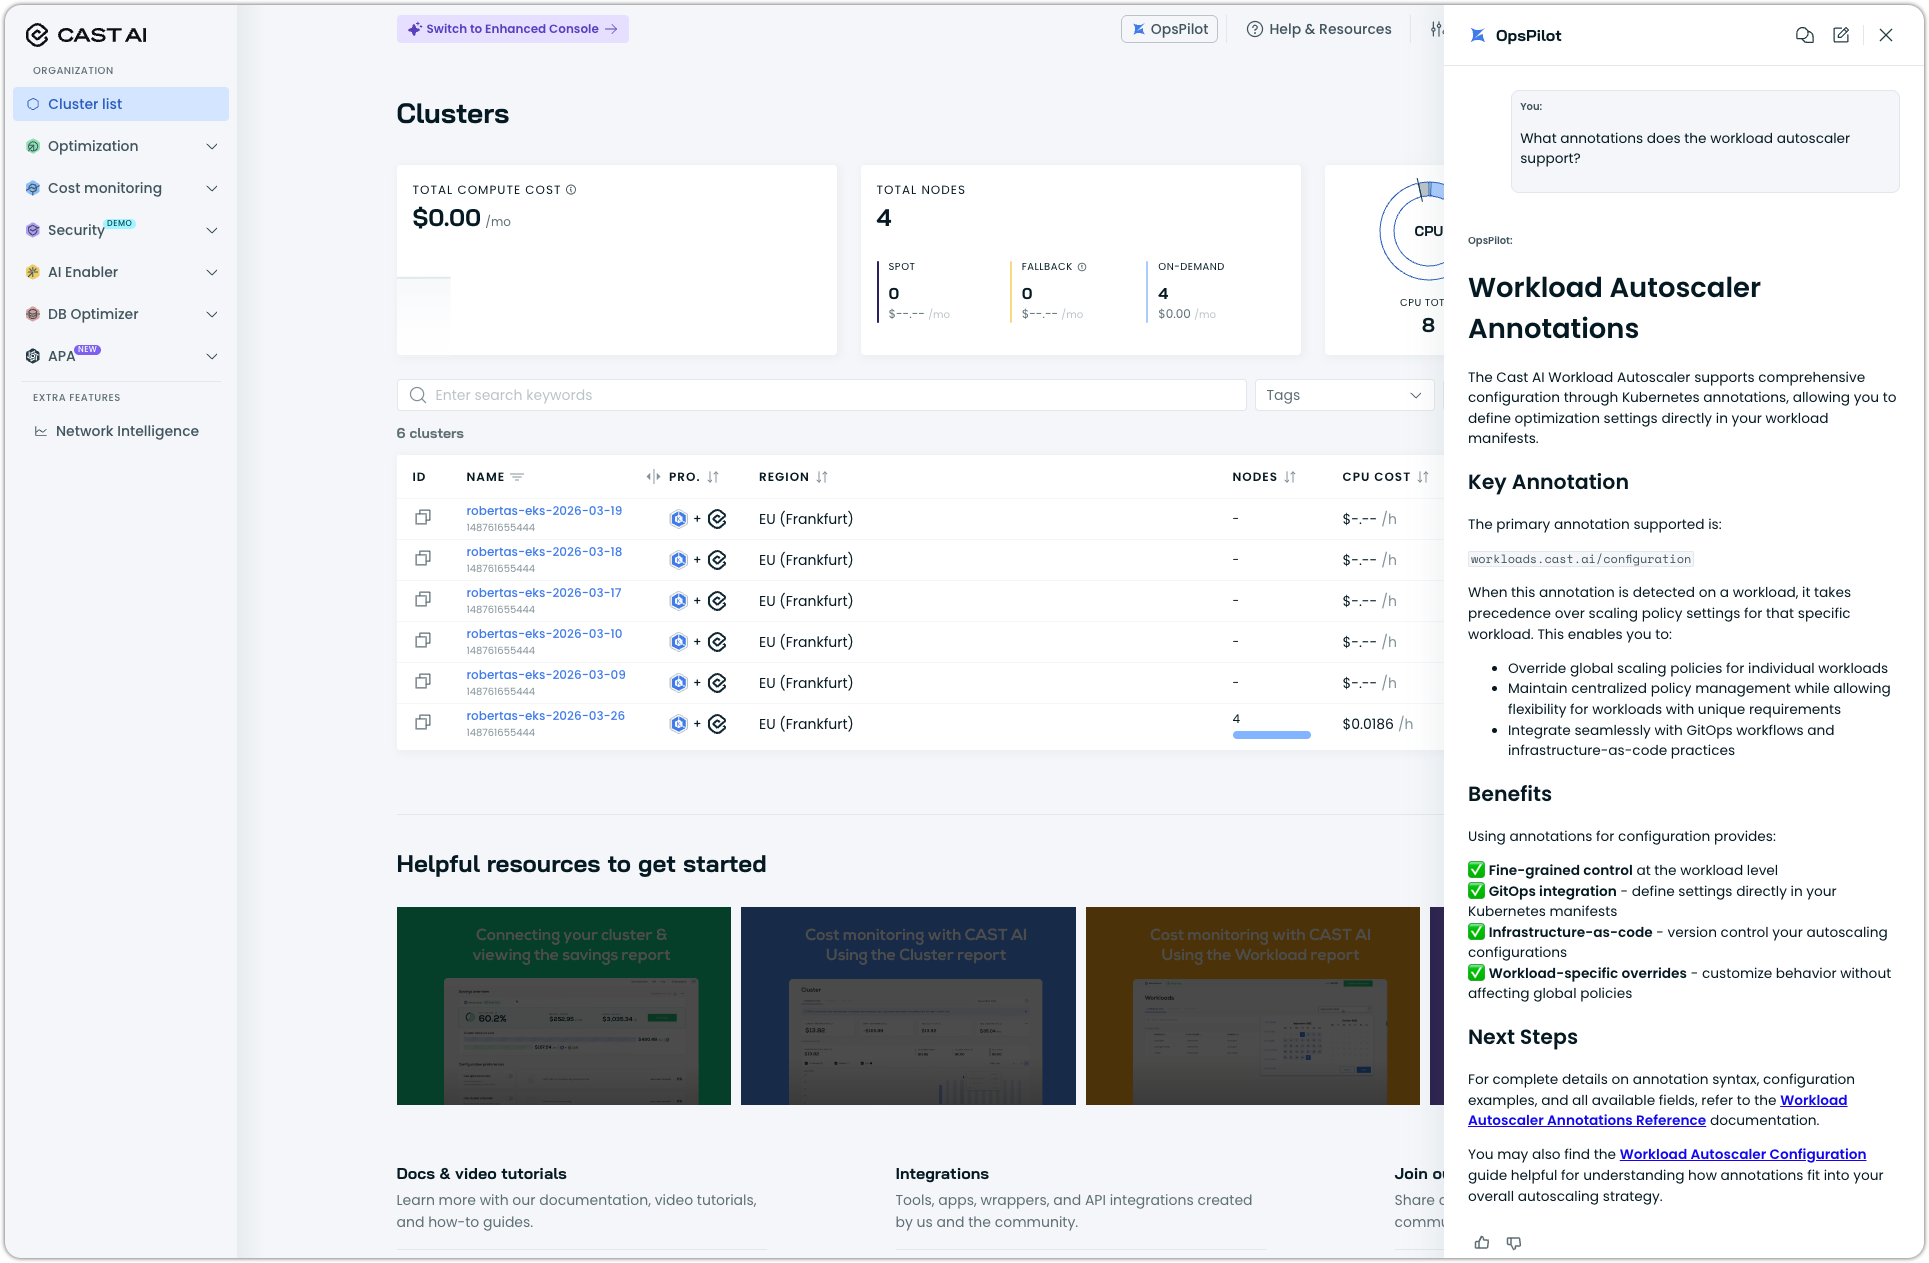
| Documentation | Cast AI feature explanations, how-to guidance, and configuration references — with source citations. | "What annotations does the workload autoscaler support?" |
OpsPilot can also handle questions that span multiple areas simultaneously. "Which nodes are underutilized and what would I save by removing them?" draws on cluster state and savings data in a single response.
Documentation index freshnessThe documentation index updates periodically. Very recent documentation changes may take up to 24 hours to appear in OpsPilot answers.
Work with cluster context
OpsPilot determines which cluster your question is about automatically using these signals (in priority order):
- Explicit mention — if you name a cluster in your question, OpsPilot uses that cluster.
- "Current cluster" or "this cluster" — uses the cluster on the console page you're currently viewing.
- Conversation context — if you asked about a cluster earlier in the session, subsequent questions default to it.
- Page context — for the first question in a session, the cluster dashboard you're viewing is used.
To switch clusters mid-conversation, mention the new cluster by name. All subsequent questions will use the new cluster until you switch again.
If you're viewing one cluster's dashboard but your conversation is about a different cluster, OpsPilot displays a hint to prevent wrong-cluster mistakes. Minor typos in cluster names are corrected automatically with a confirmation note.
Follow-up questions
OpsPilot maintains conversation context within a session, so follow-up questions work naturally:
- Ask an initial question: "Show me OOM kill events in the last 24 hours."
- Follow up with: "Which workloads were affected most?"
- Drill deeper: "What are the memory limits on those workloads?"
Enable kubectl logs
By default, OpsPilot does not have access to live container logs. To let OpsPilot fetch logs directly from your cluster, enable the cluster proxy on Kvisor:
helm upgrade -i castai-kvisor castai/castai-kvisor \
  -n castai-agent \
  --reset-then-reuse-values \
  --set controller.extraArgs.cluster-proxy-enabled=true
Once enabled, you can ask questions like "Show me the last 100 log lines from the payments-api container" and OpsPilot will retrieve them live from your cluster.
Security noteEnabling the cluster proxy allows OpsPilot to read container logs on your behalf. All requests are authenticated using your Cast AI session and scoped to your organization. Logs are not stored — they are retrieved on demand and returned within your session only.
Interpret results
OpsPilot returns structured responses designed to help you take action, not just read data. Results land in different formats depending on what you asked:
- Tables give you scannable lists of resources, cost breakdowns, and comparisons — sorted and filtered so the most relevant rows surface first.
- Charts render cost trends and time-series data inline in the console, giving you the context to understand whether a cost spike is an anomaly or a pattern.
- Console links take you directly to the relevant page to act on what OpsPilot found — for example, to apply a recommendation or inspect a specific workload. Because OpsPilot is read-only, these links are how you get from answer to action.
- Recommendations surface optimization suggestions with estimated savings impact when your question is about cost or efficiency.
- Source citations accompany documentation-based answers with links to the relevant pages on docs.cast.ai.
Use cases
Incident investigation
When pods fail or latency increases, you typically need to check workload events, review recent changes in the audit log, and cross-reference with cluster state — a process that can take 15–20 minutes across multiple dashboards.
With OpsPilot, ask a single question like "What workload optimization events happened in the api-gateway namespace in the last 24 hours, and did any cause OOM kills?" and get the full picture: the change that was made, the events that followed, and the correlation between them.
Cost attribution
Engineering or finance teams often need cost breakdowns by namespace or workload to allocate cloud costs back to product teams. Instead of exporting data and building spreadsheets, ask OpsPilot "Give me a cost breakdown by namespace for the last 30 days across all clusters, ordered by total cost" and get a formatted result immediately. Follow up with "Which workload in the analytics namespace is most expensive?" to drill deeper.
Weekly reporting
Summarizing autoscaling activity or cost trends for stakeholders typically requires exporting event data, filtering, and building a summary. OpsPilot handles this in a single question: "How many autoscaling events happened last month and how many traffic surge events occurred?"
Onboarding new engineers
New team members can ask OpsPilot about Cast AI features and get targeted answers without leaving their workflow. Questions like "How does spot instance management work?" or "What policies control autoscaling?" return synthesized answers drawn from Cast AI documentation, with source links for further reading.
Data security and privacy
OpsPilot enforces strict data isolation and privacy:
- Organization-level isolation — every query is scoped to your organization. Data isolation is enforced at the database level, not just in the application layer. There is no path to access another organization's data.
- Input validation — all queries pass through multiple validation layers before processing, including pattern-based detection and machine-learning-based scanning for prompt injection attempts.
- Response sanitization — internal identifiers like cluster UUIDs are resolved to friendly names in responses. Internal system details are never surfaced.
- No model training on your data — your cluster data is never used to train AI models. OpsPilot queries your data in real time and returns results within your session.
Current limitations
| Limitation | Details |
|---|---|
| Read-only | OpsPilot answers questions and surfaces recommendations but cannot apply changes, modify policies, or execute actions. Use the provided console links to take action. |
| Single organization | Cannot query across multiple organizations in one question. |
| Session timeout | Session context expires after 1 hour of inactivity. Start a new question with the full context — including the cluster name if needed — after a timeout. |
| Documentation freshness | Very recent doc updates may take up to 24 hours to appear in answers. |
| Event history window | Detailed workload events are available for the last 90 days. Audit log availability depends on retention settings. |
| Chart export | Trend charts render in the console UI only. They cannot be exported or shared directly from OpsPilot. Use screenshots as a workaround. |
| No API access | OpsPilot is available through the Cast AI console only. There is no public API for programmatic access. |
Troubleshooting
| Issue | What to do |
|---|---|
| OpsPilot can't find your cluster | Verify the cluster is connected and active in Cast AI. Navigate to the cluster's dashboard and try again — page context helps resolve the cluster. Check for typos in the cluster name. |
| Cost data looks different from the reports page | Cost data updates at 5-minute intervals. Very recent changes (last few minutes) may not be reflected yet. For historical data gaps, confirm the cluster was connected during the query period. |
| Container logs are unavailable | kubectl logs access requires the Kvisor cluster proxy to be enabled. Run the Helm upgrade command in Enable kubectl logs. After upgrading, allow a few minutes for the change to take effect. |
| DBO questions return no data | Confirm that DBO is enabled and deployed on the cluster you are asking about. If DBO was recently enabled, allow a few minutes for OpsPilot to pick up the deployment state. |
| OpsPilot can't answer a question | Not all question types are supported yet. Try rephrasing the question or breaking it into simpler parts. If the gap persists, share feedback through your TAM. |
| Cluster UUID appears instead of the name | This can happen for very recently connected clusters. The name typically resolves within a few hours. |