

Instance dashboard
Select an instance from the organization overview by clicking the instance name in the table, or pick it from the Select database server picker in the left nav. The instance's Dashboard is its landing page: a per-database summary of everything DBO is doing on that server.
Header tiles
A row of tiles identifies the instance:
- INSTANCE: the instance name, with a copy icon.
- DB ENGINE: for example, PostgreSQL.
- INSTANCE TYPE, REGION, ACCOUNT: cloud metadata for the instance. These are populated for instances DBO discovers through a connected cloud account (the demo AWS RDS instance shows db.r6g.2xlarge, us-east-1, and acc-demo-aws-001); manually connected instances can show "--" here.
- ENDPOINTS: how many proxy endpoints are configured (for example, 1), with an external-link icon that opens the endpoint configuration.
Status row
Below the tiles, five statuses tell you whether DBO's components are running and which features are on:
- ADVISOR AGENT: Active when the agent is monitoring your query workload.
- DATABASE PROXY: Active when the proxy is routing traffic.
- PERFORMANCE ADVISOR, CACHING, CONNECTION POOLING: Enabled when each feature is switched on.
Time range and navigation
The picker at the top right (for example, "Last hour GMT +02:00") sets the window every metric on the page reports on. The instance's section of the left nav covers Dashboard, Caches, Connections, Performance, Audit log, and Settings; AWS- or Google Cloud-connected instances also get a Health tab (see below). Under DATABASE, the Select database picker jumps into a single database's views.
The databases list
The body of the page lists each database on the instance (for example, "2 databases"). + Add databases registers another database for DBO to monitor, and Enter search keywords with Clear all filters the list.
Each database gets its own section with three cards. Expect meaningful numbers only once your application traffic is routed through the proxy; until then, caching and connection metrics have nothing to measure.
- Performance advisor opens with a summary such as "Found 3 advisories that could improve your current database performance:", followed by Analysis scope: (350 QUERIES / 120 INDEXES, how much of the workload the advisor has analyzed), Affected queries: (15), and Affected queries DB time: (35% 25K MS, the share of database time those queries consume). View advisories → opens the database's Performance Advisor.
- Caching reads "Caching is optimal and current values:" when caching needs no attention, and shows Hit rate: (68%), Cache hits: (482.1K), and DB time saved: (45%). View cache details → opens the database's Caching views.
- Connections reads "Connections are optimal and current values:" and shows Connection reduction: (65%), APP → Proxy: (200 client connections reaching the proxy), and Proxy → DB: (50 connections reaching the database, the reduction pooling achieves). View connections detail → opens the database's connection pooling views.
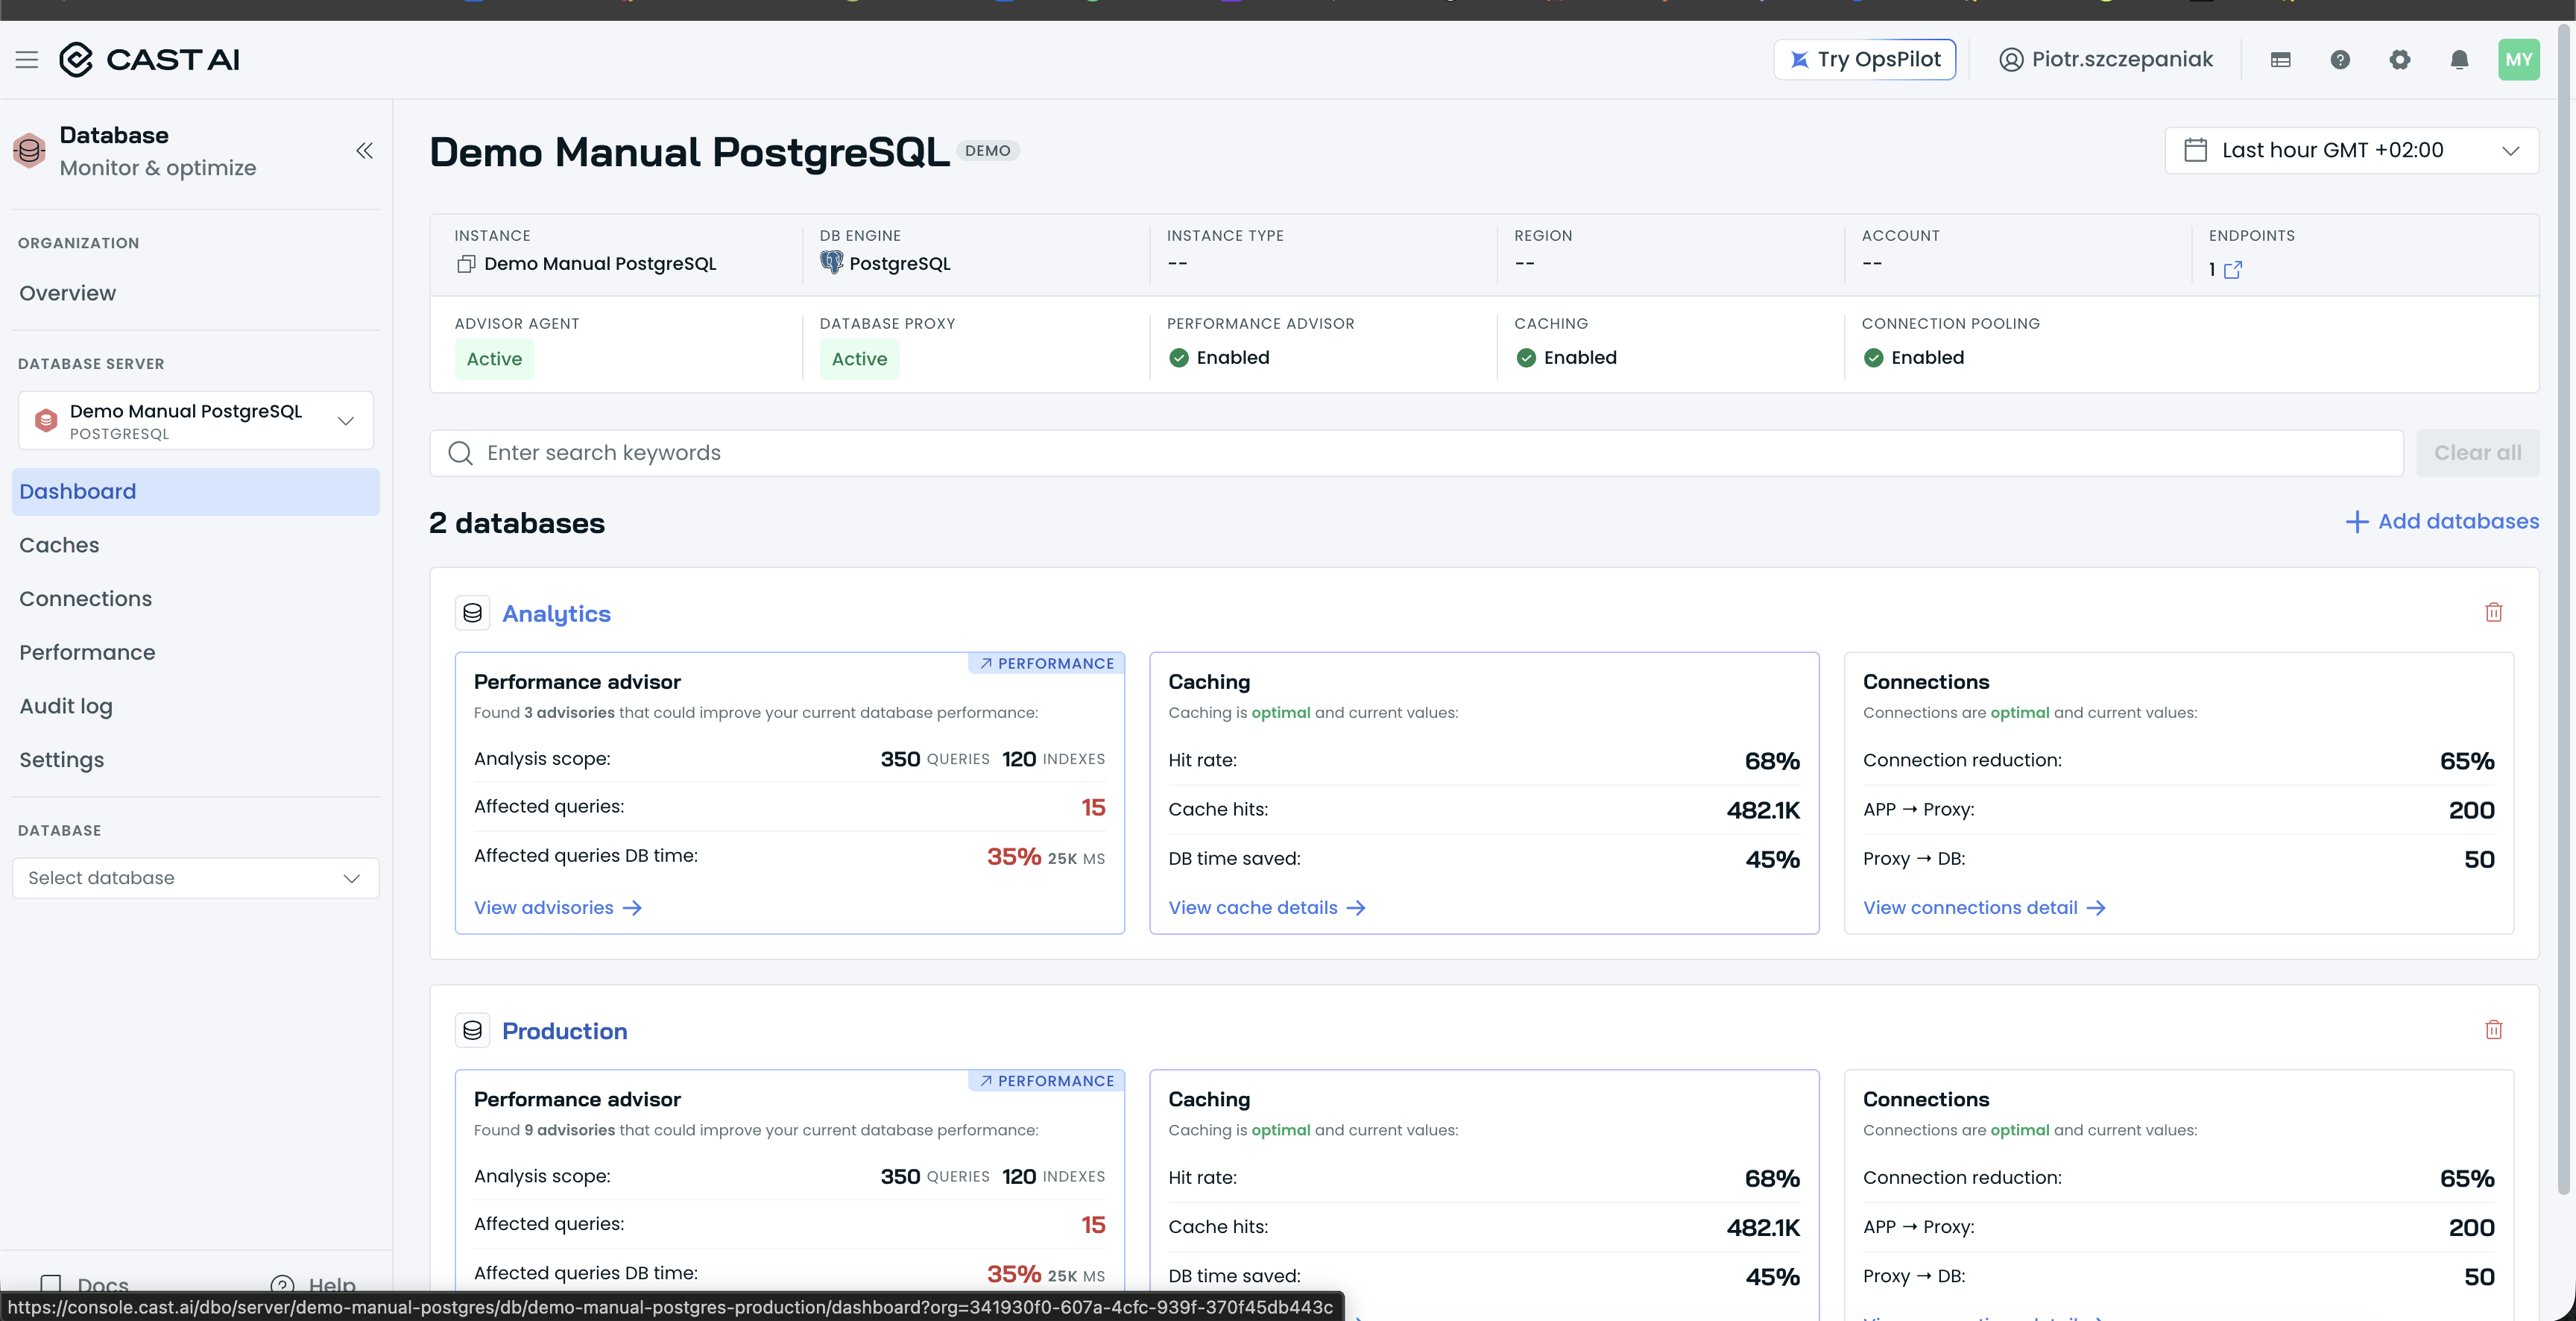
The instance dashboard, with the header tiles, the status row, and the per-database cards.
The Health tab
AWS- or Google Cloud-connected instances add a Health tab to the instance navigation, with node-level resource charts: CPU UTILIZATION (for example, 25.14%), DATABASE CONNECTIONS (59), MEMORY USAGE (44.91%), and DISK IOPS (816), each with an expand icon. When the instance has several nodes, filter by Node (Node: All, Clear all). Use Health to separate resource pressure from query problems: high CPU or disk IOPS alongside a healthy cache hit rate points at instance sizing, while the reverse points at the workload.
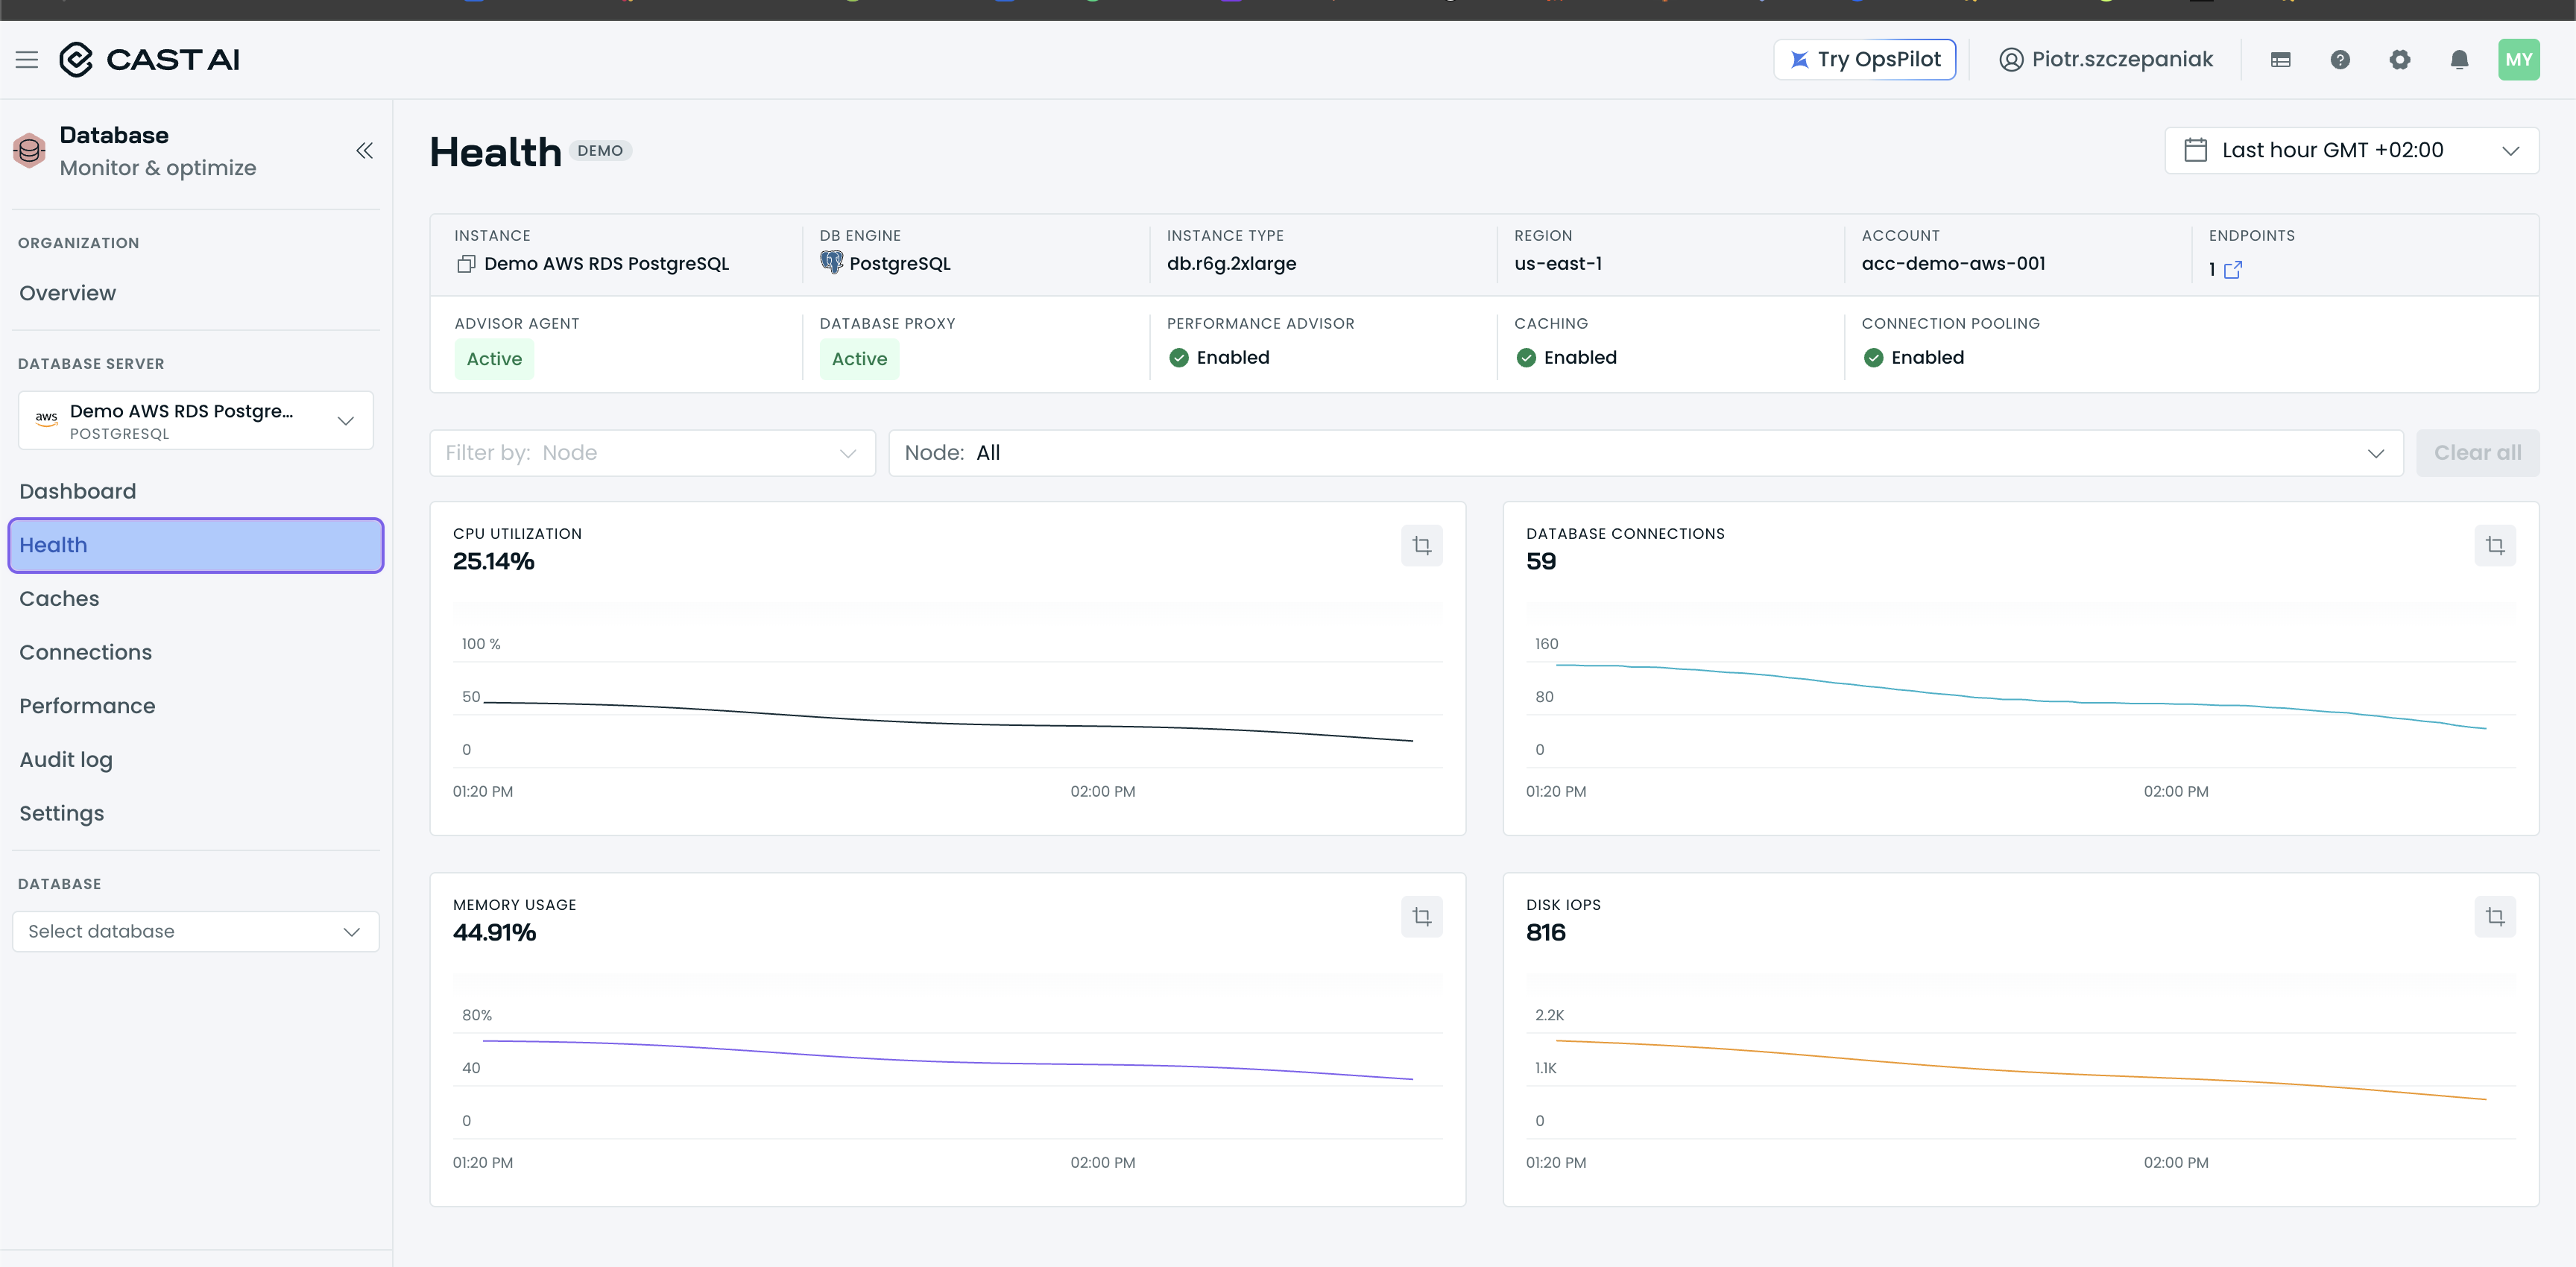
The instance Health tab, with CPU utilization, database connections, memory usage, and disk IOPS charts and the node filter.
Next steps
Updated 2 hours ago