

Organization overview
The Overview page (left nav: ORGANIZATION → Overview) is DBO's fleet-level landing page. Its heading is Database optimization, and it answers three questions at a glance: which instances are connected, where the biggest optimization wins are, and which instances need attention.
Onboarded and Not onboarded
Tabs at the top of the page split your fleet, each with a live count:
- Onboarded (3): the instances you've connected to DBO. The summary cards and the instances table below describe this tab.
- Not onboarded (2): instances DBO has discovered in your environment that aren't connected yet. Switch to this tab to see what's still available to onboard.
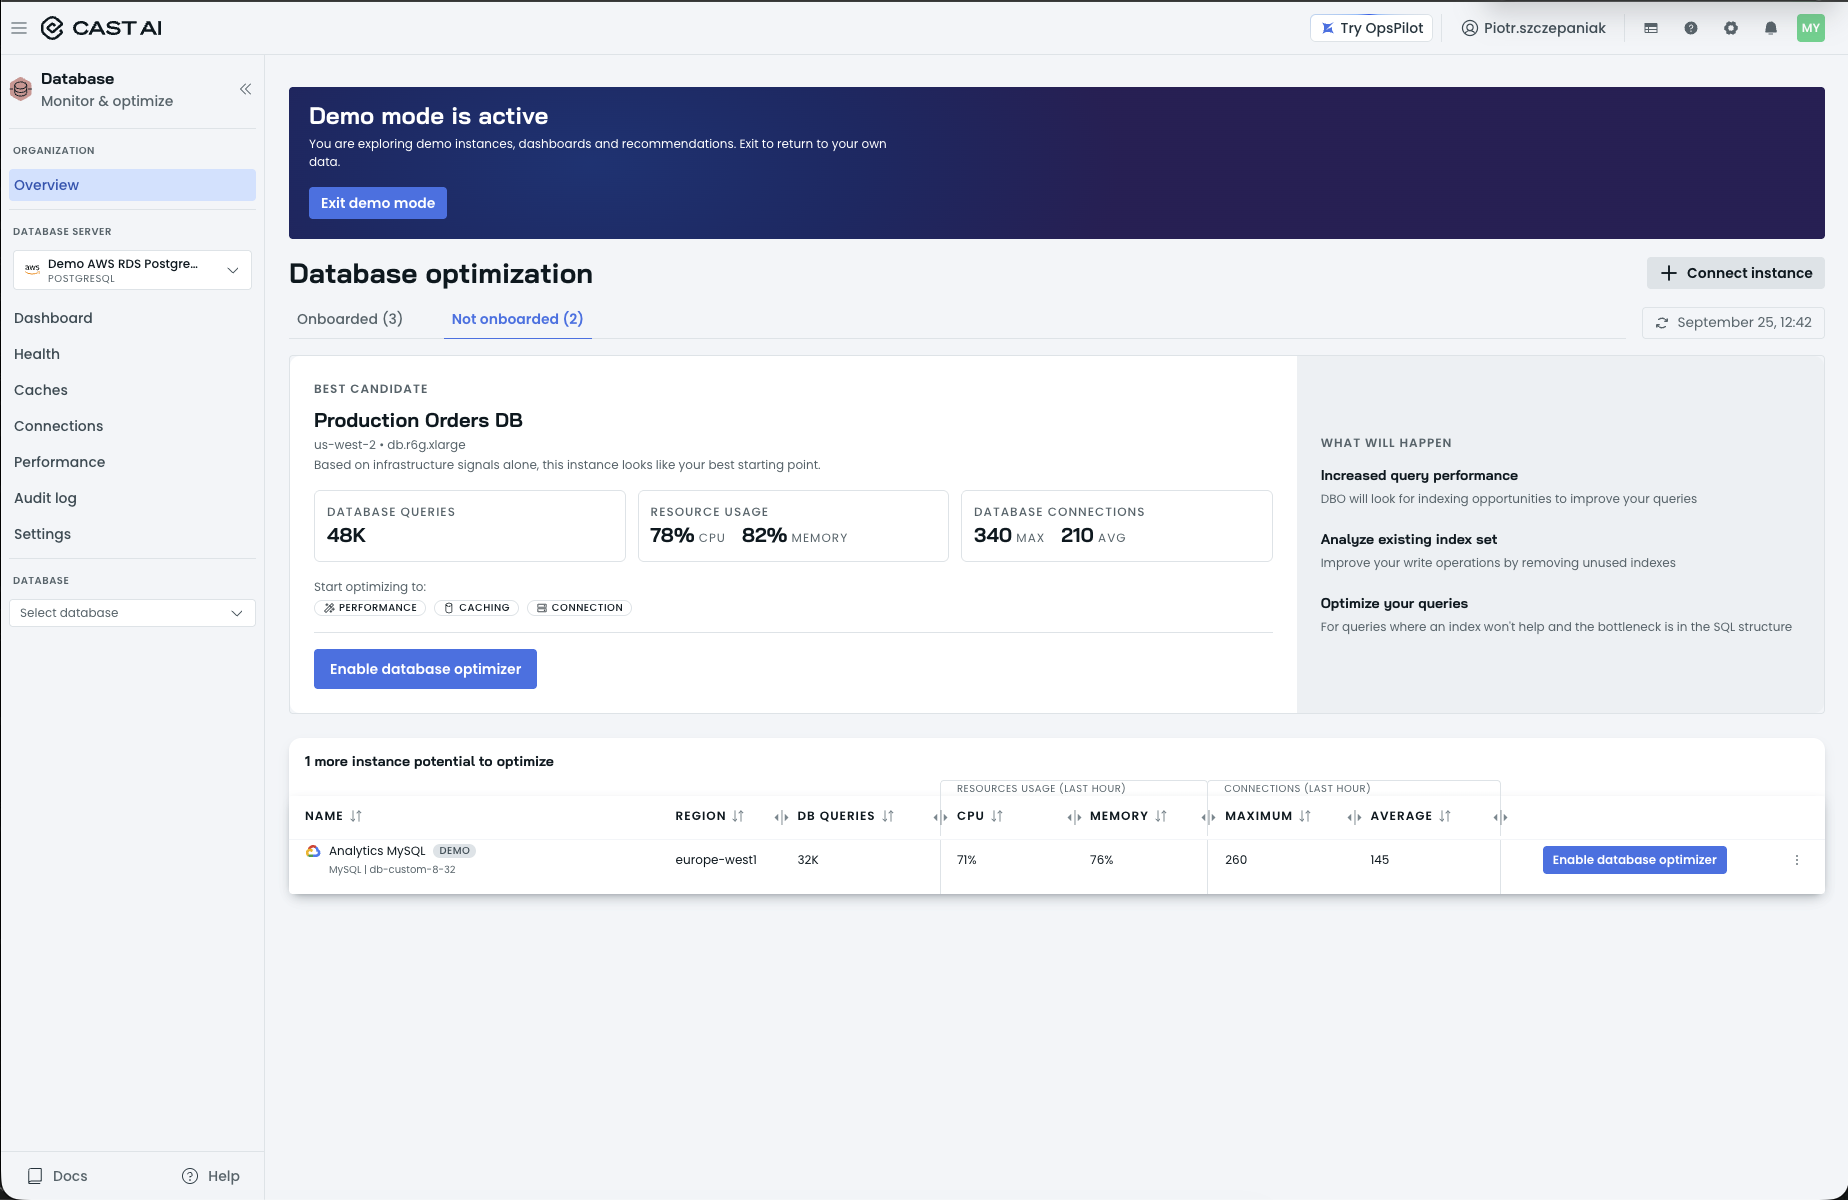
The Organization Overview's Not onboarded tab, with the BEST CANDIDATE card and the Enable database optimizer actions.
Summary cards
Three cards summarize the highest-value opportunities across all onboarded instances:
- Top 5 recommendations: the five highest-impact Performance Advisor recommendations across the fleet. Each row carries an impact badge (H for high or M for medium), the recommendation text (for example, "Optimize slow query in Production" or "Add index on Production for better performance"), its type (Query or Index), and the instance and database it applies to. Select a row to go to that recommendation.
- Cache hits: your organization-wide cache hit rate (for example, 65%, "35K cache hits across 6 databases"), with a TOP CANDIDATES list of the databases with the most projected headroom, each marked with a projected delta such as "↑75% PROJECTED".
- Connection pooling: the connection reduction achieved so far (for example, 55%, "reduction across 5 instances"), with a TOP CANDIDATES list showing how many IDLE connections pooling can eliminate on each instance.
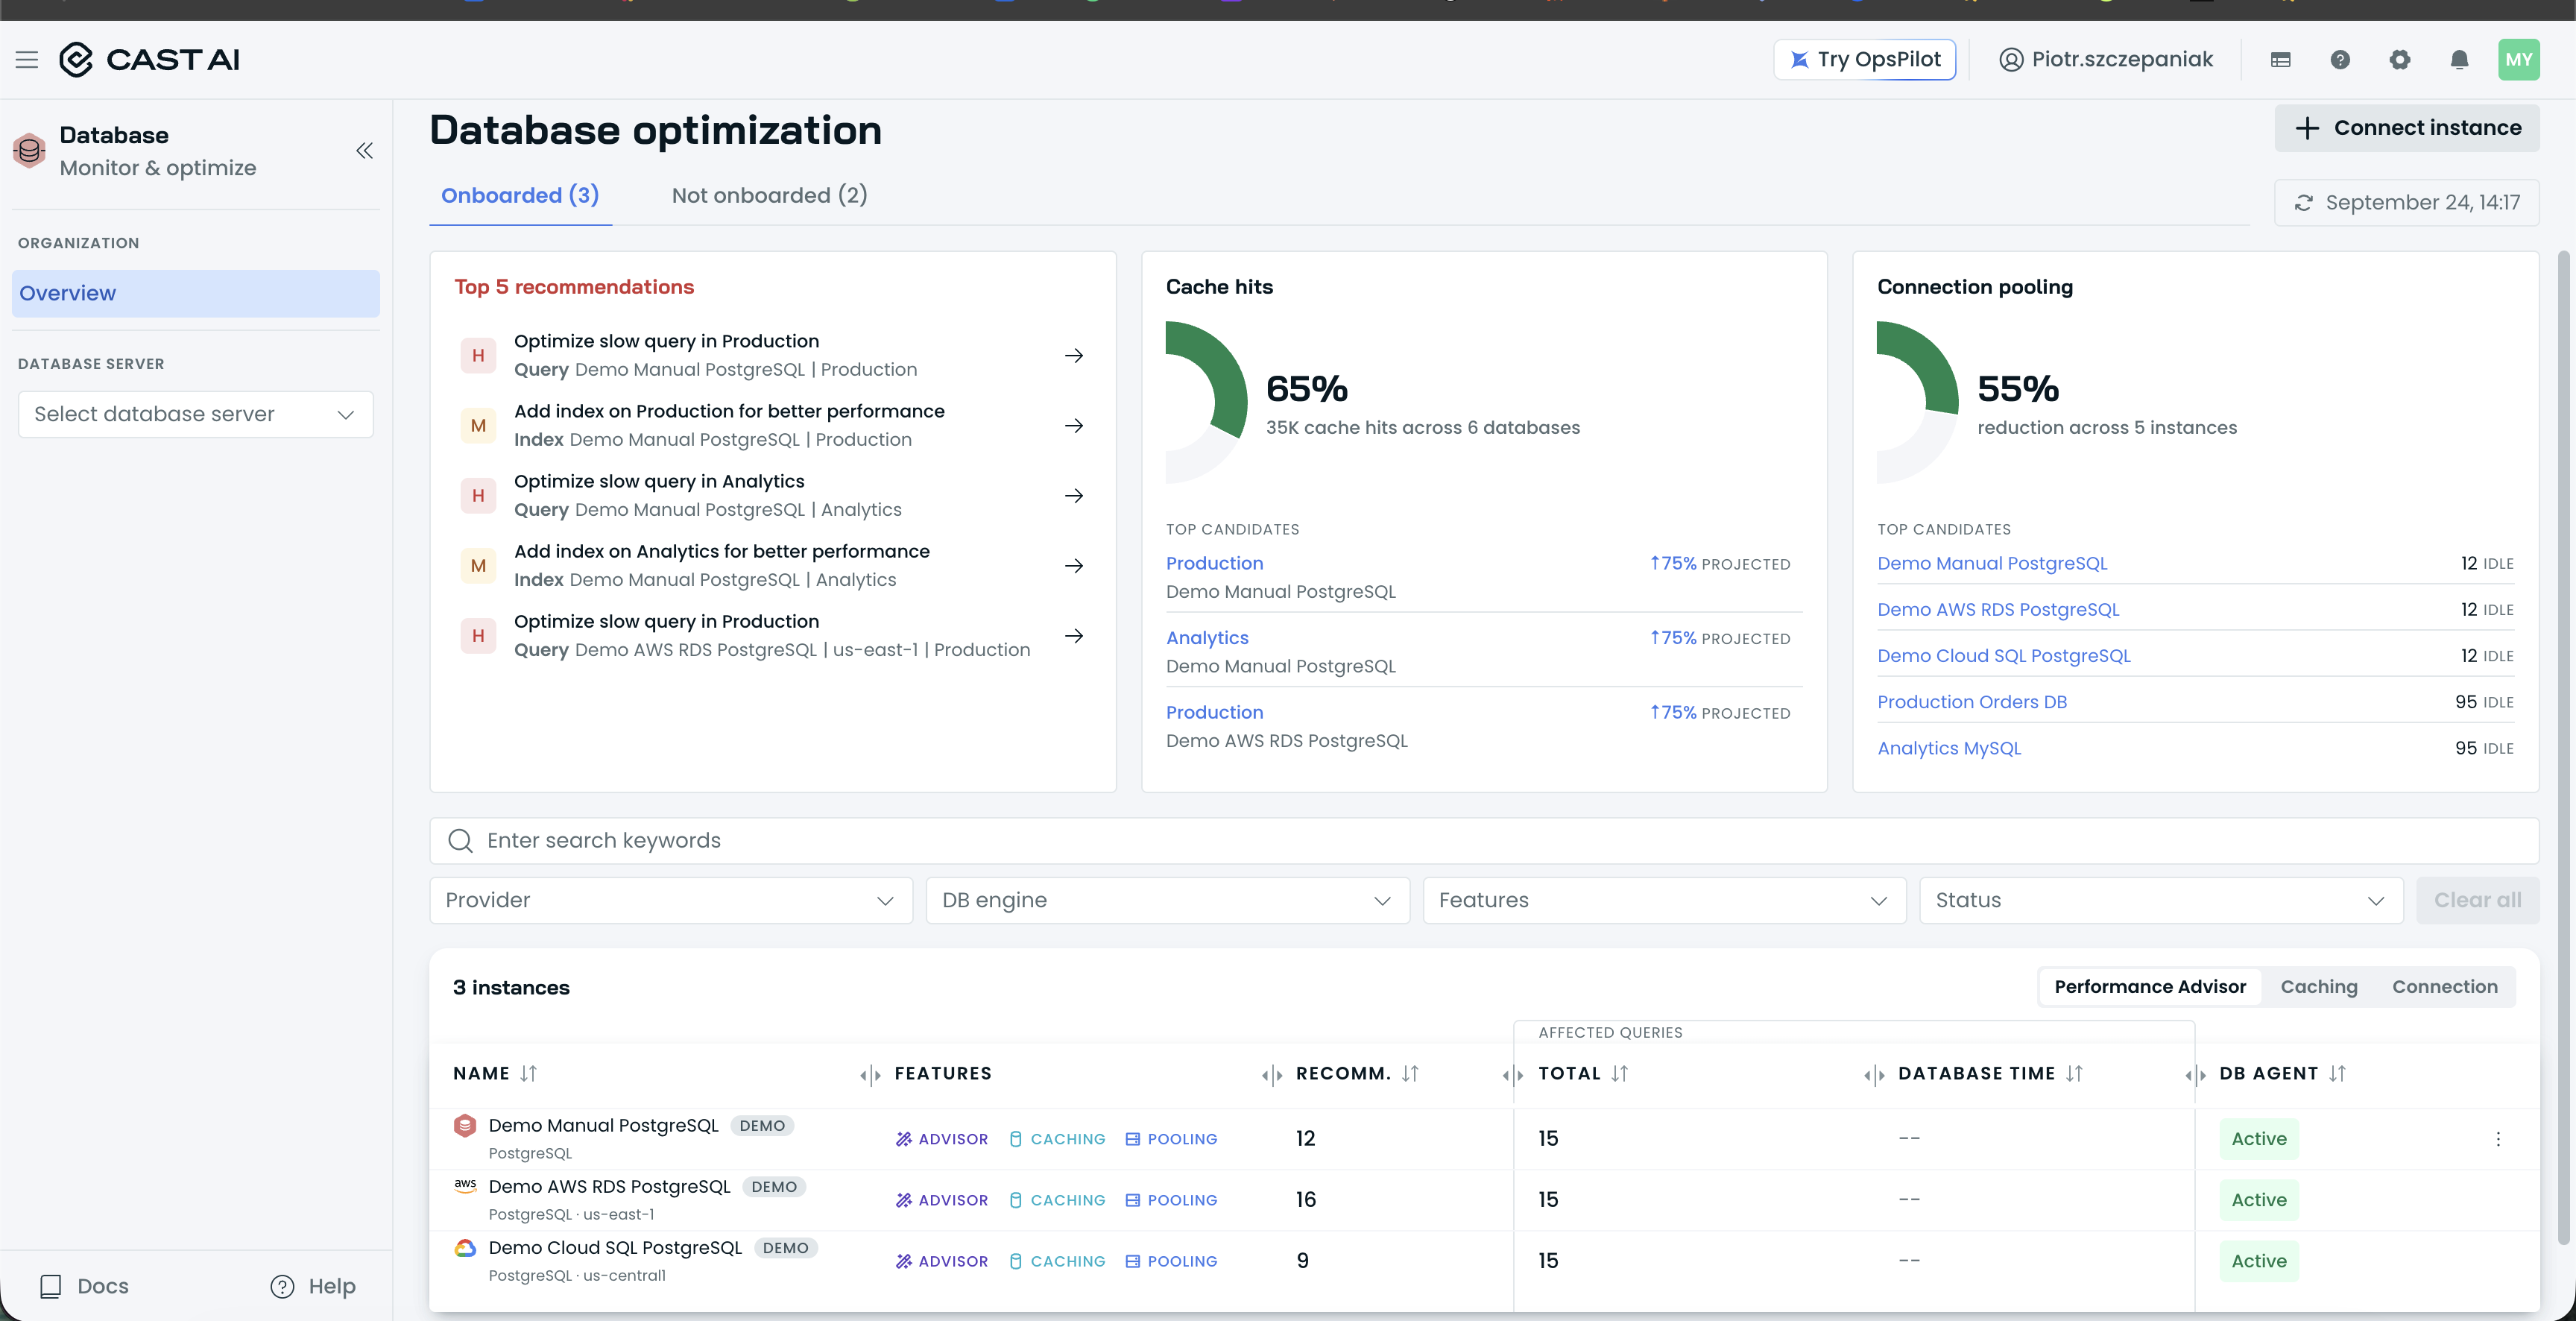
The organization Overview, with the Top 5 recommendations, Cache hits, and Connection pooling cards and the instances table.
Filtering
Above the instances table, Enter search keywords searches by name, and dropdown filters narrow the list by Provider, DB engine, Features, and Status. Clear all resets every filter.
The instances table
The table (titled, for example, "3 instances") lists one row per onboarded instance:
- NAME: a provider icon, the instance name (a link to that instance's dashboard), the engine and region (for example, "PostgreSQL · us-east-1"), and a DEMO badge on demo instances.
- FEATURES: chips showing which features are enabled for the instance: ADVISOR, CACHING, POOLING.
- RECOMM.: a recommendation count for the instance.
- Metric columns, which depend on the column group selected in the switcher at the top right of the table: Performance Advisor, Caching, or Connection. Under Performance Advisor, the table shows AFFECTED QUERIES split into TOTAL and DATABASE TIME.
- DB AGENT: the agent status, shown as Active when the agent is reporting.
A ⋮ menu at the end of each row offers per-row actions.
Data freshness and navigation
The stamp at the top right (for example, "September 24, 14:17") shows when the data was last refreshed; the refresh icon beside it updates it. Selecting an instance name in the table opens that instance's instance dashboard.
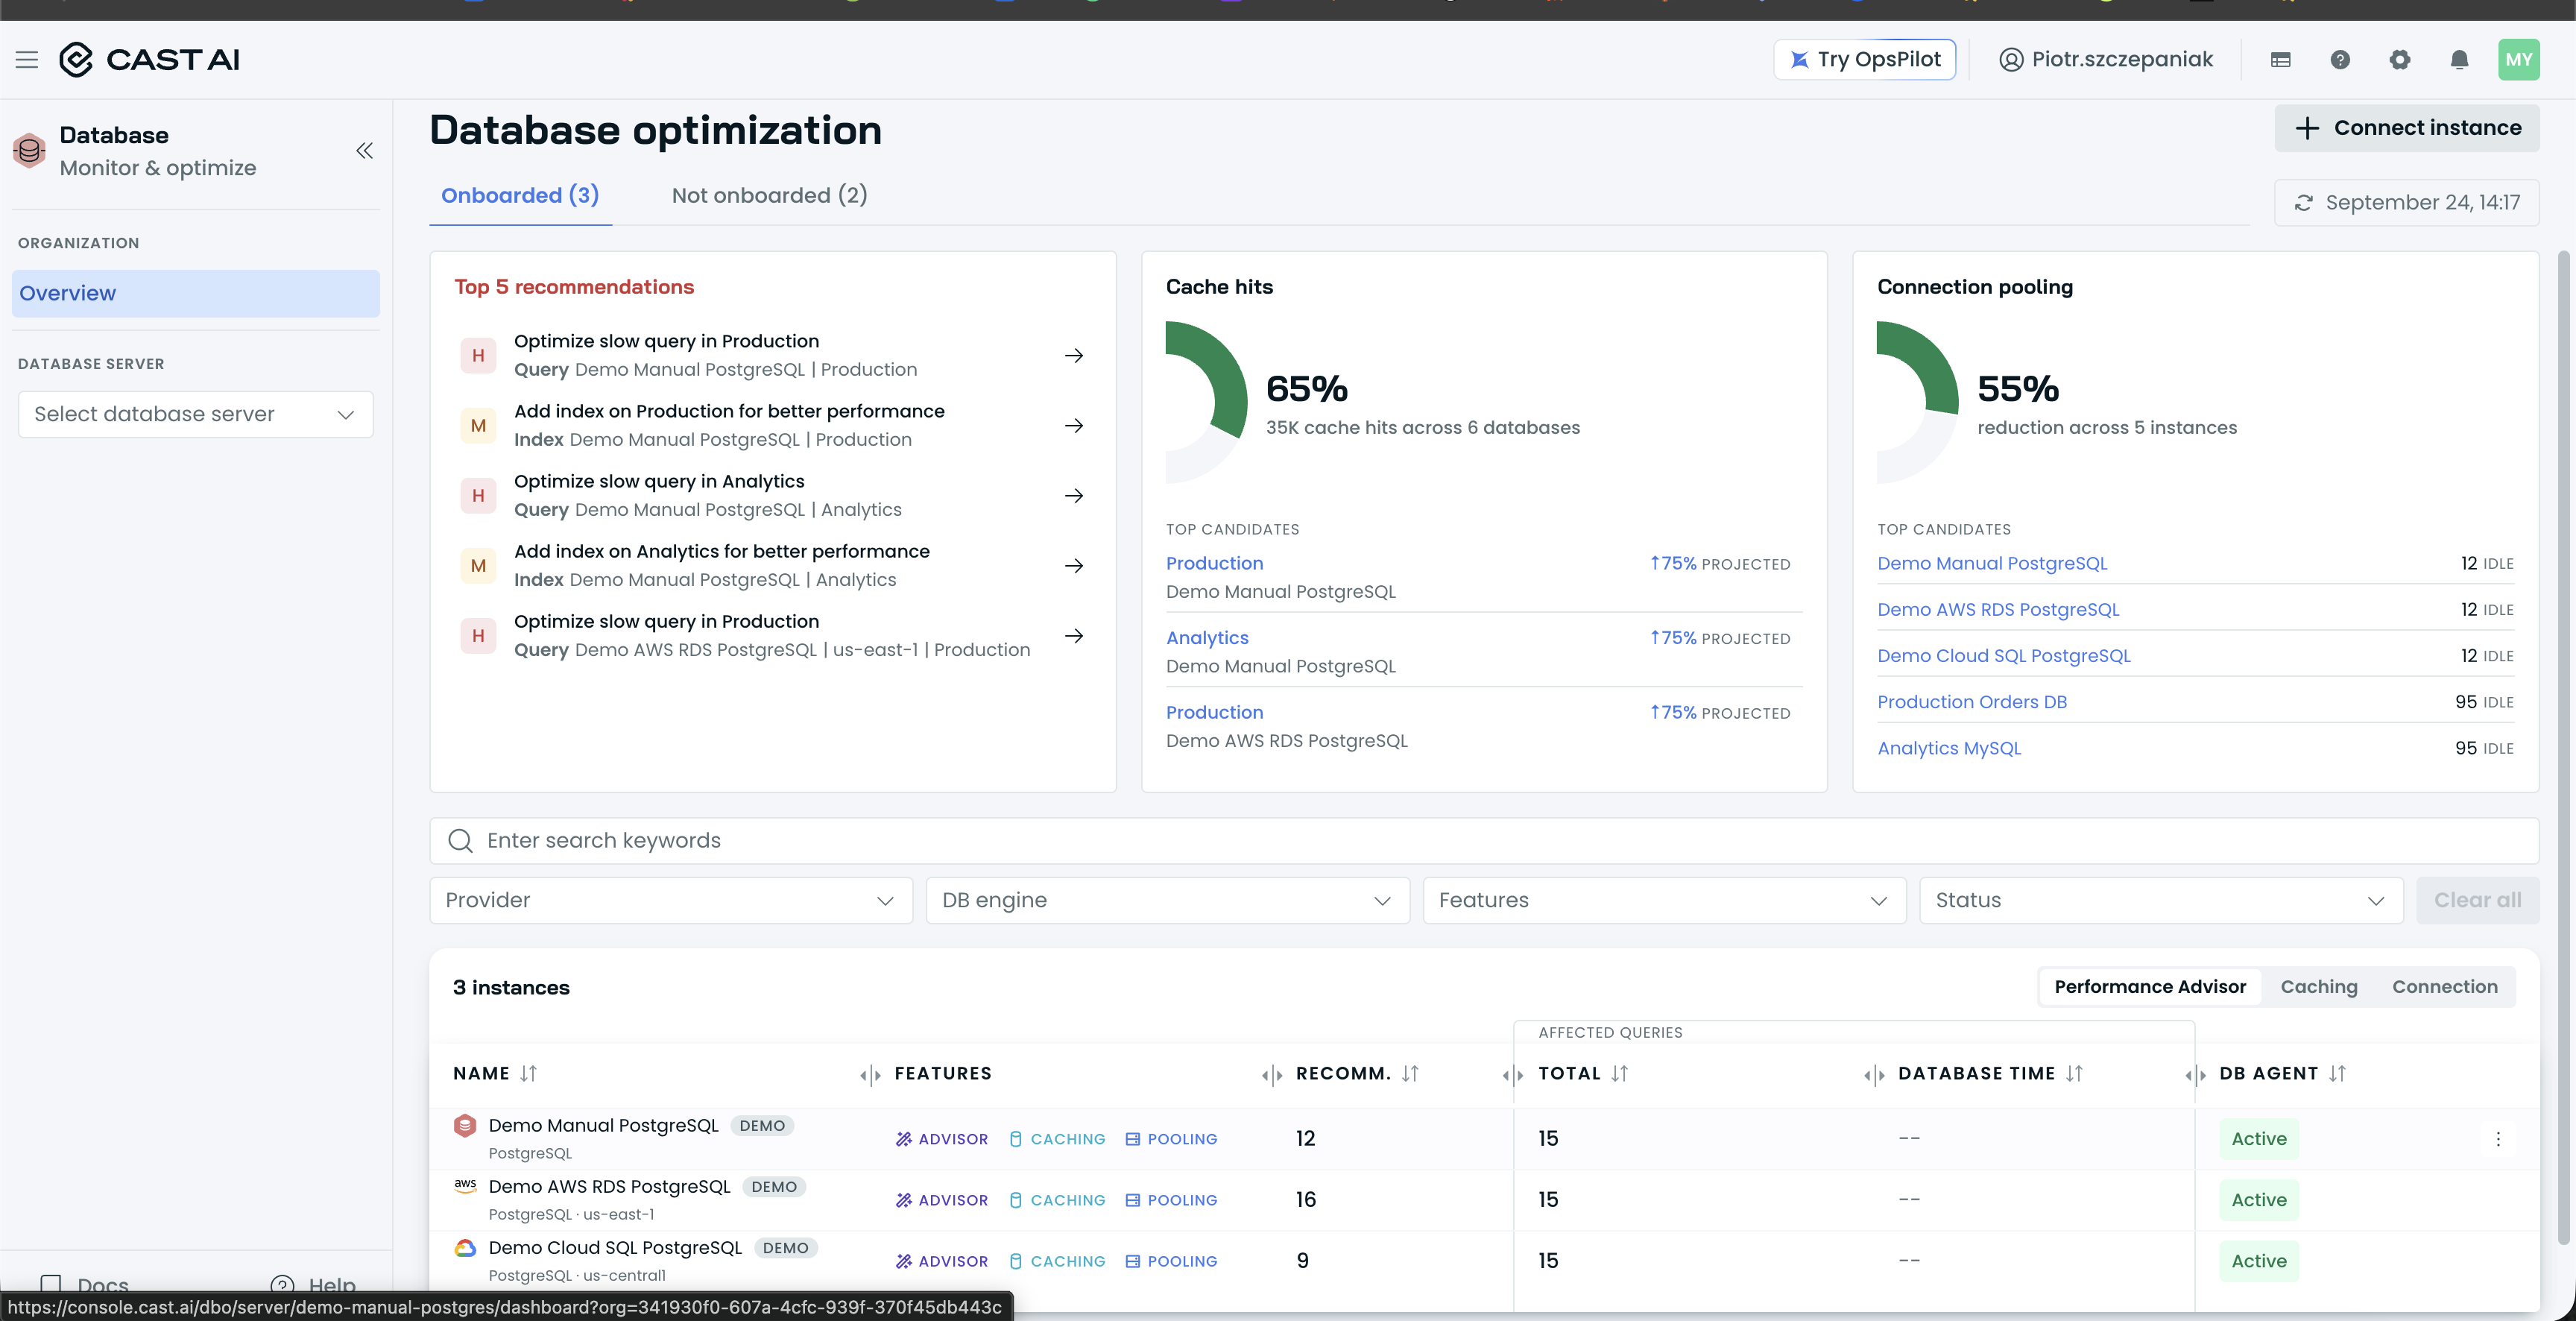
Hovering an instance name in the table shows the link to that instance's dashboard.
Next steps
Updated 3 hours ago