

Performance Advisor
Performance Advisor analyzes your database workload and recommends concrete changes (missing indexes, query rewrites, and other optimizations) that reduce query execution time. It supports PostgreSQL and MySQL, and every recommendation includes the SQL to apply and the reasoning behind it. Every recommendation is validated, and for the queries it impacts, the recommendation page shows a comparison of explain plans so you can see the expected effect before you apply anything.
How it works
Performance Advisor runs through a lightweight agent, shown as ADVISOR AGENT in the console, that you deploy alongside your database. The agent collects two kinds of information:
Query statistics are read from the database's own query statistics views, so recommendations reflect your real workload.
Metadata covers table structures, existing indexes, and column statistics.
Collection is read-only and non-intrusive: the agent never modifies your application queries or your data, and captures only anonymized query templates (see Security and compliance). For deployment steps, see Installing the agent for PostgreSQL and Installing the agent for MySQL.
What it recommends
Recommendations come in two types:
Index recommendations, such as Create idx_billing_user_id, name the table and columns involved (for example, Table: users, Columns: created_at, sku) and give you the exact CREATE INDEX statement to run.
Query rewrites, such as Optimize JOIN with sequential scan, Add LIMIT to unbounded query, or Remove redundant ORDER BY, cut execution cost without schema changes.
Reading the Performance Advisor page
Open the page from the database navigation (Performance advisor).
Stat tiles
Three stat tiles summarize the current state:
- OPEN RECOMMENDATIONS: how many recommendations are open, split by type (for example, 9: Index 3, Query 6).
- AFFECTED QUERIES: how many analyzed queries are affected by open recommendations, out of the total analyzed (for example, 27 of 4.2K).
- AFFECTED QUERIES DB TIME: the share of database time those queries account for (for example, 35%, or 46 s 800 ms).
Recommendations table
Below the tiles, the search box and the Type, Impact, Categories, and Status filters (with Clear all) narrow the recommendations table. Each row shows:
- TYPE: Index or Query.
- IMPACT: the expected benefit, badged Critical, High, or Medium.
- RECOMMENDATION: the suggested change; index recommendations add the table and columns.
- CATEGORIES: the kind of improvement, shown as icons; hovering an icon shows a tooltip describing the category (for example, "Recommendations that simplify query structure, making it easier for teams to understand and maintain" or "Recommendations that address patterns which may produce unexpected results under certain conditions, such as data integrity issues or silent bugs").
- Close: dismisses a recommendation you don't intend to apply, removing it from the open list. Recommendations you do apply need no action: they disappear from the open list on their own after the next analysis cycle.
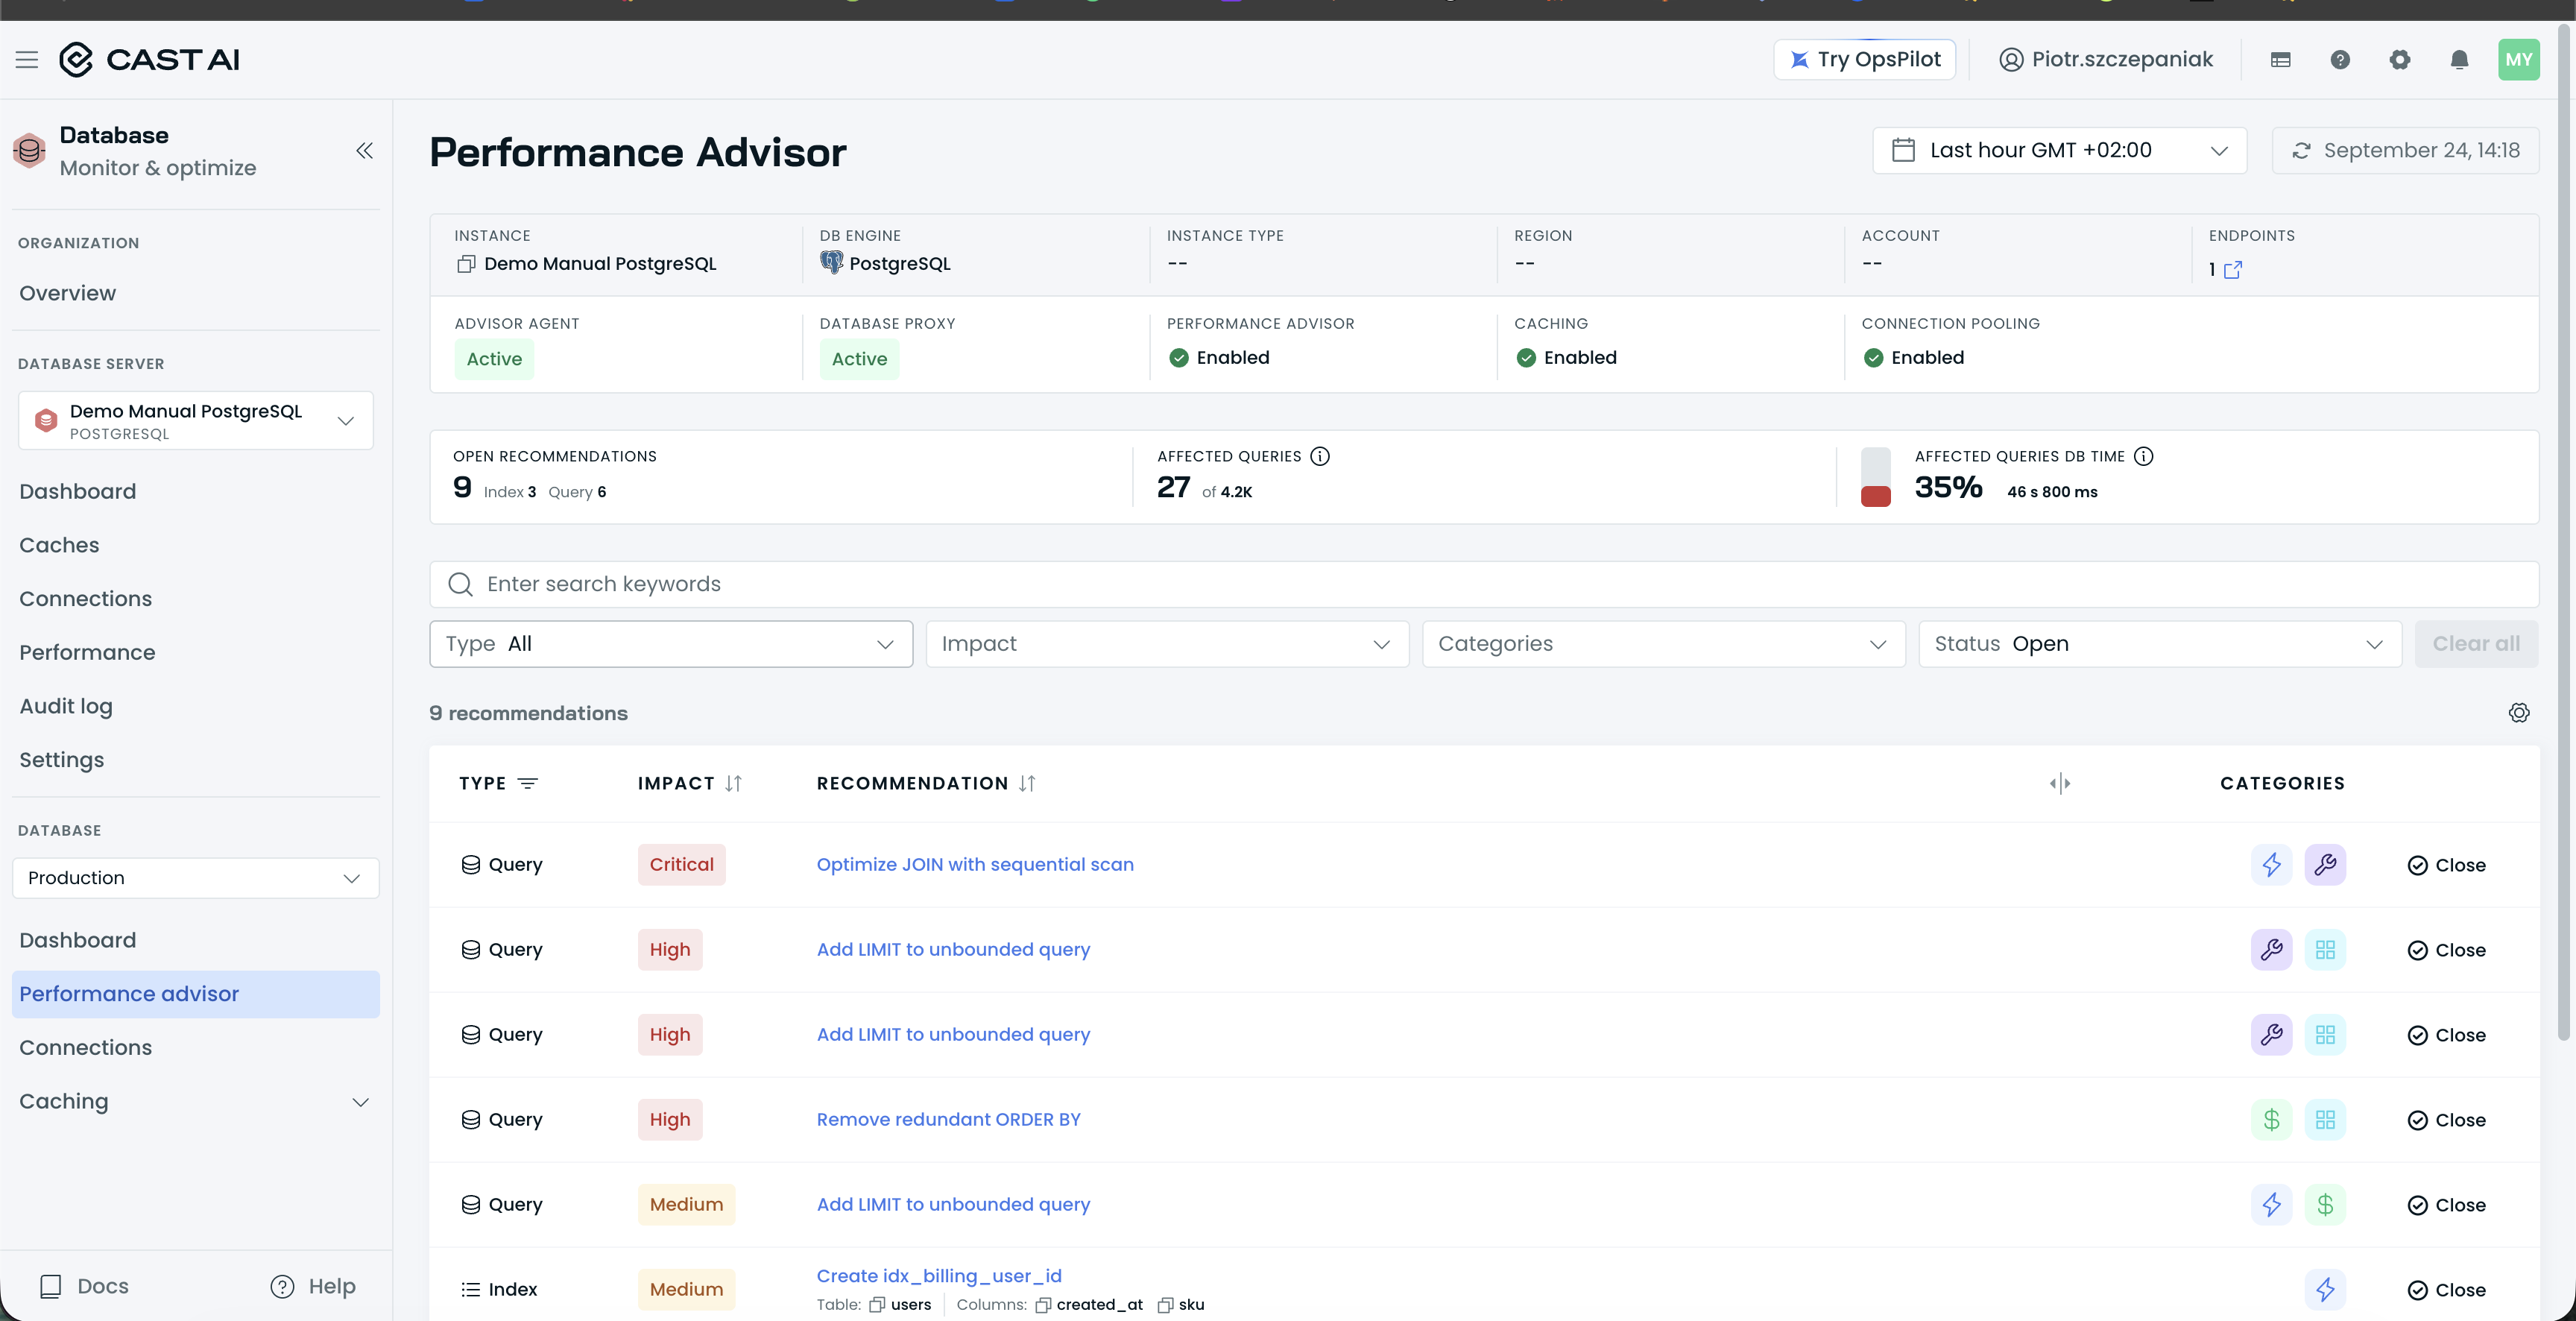
The Performance Advisor page, with the three stat tiles, the filters, and the recommendations table.
Clicking a recommendation title opens its full Recommendation page.
Index recommendations show the RECOMMENDATION TYPE, IMPACT, target TABLE and COLUMNS, the Current index definition, and a ready-to-run Drop DDL suggestion (or CREATE INDEX statement for a new index). A Recommendation reason box explains the rationale (for example, "Unused for 33 days (0 scans in 1+ week). Monitor before dropping. Size: 6.6 MB"), and All existing indexes lists the indexes covering the same queries, with INDEX SCANS and INDEX SIZE per index.
Query recommendations open with Overview and Execution Plan tabs. A Projected impact row compares the current and projected values for Planning time, Planning cost, Plan rows, Execution time, and Plan nodes, and side-by-side Original query and Improved query panels explain the problem and the rewrite, with the SQL for both. A banner counts similar queries that would benefit from the same change (View queries).
A Close button on the page dismisses the recommendation.
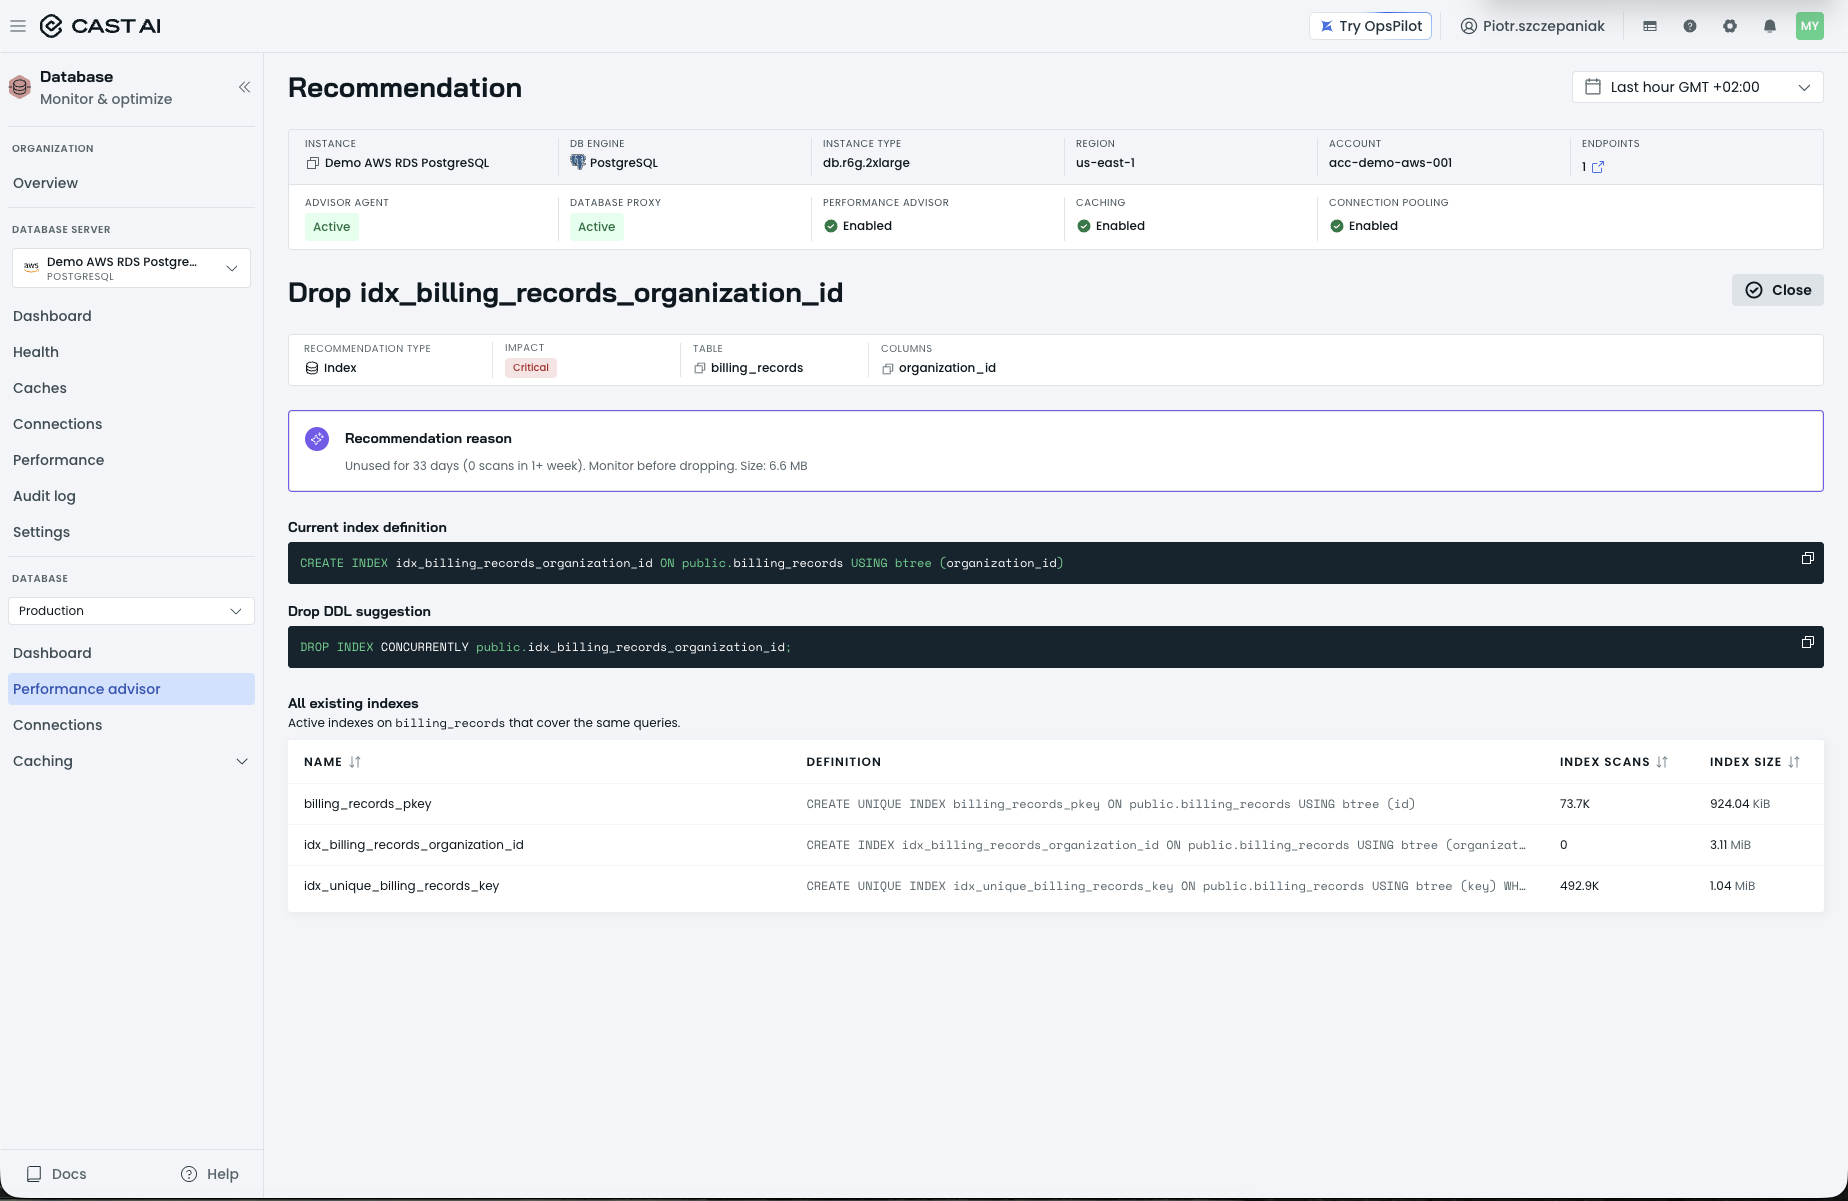
An index recommendation's detail page, with Recommendation reason, Current index definition, Drop DDL suggestion, and the existing-indexes comparison.
An opened Query recommendation looks like this:
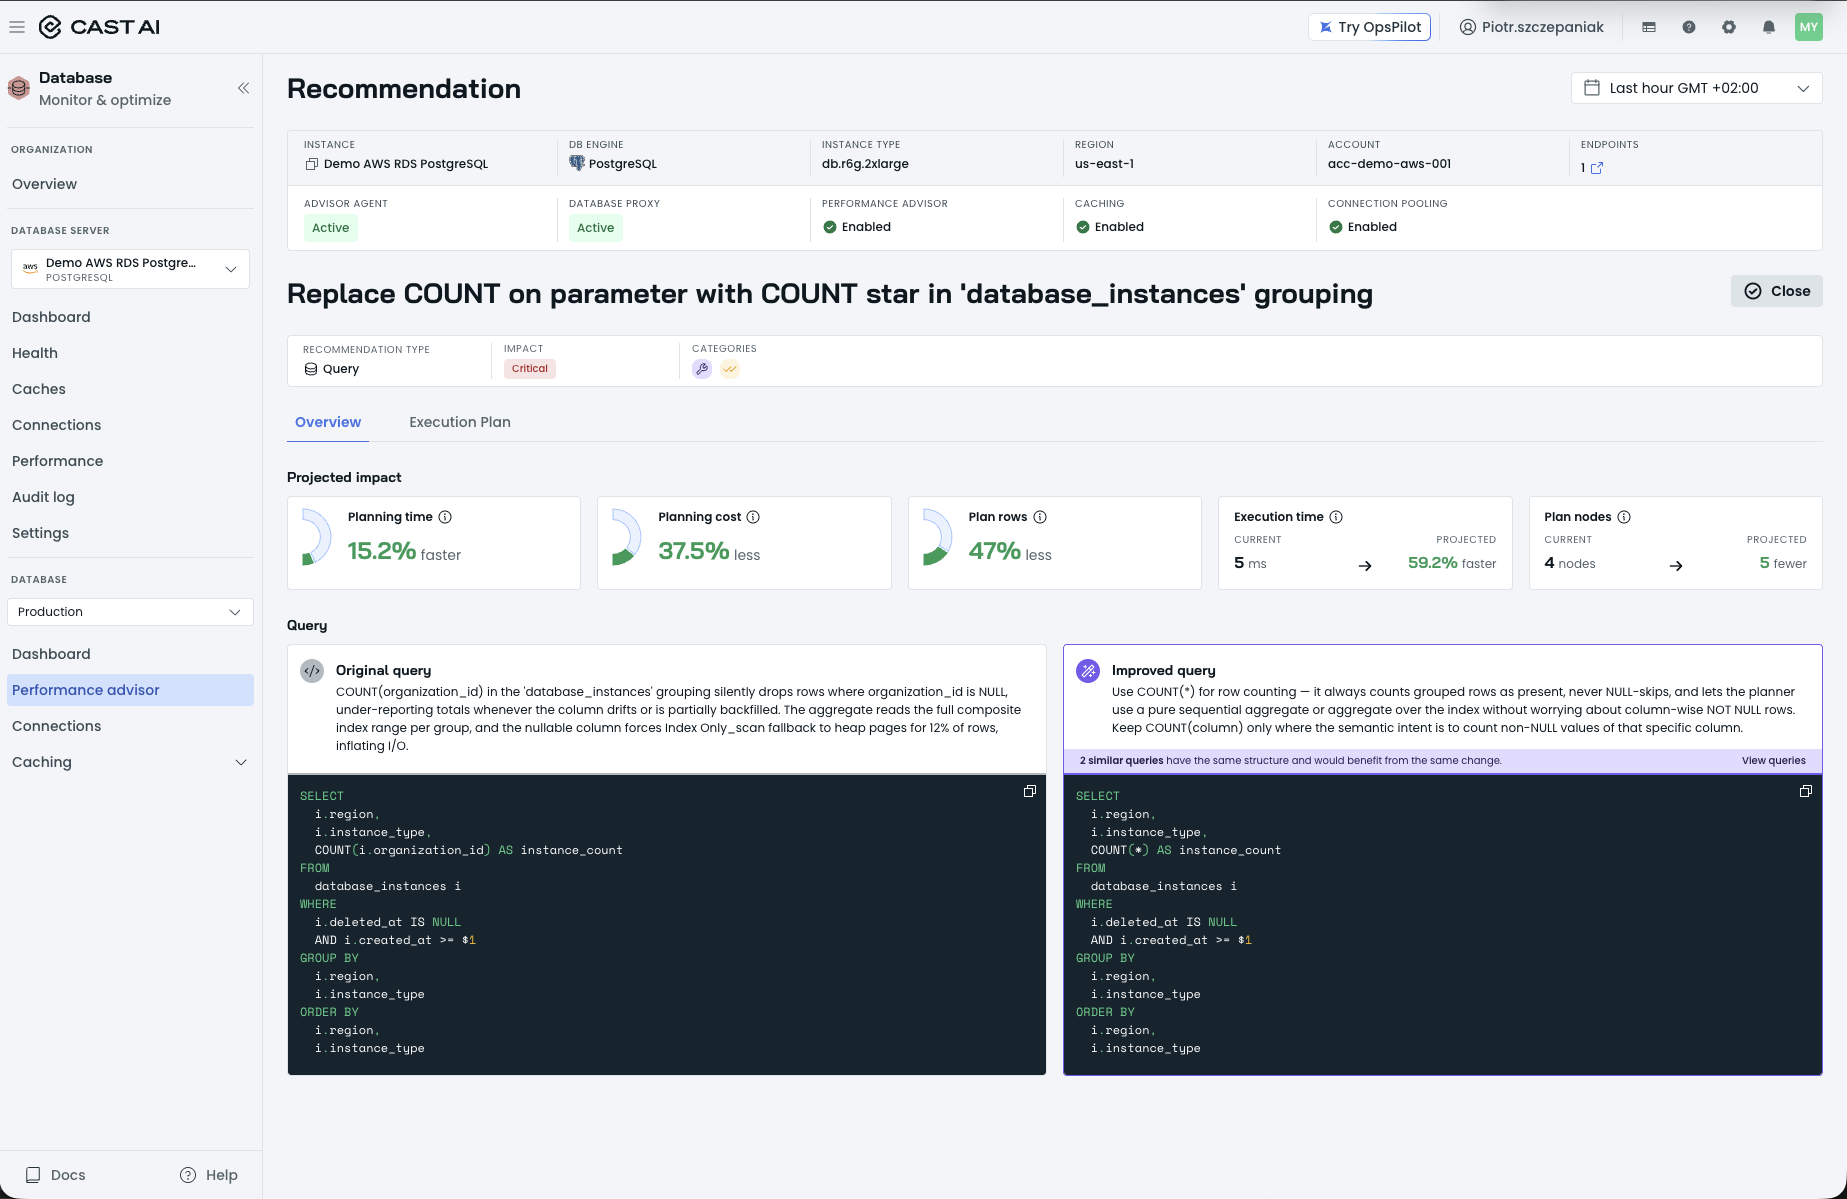
A query recommendation's detail page, with the projected-impact metrics and the Original versus Improved query panels.
Analysis scope and affected queries
The instance dashboard shows a Performance advisor card per database. Its Analysis scope (for example, 350 queries / 120 indexes) is what the agent examined in the selected period; Affected queries and Affected queries DB time measure how much of that scope the open advisories touch. The card headline counts the advisories ("Found 9 advisories that could improve your current database performance"), and View advisories → opens the full page for that database.
Next steps
Updated 3 hours ago