

Performance estimation and cost savings
DBO never asks you to enable caching on faith. While the proxy watches your traffic, it projects what caching will deliver (a projected hit rate, projected cache hits, and projected DB time savings) and then shows those projections beside the actual results for as long as the database is cached. Every projection comes from observed query traffic, so the numbers are specific to your workload, not generic benchmarks.
Where you see projected vs. actual
-
Organization Overview: the Cache hits card reports the org-wide hit rate with a projection delta (for example, "↑75% PROJECTED") and lists TOP CANDIDATES, the databases with the most projected upside.
-
Instance Caches tab: the Cache hits card pairs HIT RATE with PROJECTED HIT RATE (68.4% vs 82.1% in the demo instance; 71.8% vs 84.3% in the AWS RDS demo) and TOTAL CACHE HITS with PROJECTED CACHE HITS ("+ 96.87K more")
The Database time card pairs CURRENT DB TIME SAVINGS (45.2%) with PROJ. SAVINGS (57.9%).
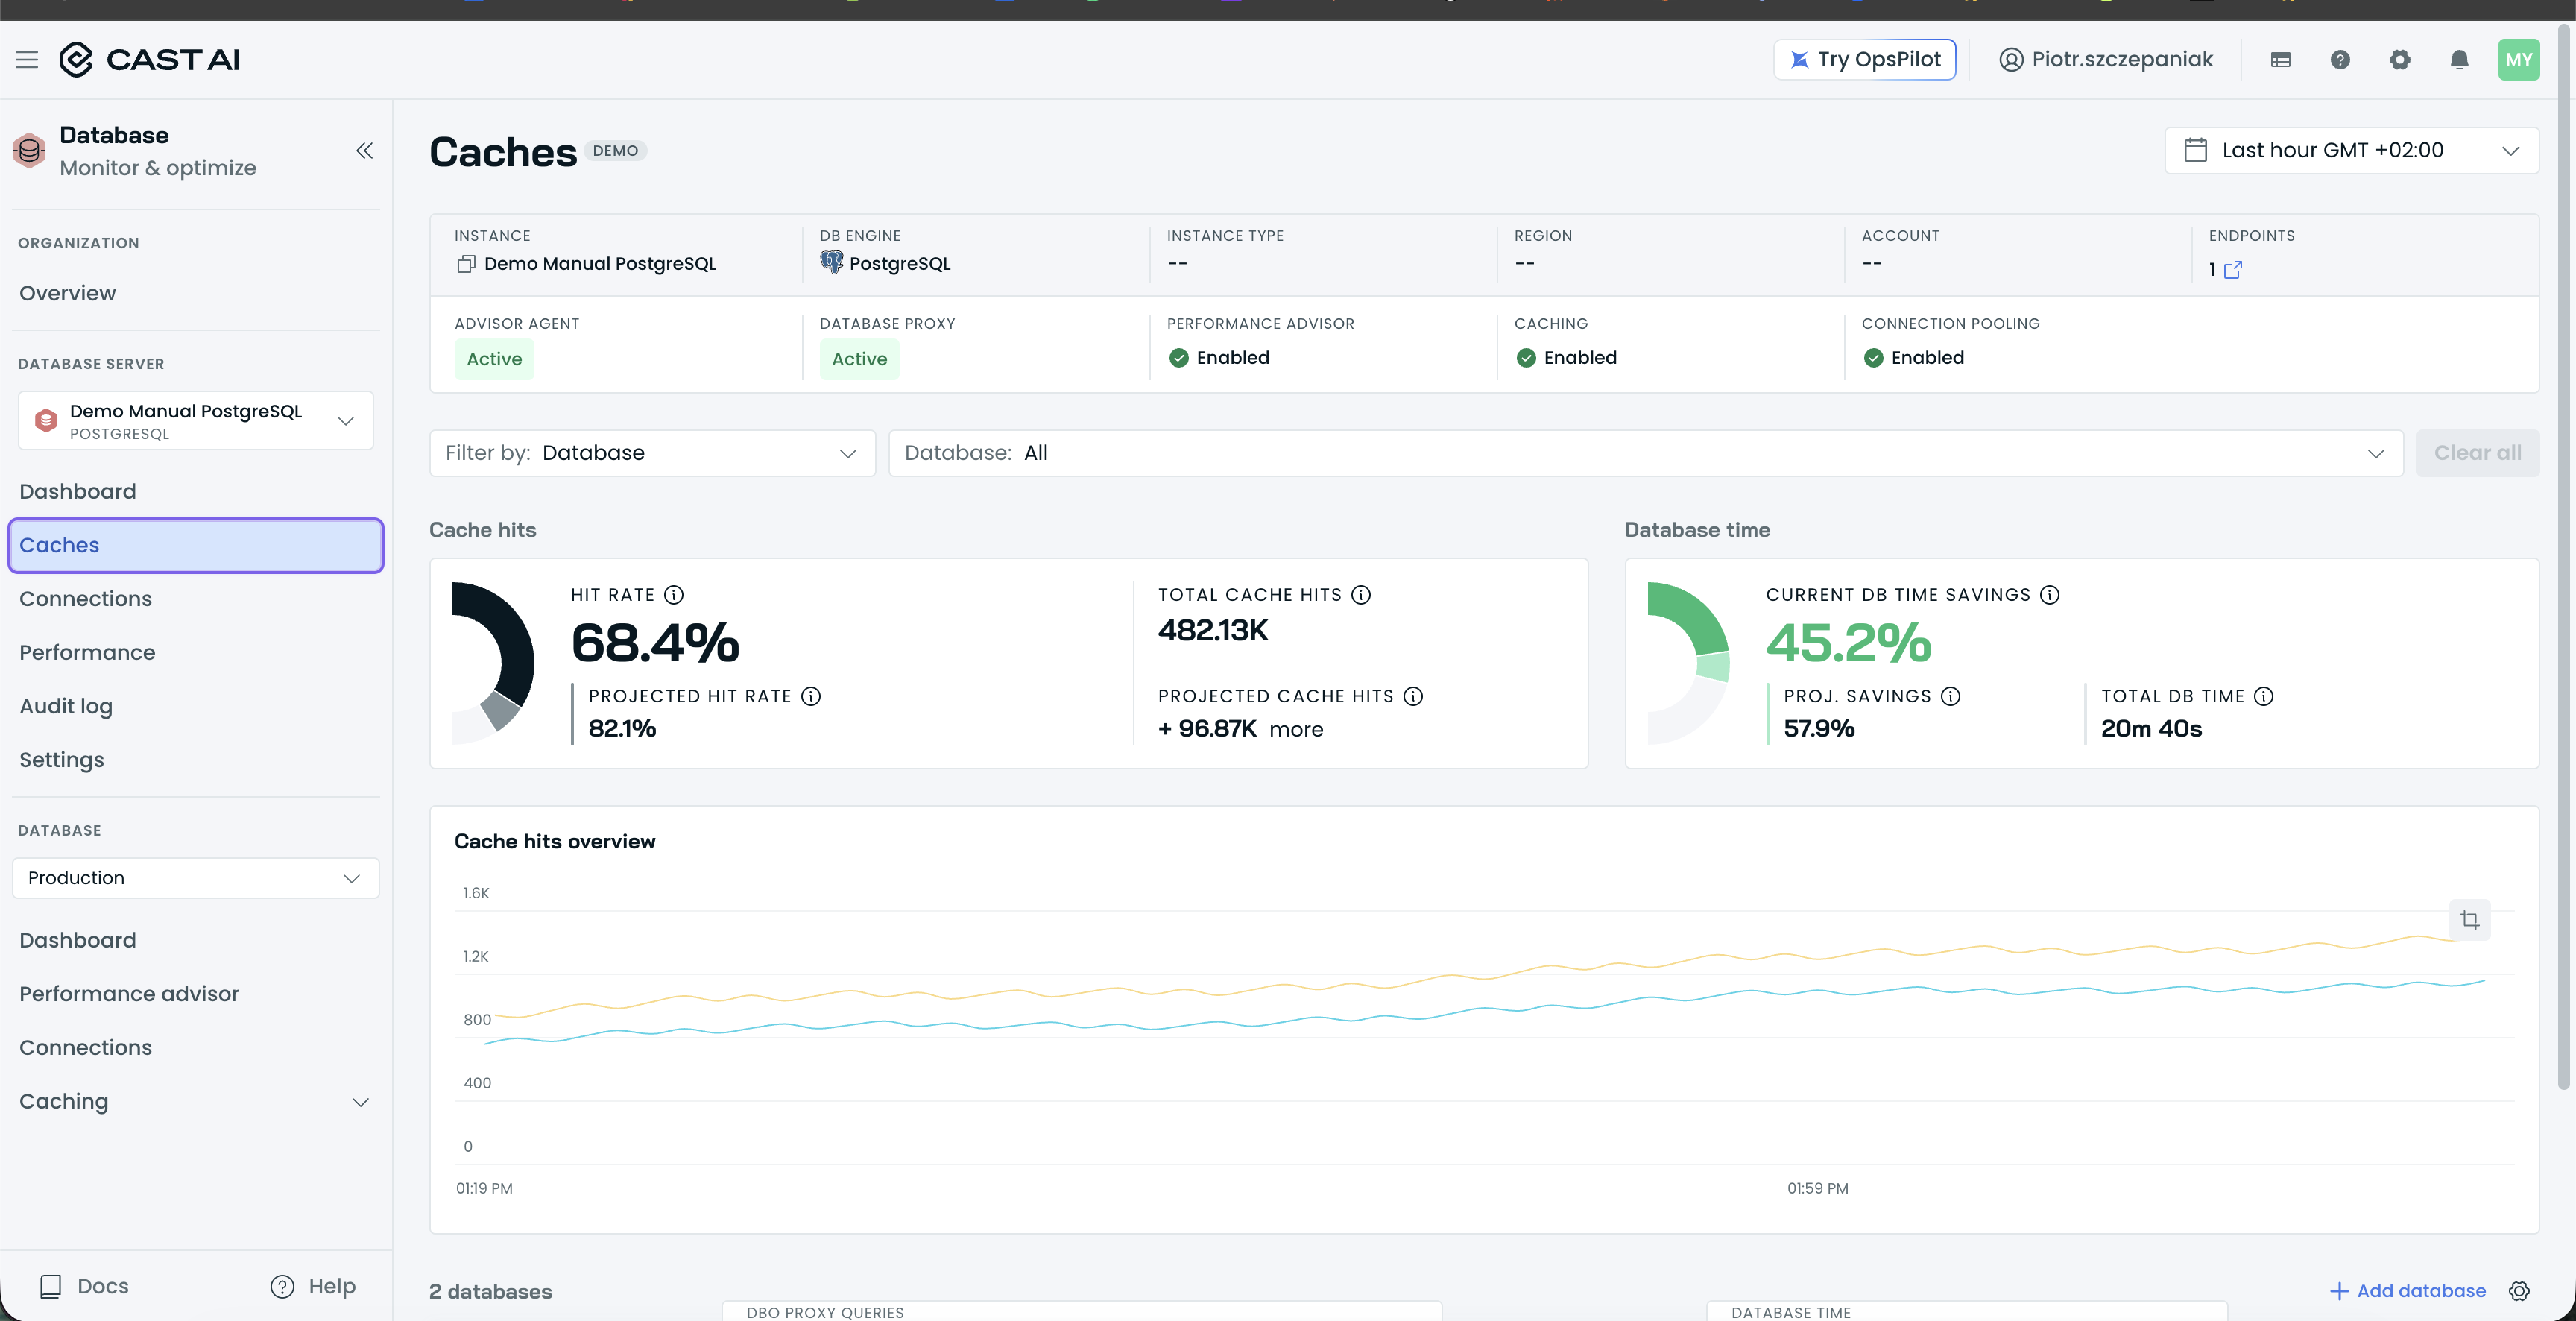
The instance Caches tab, with the Cache hits and Database time cards pairing actuals with projections.
- Database Caching → Overview: the same Cache hits performance and Database time cards at database scope (65.02% vs 77.94% and 41.9% vs 54.8% in the demo), plus the Execution time card that shows where the savings come from: AVG. MISS TIME 34.7 ms versus AVG. HIT TIME 2.1 ms.
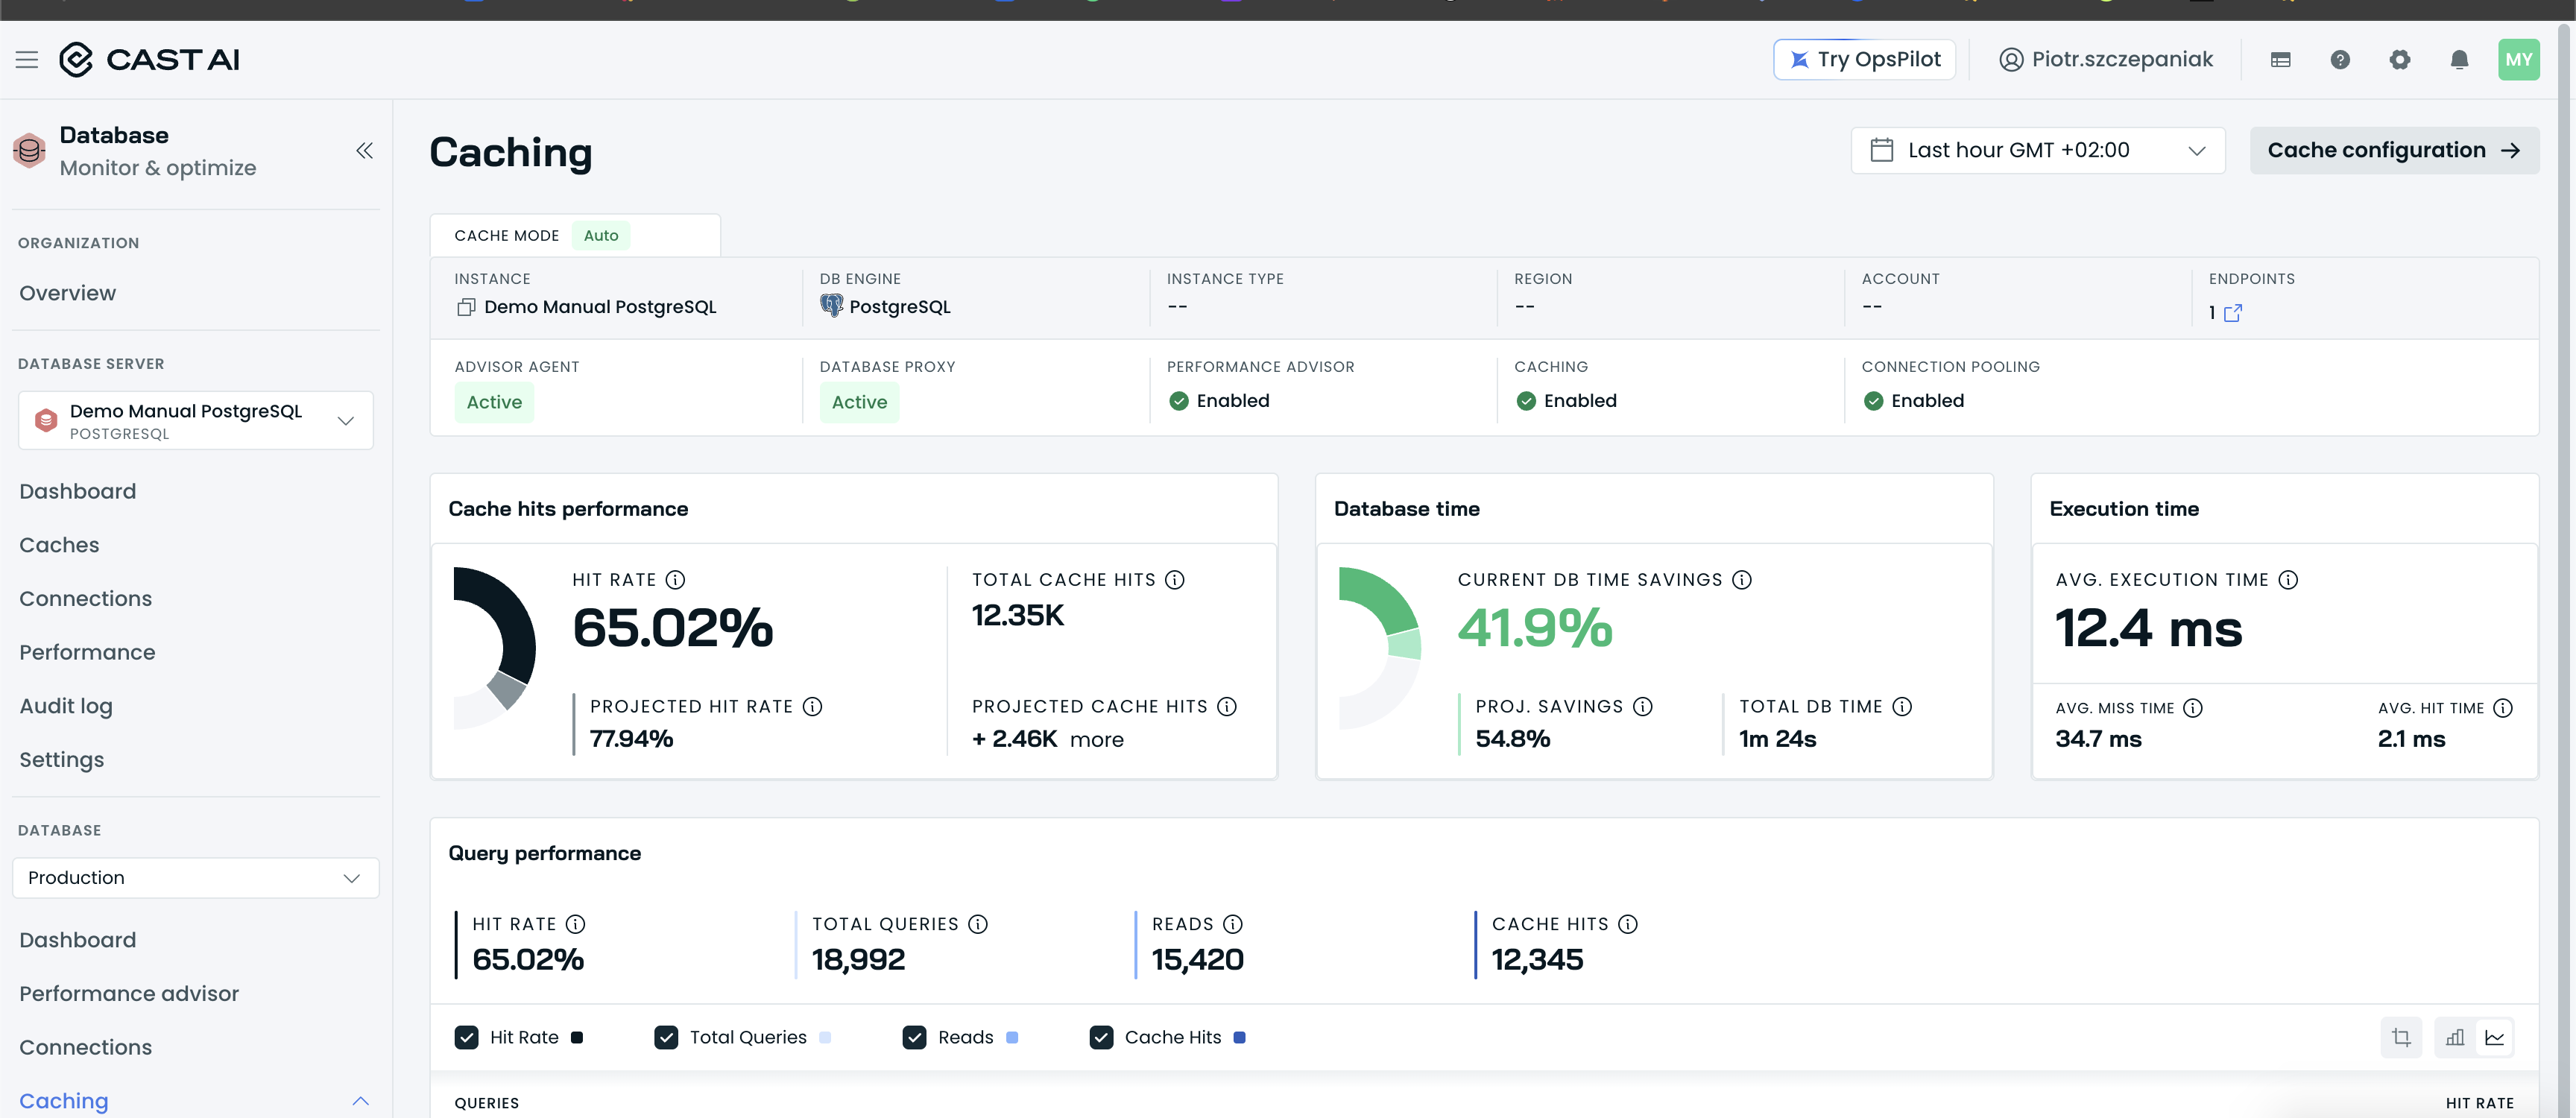
The database-level Cache hits performance and Database time cards, with the same projections at database scope.
- Caching → Queries table: per-query projections rendered as arrows, such as HIT RATE 94.02% → 99.9% and DATABASE TIME SAVINGS 68% → 77%, with the current value first and the projected value after the arrow.
How projections power safe onboarding
The projections are what make DBO's two-phase onboarding safe. In the first phase your databases run monitor-only while the proxy observes the workload and computes the projections you see on these cards; with nothing cached, there is nothing to break. When the projected hit rate and PROJ. SAVINGS justify it, you enable caching in Auto mode and the projections become your baseline. Getting started walks through the full flow.
Reading the headroom that remains
The gap between an actual number and its projection is your remaining upside:
- A hit rate close to its PROJECTED HIT RATE means the cache is doing everything the model expects, and the projected DB time savings are being realized as real load reduction.
- A persistent gap means cacheable reads are still reaching the database. Open Caching → Queries, sort by HIT RATE, and look for high-traffic templates with low hit rates; tune them with override rules (see Auto vs. Manual mode and override rules) or give their entries more time to live via the TTL.
Watch the two numbers move together after every change: if the actual climbs toward the projection, the change is working; if the projection itself drops, the workload has shifted and the model is re-baselining.
Over time, the savings compound: CURRENT DB TIME SAVINGS on the Database time card is query work your database no longer executes, and you can return that load as headroom to downsize the instance, retire read replicas, or absorb growth without scaling up.
Next steps
Updated 2 hours ago