

Database dashboard
Every database on an instance has its own dashboard, where DBO measures and tunes Performance Advisor, Caching, and Connection Pooling for that database alone. Get there from the instance dashboard by selecting the database's name, or from the Select database picker under DATABASE in the left nav.
What's on the page
The database dashboard repeats the instance-level chrome, scoped to this database:
- Header tiles: INSTANCE (the parent instance, for example Demo Manual PostgreSQL), DB ENGINE, INSTANCE TYPE, REGION, ACCOUNT, and ENDPOINTS.
- The status row: ADVISOR AGENT and DATABASE PROXY Active, and PERFORMANCE ADVISOR, CACHING, and CONNECTION POOLING Enabled.
- The time-range picker (for example, "Last hour GMT +02:00") and a last-refreshed stamp (for example, "September 24, 14:18").
- Database-level navigation: Dashboard, Performance advisor, Connections, and Caching, which expands to Overview, Queries, and Rules.
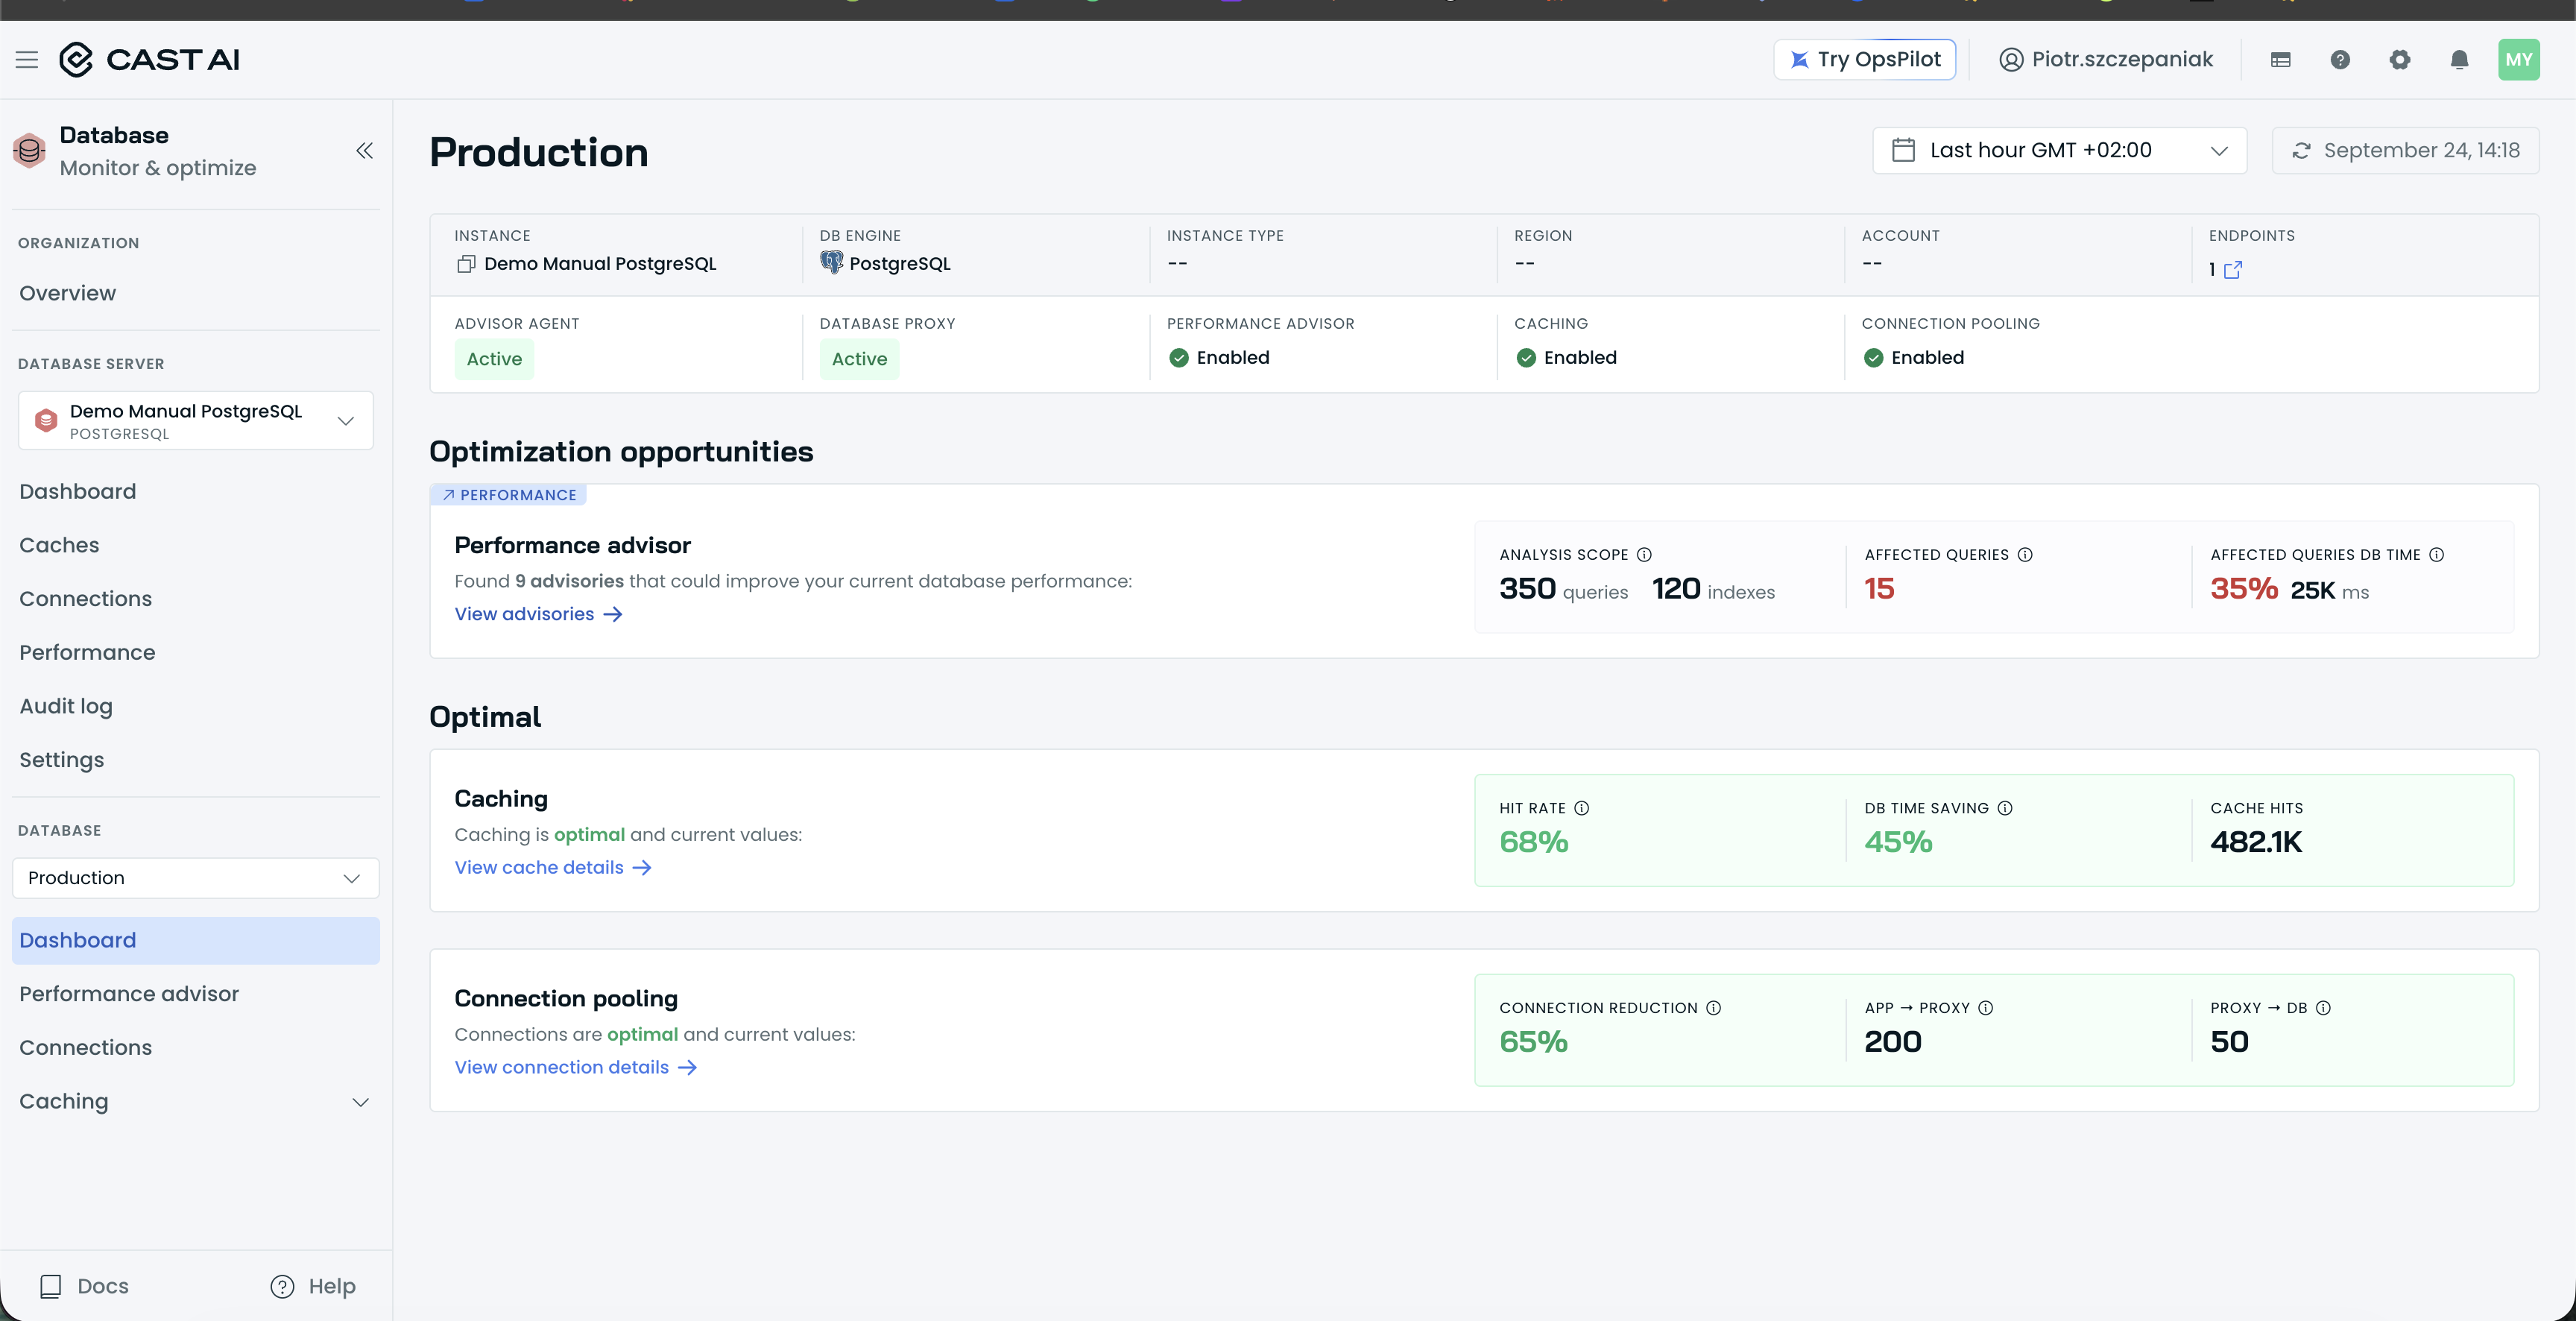
The database dashboard, with the header tiles, the status row, and the Optimization opportunities and Optimal sections.
Optimization opportunities
The Optimization opportunities section collects the cards for features that still have headroom, where DBO has found something you can act on. In the demo fleet this is the Performance advisor card (badged PERFORMANCE): "Found 9 advisories that could improve your current database performance:", with ANALYSIS SCOPE (350 queries / 120 indexes), AFFECTED QUERIES (15), and AFFECTED QUERIES DB TIME (35% 25K ms). View advisories → opens the full recommendation list.
Optimal
The Optimal section holds the cards for features that are already tuned: nothing to action, only the current numbers:
- Caching: "Caching is optimal and current values:", with HIT RATE (68%), DB TIME SAVING (45%), and CACHE HITS (482.1K). View cache details → opens the database's Caching views.
- Connection pooling: "Connections are optimal and current values:", with CONNECTION REDUCTION (65%), APP → PROXY (200), and PROXY → DB (50). View connection details → opens the database's Connections view.
Read the two sections as a worklist: Optimization opportunities tells you what to fix next, and Optimal confirms what's already earning its keep. As you apply recommendations and tune caching and pooling, cards move between the sections to reflect the current state.
How this relates to the instance dashboard
These cards mirror the per-database cards on the instance dashboard, with the same three features and the same metrics, but every number is scoped to this database rather than aggregated across the instance. Each card's View … → link takes you to that feature's full page for this database: Performance Advisor, Caching, or Connection Pooling.
Next steps
Updated 2 hours ago